. 2021 Apr 27;13(9):2107.
doi: 10.3390/cancers13092107.

Identification of CRYAB+ KCNN3+ SOX9+ Astrocyte-Like and EGFR+ PDGFRA+ OLIG1+ Oligodendrocyte-Like Tumoral Cells in Diffuse IDH1-Mutant Gliomas and Implication of NOTCH1 Signalling in Their Genesis

Affiliations

Identification of CRYAB+ KCNN3+ SOX9+ Astrocyte-Like and EGFR+ PDGFRA+ OLIG1+ Oligodendrocyte-Like Tumoral Cells in Diffuse IDH1-Mutant Gliomas and Implication of NOTCH1 Signalling in Their Genesis

Meera Augustus et al. Cancers (Basel). .

Abstract

Diffuse grade II IDH-mutant gliomas are slow-growing brain tumors that progress into high-grade gliomas. They present intratumoral cell heterogeneity, and no reliable markers are available to distinguish the different cell subtypes. The molecular mechanisms underlying the formation of this cell diversity is also ill-defined. Here, we report that SOX9 and OLIG1 transcription factors, which specifically label astrocytes and oligodendrocytes in the normal brain, revealed the presence of two largely nonoverlapping tumoral populations in IDH1-mutant oligodendrogliomas and astrocytomas. Astrocyte-like SOX9+ cells additionally stained for APOE, CRYAB, ID4, KCNN3, while oligodendrocyte-like OLIG1+ cells stained for ASCL1, EGFR, IDH1, PDGFRA, PTPRZ1, SOX4, and SOX8. GPR17, an oligodendrocytic marker, was expressed by both cells. These two subpopulations appear to have distinct BMP, NOTCH1, and MAPK active pathways as stainings for BMP4, HEY1, HEY2, p-SMAD1/5 and p-ERK were higher in SOX9+ cells. We used primary cultures and a new cell line to explore the influence of NOTCH1 activation and BMP treatment on the IDH1-mutant glioma cell phenotype. This revealed that NOTCH1 globally reduced oligodendrocytic markers and IDH1 expression while upregulating APOE, CRYAB, HEY1/2, and an electrophysiologically-active Ca2+-activated apamin-sensitive K+ channel (KCNN3/SK3). This was accompanied by a reduction in proliferation. Similar effects of NOTCH1 activation were observed in nontumoral human oligodendrocytic cells, which additionally induced strong SOX9 expression. BMP treatment reduced OLIG1/2 expression and strongly upregulated CRYAB and NOGGIN, a negative regulator of BMP. The presence of astrocyte-like SOX9+ and oligodendrocyte-like OLIG1+ cells in grade II IDH1-mutant gliomas raises new questions about their role in the pathology.

Keywords: BMP; NOTCH1 pathway; brain tumors; cellular heterogeneity; diffuse IDH1-mutant gliomas; diffuse grade II IDH-mutant glioma.


Conflict of interest statement

The authors declare no conflict of interest.

Figures
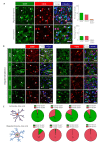
Figure 1
Figure 1
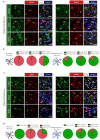
Two nonoverlapping cell subpopulations detected in IDH-DGIIG. (A) Immunofluorescence performed on one oligodendroglioma and one astrocytoma using antibodies against SOX9 (green) and OLIG1 (red) revealed the presence of two nonoverlapping cell subpopulations. White arrowheads mark cells expressing either SOX9 or OLIG1 alone. Scale bars = 20 µm. Bar diagrams show the percentage of SOX9+ cells (green), OLIG1+ cells (red), and percentage of cells double-positive for SOX9+ and OLIG1+ (orange) among the total number of cells. The two subpopulations were also detected in other cases (see Figure S2A). (B) SOX9+ cells show specific protein expression. Double stainings for APOE, CRYAB, KCNN3, and ID4 with SOX9 or OLIG1 showed their preferential expression in SOX9+ cells. White arrowheads identify double-positive cells, while yellow arrowheads/arrows represent single positive cells. Scale bars = 20 µm. (C) Pie diagrams representing the percentage of double-positive (green) and single-positive (red) cells in SOX9+ (upper lane) and OLIG1+ (lower lane) populations. Numbers indicate the percentage of double-positive cells.
Figure 2
Figure 2
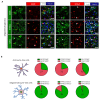
OLIG1+ cells express proteins associated with oligodendrocyte lineage and neural precursor cells. Double immunofluorescences for indicated proteins on one oligodendroglioma. White arrowheads identify double-positive cells, while yellow arrowheads/arrows represent single-positive cells. Scale bars = 20 µm. (A) Double stainings for GPR17, PDGFRα, and SOX8 with SOX9 or OLIG1 revealed their preferential association with OLIG1+ cells in one oligodendroglioma. (B,D) Pie diagrams representing the percentage of double-positive (green) and single-positive (red) cells in SOX9+ and OLIG1+ populations. Numbers indicate the percentage of double-positive cells. (C) Double stainings for ASCL1, SOX2, and SOX4 with SOX9 or OLIG1 revealed the preferential association of ASCL1 and SOX4 with OLIG1+ cells in one oligodendroglioma, while SOX2 was expressed by both populations.
Figure 3
Figure 3
SOX9+ cells express specific signalling proteins and transcription factors. (AC) Double immunofluorescences in one oligodendroglioma for HEY1, HEY2, BMP4, p-SMAD1/5, and p-ERK with SOX9 and OLIG1 revealed their preferential expression in SOX9+ cells. White arrowheads identify double-positive cells, while yellow arrowheads/arrows show single-positive cells. Scale bars = 20 µm. (D) Pie diagrams representing the percentage of double-positive (green) and single-positive (red) cells in SOX9+ and OLIG1+ cells. Numbers indicate the percentage of double-positive cells.
Figure 4
Figure 4
OLIG1+ cells express specific receptors and IDH1. (A) Double immunofluorescences in one oligodendroglioma for EGFR, PTPRZ1, and IDH1 with SOX9 and OLIG1 revealed their preferential expression with OLIG1+ cells. White arrowheads identify double-positive cells, while yellow arrowheads/arrows represent single-positive cells. Scale bars = 20 µm. (B) Pie diagrams representing the percentage of double-positive (green) and single-positive (red) cells in SOX9+ and OLIG1+ cells. Numbers indicate the percentage of double-positive cells.
Figure 5
Figure 5
NOTCH1 activation modifies IDH-DGIIG cell phenotype and reduces proliferation. (A,B) QPCR analysis for indicated genes in O4-purified primary cultures containing a high % of tumoral cells (>70%; n = 4 cases, astrocytomas) (A) and in LGG275 cells (n = 5 independent experiments) (B). Values represent the mean ± SEM of gene expression fold change observed in cells transduced with NICD-YFP vs. YFP lentiviruses. Genes in blue and brown are markers found preferentially associated with SOX9+ and OLIG1+ cells, respectively, on IDH-DGIIG sections. Tests = two-tailed t-tests. (C) Immunofluorescence for indicated proteins in YFP or NICD-YFP transduced LGG275 cells. White and yellow arrowheads show YFP+ cells that are positive or negative for the assessed protein, respectively. Note the nuclear localization of the NOTCH1 activated form (NICD) after transduction with NICD-YFP lentivirus. Scale bars = 20 µm. (D) Quantification of MKI67+ cells in LGG275 cells transduced with YFP and NICD-YFP lentiviruses. Values represent the mean ± SEM of the percentage of MKI67+ cells observed in YFP+ cells (n = 12 fields, 2 independent experiments). Test = two-tailed t-test. (E) QPCR analysis for indicated genes in LGG275 cells treated with NOTCH1 signalling inhibitors (DAPT, LY411575, 10 µM) for 5 days (n = 4 independent experiments). Values represent the mean ± SEM of gene expression fold change observed in treated vs. control cells. Tests = two-tailed t-tests. Genes in blue and brown are markers found preferentially associated with SOX9+ and OLIG1+ cells, respectively, on IDH-DGIIG sections. Tests = two-tailed t-tests. *, **, ***, **** represent p <0.05, <0.01, <0.001 and <0.0001 significance respectively.
Figure 6
Figure 6
NOTCH1 induces KCCN3/SK3 channels. BMP influence on IDH-DGIIG cell phenotype. (A) Immunofluorescence for KCNN3/SK3 channels in YFP and NICD-YFP transduced LGG275 cells. Changes in cellular morphology upon NOTCH1 activation are also visible. Scale bars = 20 µm. (B) KCNN3/SK3 currents induced by NOTCH1 signalling. Channel activity was studied in YFP+ cells using the whole-cell patch-clamp technique under a voltage-clamp configuration. Left panels: Representative currents recorded by applying a 600 ms electrical ramp from −80 mV holding potential to +50 mV in control-YFP (top) and NICD-YFP transduced (bottom) cells in the three indicated conditions (a,b,c). An increase in current density was observed in the presence of 10 µM ionomycin (to increase the intracellular Ca2+ level) in YFP-NICD transduced cells (blue curve). This ionomycin-induced current increase was specifically blocked by 1 µM apamin (a specific SK channel blocker; red curve). Right panels: Bar charts showing the means ± SEM of current densities obtained at +40 mV from current/voltage curves obtained after 500 ms voltage steps from −80 mV holding potential to +40 mV every 10 mV in YFP and YFP-NICD transduced cells. Ionomycin-induced and apamin-sensitive current densities were significantly higher in YFP-NICD transduced cells compared to control cells (n = 6 cells, 3 independent experiments, test = two-tailed t-test). (C) QPCR analysis for indicated genes in LGG275 cells treated for BMP2 or BMP4 (10 ng/mL) for 5 days (n = 4 independent experiments). Values represent the mean ± SEM of gene expression fold change observed in treated vs. control cells. Genes in blue and brown are markers found preferentially associated with SOX9+ and OLIG1+ cells, respectively, on IDH-DGIIG sections. Tests = two-tailed t-tests. (D) Immunofluorescence for CRYAB in control or BMP2/4-treated LGG275 cells. White and yellow arrowheads show CRYAB+ and CRYAB cells, respectively. Scale bars = 10 µm. (E) Quantification of CRYAB+ cells after BMP2/4 treatment. Values represent the mean ± SEM of a percentage of CRYAB+ cells in control or treated cells. (n = 7 fields, 3 coverslips). (F) Graphical summary of main results. Transcription factors are in blue. *, **, ***, **** represent p <0.05, <0.01, <0.001 and <0.0001 significance respectively.

References

    1. Ostrom Q.T., Gittleman H., Truitt G., Boscia A., Kruchko C., Barnholtz-Sloan J.S. CBTRUS Statistical Report: Primary Brain and Other Central Nervous System Tumors Diagnosed in the United States in 2011–2015. Neuro Oncol. 2018;20:iv1–iv86. doi: 10.1093/neuonc/noy131. - DOI - PMC - PubMed
    1. Louis D.N., Ohgaki H., Wiestler O.D., Cavenee W.K. World Health Organization Histological Classification of Tumours of the Central Nervous System. International Agency for Research on Cancer; Lyon, France: 2016.
    1. Pekmezci M., Rice T., Molinaro A.M., Walsh K.M., Decker P.A., Hansen H., Sicotte H., Kollmeyer T.M., McCoy L.S., Sarkar G., et al. Adult infiltrating gliomas with WHO 2016 integrated diagnosis: Additional prognostic roles of ATRX and TERT. Acta Neuropathol. 2017;133:1001–1016. doi: 10.1007/s00401-017-1690-1. - DOI - PMC - PubMed
    1. Mandonnet E., Delattre J.Y., Tanguy M.L., Swanson K.R., Carpentier A.F., Duffau H., Cornu P., Van Effenterre R., Alvord E.C., Jr., Capelle L. Continuous growth of mean tumor diameter in a subset of grade II gliomas. Ann. Neurol. 2003;53:524–528. doi: 10.1002/ana.10528. - DOI - PubMed
    1. Parsons D.W., Jones S., Zhang X., Lin J.C., Leary R.J., Angenendt P., Mankoo P., Carter H., Siu I.M., Gallia G.L., et al. An integrated genomic analysis of human glioblastoma multiforme. Science. 2008;321:1807–1812. doi: 10.1126/science.1164382. - DOI - PMC - PubMed