Review
. 2021 Apr 27;13(5):624.
doi: 10.3390/pharmaceutics13050624.

Advances in Twin-Screw Granulation Processing

Affiliations
Review

Advances in Twin-Screw Granulation Processing

Uttom Nandi et al. Pharmaceutics. .

Abstract

Twin-screw granulation (TSG) is a pharmaceutical process that has gained increased interest from the pharmaceutical industry for its potential for the development of oral dosage forms. The technology has evolved rapidly due to the flexibility of the equipment design, the selection of the process variables and the wide range of processed materials. Most importantly, TSG offers the benefits of both batch and continuous manufacturing for pharmaceutical products, accompanied by excellent process control, high product quality which can be achieved through the implementation of Quality by Design (QbD) approaches and the integration of Process Analytical Tools (PAT). Here, we present basic concepts of the various twin-screw granulation techniques and present in detail their advantages and disadvantages. In addition, we discuss the detail of the instrumentation used for TSG and how the critical processing paraments (CPP) affect the critical quality attributes (CQA) of the produced granules. Finally, we present recent advances in TSG continuous manufacturing including the paradigms of modelling of continuous granulation process, QbD approaches coupled with PAT monitoring for granule optimization and process understanding.

Keywords: PAT tools; QbD; continuous processing; granulation mechanisms; twin-screw granulation.


Conflict of interest statement

The authors declare no conflict of interest.

Figures

Figure 1
Figure 1
Diagram of granule formation (Reproduced with permission from [19], Elsevier, 2019).
Figure 2
Figure 2
Schematic diagram of an extruder (image was kindly offered by Coperion GmbH).
Figure 3
Figure 3
Geometry of an extruder screw (Reproduced with permission from [25], Elsevier, 2002).
Figure 4
Figure 4
Twin screw co-rotating and counter-rotating screw (reproduced with permission from [31], IOPscience under Creative Commons Attribution 3.0 licence).
Figure 5
Figure 5
Conveying elements (a) and mixing elements (b).
Figure 6
Figure 6
Photo showing a wet twin-screw granulation (TSG) wet of microcrystalline cellulose/lactose monohydrate mixture with a kneading block (right most side of the image). The direction of flow is to the right.
Figure 7
Figure 7
Schematic representation of a twin screw granulator (Reproduced with permission from [46], Elsevier, 2020).
Figure 8
Figure 8
Screw configuration with 12 kneading disks illustrating the formation of granules in TSG (Reproduced with permission from [62], John Wiley and Sons, 2017).
Figure 9
Figure 9
(a) Granule regime map for TSG using conveying screws, (b) Representation of different areas in the screw channel in 2D and (c) Snapshot showing different areas in the screw channel with surface velocity vectors (Reproduced with permission from [63], Elsevier, 2013).
Figure 10
Figure 10
Nucleation mechanism of melt granulation (Reproduced with permission from [71], Elsevier, 1996).
Figure 11
Figure 11
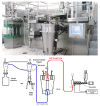
ConsiGmaTM continuous high shear granulation process by GEA Group (images provided by the manufacturer).
Figure 12
Figure 12
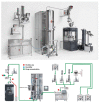
MODCOS continuous high shear granulation process by Glatt (images provided by the manufacturer).
Figure 13
Figure 13
Pictures of two sieve fractions of the seven granule loads (500–710 μm and 1000–1400 μm) (Reproduced with permission from [87], Elsevier, 2014).
Figure 14
Figure 14
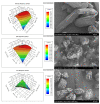
Response surface plots of Ibuprofen (IBU) release, specific surface area and particle size distribution dependent variables (Left). Scanning electron microscopy images of (A) bulk IBU, (B) F2 granules (DCPA/Polymer 1.0, Binder 8.0%, L/S ratio 0.30) and (C) F10 granules (DCPA/Polymer 1.0, Binder 8.0%, L/S ratio 0.30) (Right) Reproduced with permission from [89], Elsevier, 2017.
Figure 15
Figure 15
PC1 vs. PC2 biplot of the determined compaction properties (loadings) for the experimental runs of the DOE (scores). The numbers represent corresponding experimental run of HCT-EPO formulations (blue triangles), HCTSOL formulations (dark red circles) and HCT-VA64 formulations (orange boxes), plotted against loadings (star shaped) for which PF represents the plasticity factor, IER the anti-correlated in-die elastic recovery, PF slope the slope of the plasticity factor over 4 compaction pressures, Py the heckel value and Db the fragmentation factor. Reproduced with permission from [90], Elsevier, 2018.
Figure 16
Figure 16
(a) Raman spectra: PC 1 (47.12%) versus PC 2 (26.95%) scores plot, (b) Raman spectra: PC 2 (26.95%) versus PC 3 (16.24%) scores plot, (c) Raman spectroscopy: PC A loadings plots of PC 1, PC 2, and PC 3, (d) NIR spectroscopy: Second derivative of NIR spectra. Coloured applied as above for Cluster A (dashed line) and Cluster B (full line) (Reproduced with permission from [101], Elsevier, 2012.
Figure 17
Figure 17
Stages of image processing: (a) Raw image; (b) Pre-processing; (c,d) Post-processing (Reproduced with permission from [108], Elsevier, 2018.
Figure 18
Figure 18
User interface of the developed Online Image Analysis software. (a) Current picture being analysed (b) Dv10, Dv50 and Dv90 over time (c) Particle size distribution (d) Current Particle size and Average Diameter (e) Control Panel for the peristaltic pump.
Figure 19
Figure 19
Representative images captured during experiments using 7KE90 configuration at L/S ratio of 0.15 (a), 0.25 (b), 0.30 (c) (Reproduced with permission from [109], Elsevier, 2018).

Similar articles

Cited by

References

    1. Parikh D.M. Handbook of Pharmaceutical Granulation Technology. CRC Press; Boca Raton, FL, USA: 2016.
    1. Walker G.M. In: Chapter 4 Drum Granulation Processes. Granulation, Salman A.D., Hounslow M.J., Seville JPKBT-H of PT, editors. Elsevier Science B.V.; Radarweg, The Netherlands: 2007. pp. 219–254.
    1. Bolhuis G.K., de Waard H. Compaction properties of directly compressible materials. Pharm. Powder Compact. Technol. 2011;2:154.
    1. Aulton M.E., Taylor K.M.G. Aulton’s Pharmaceutics. 4th ed. Churchill Livingstone Elsevier; Edinburgh, UK: 2013. Pharmaceutical Preformulation.
    1. Aulton M.E. Pharmaceutics. The Science of Dosage Form Design. 2nd ed. Churchill Livingstone; Harcourt Publ Limited; London, UK: 2005.

LinkOut - more resources