. 2021 Apr 27;22(9):4598.
doi: 10.3390/ijms22094598.

Combined Transcriptomic and Proteomic Analysis of Perk Toxicity Pathways

Affiliations

Combined Transcriptomic and Proteomic Analysis of Perk Toxicity Pathways

Rebeka Popovic et al. Int J Mol Sci. .

Abstract

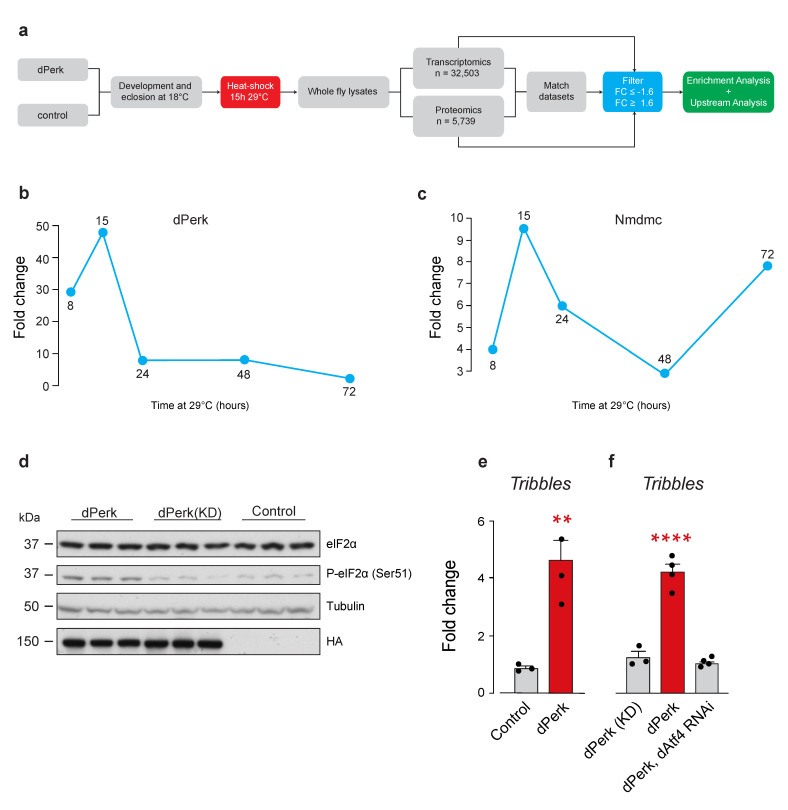
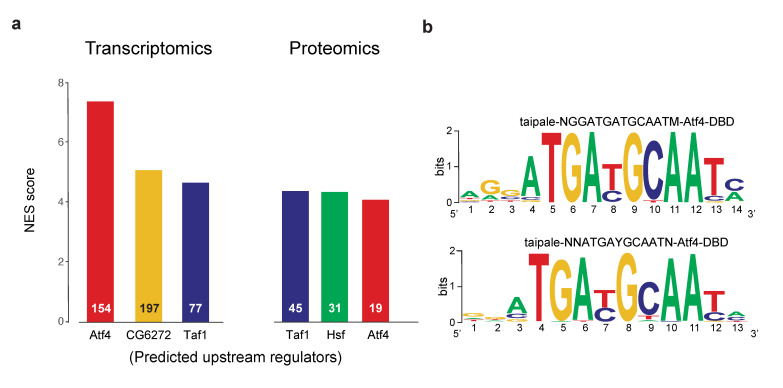
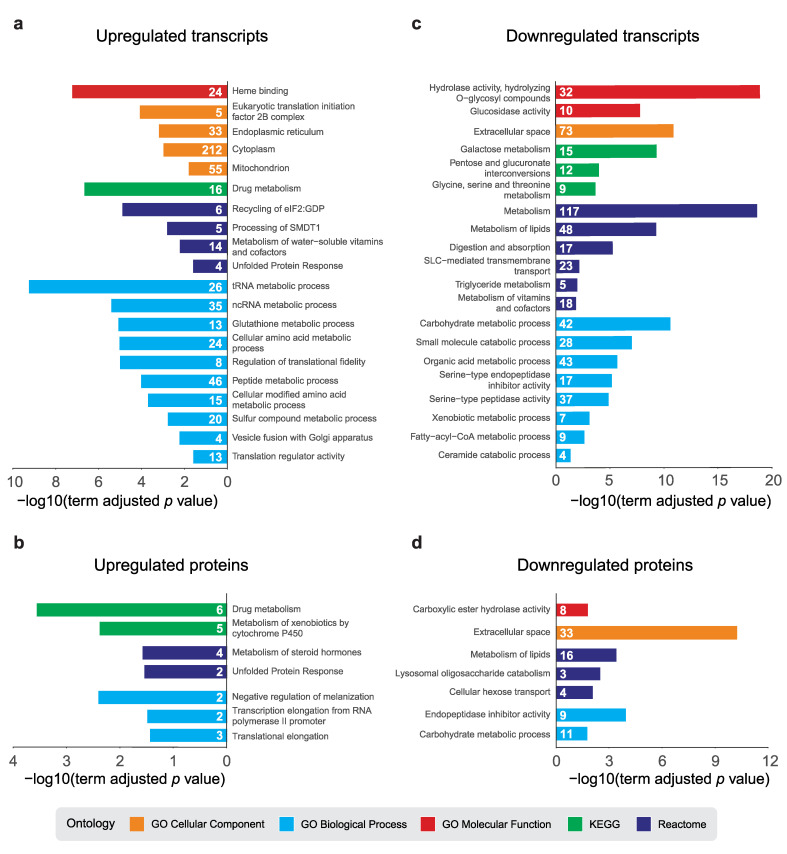
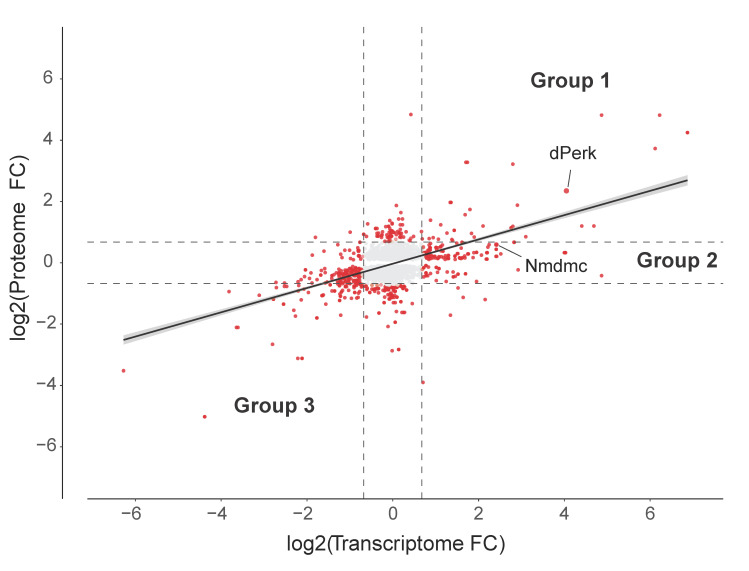
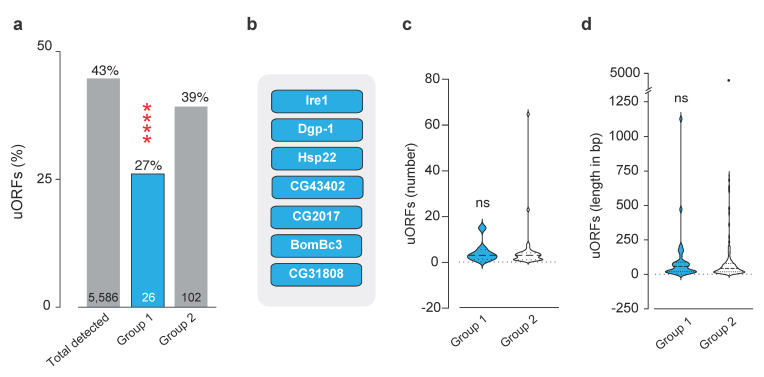
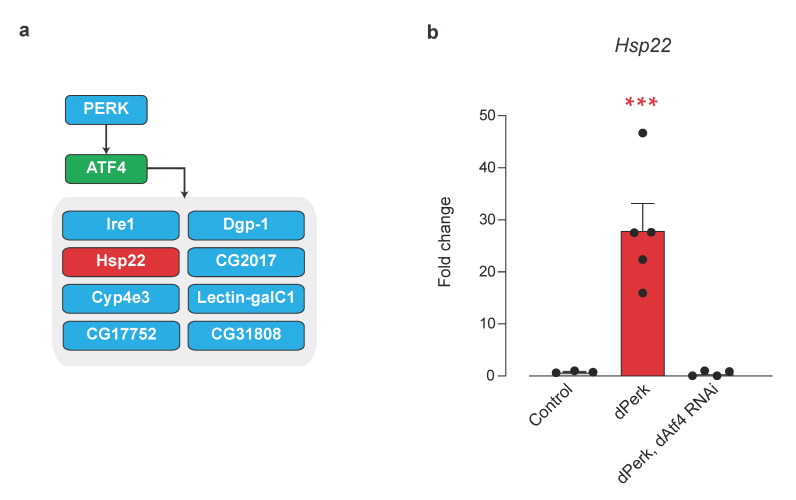
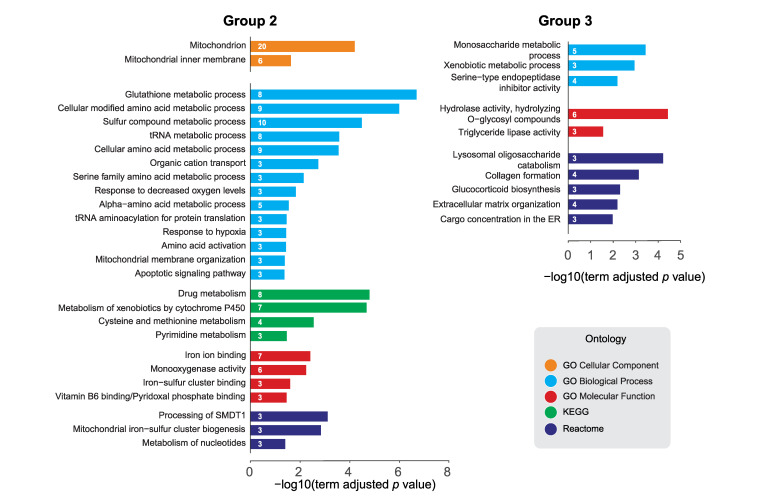
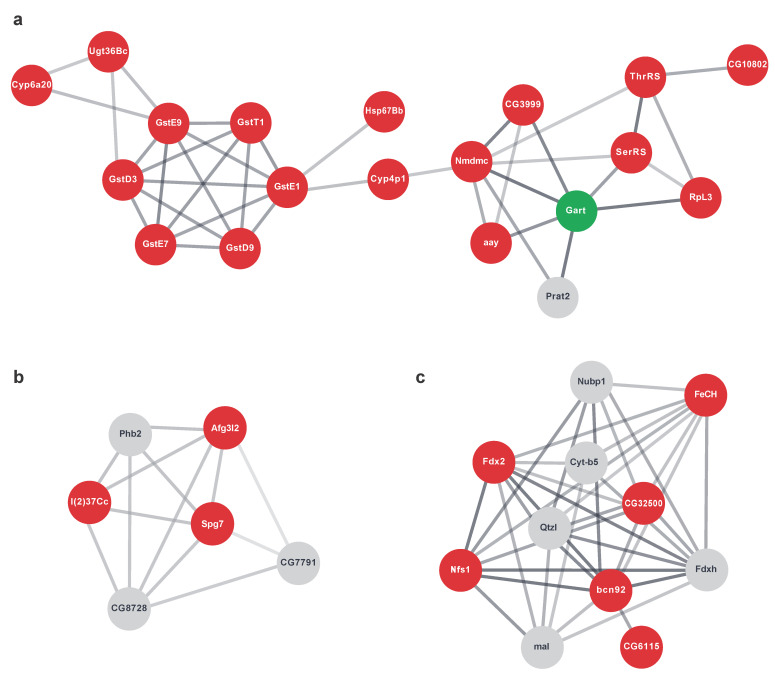
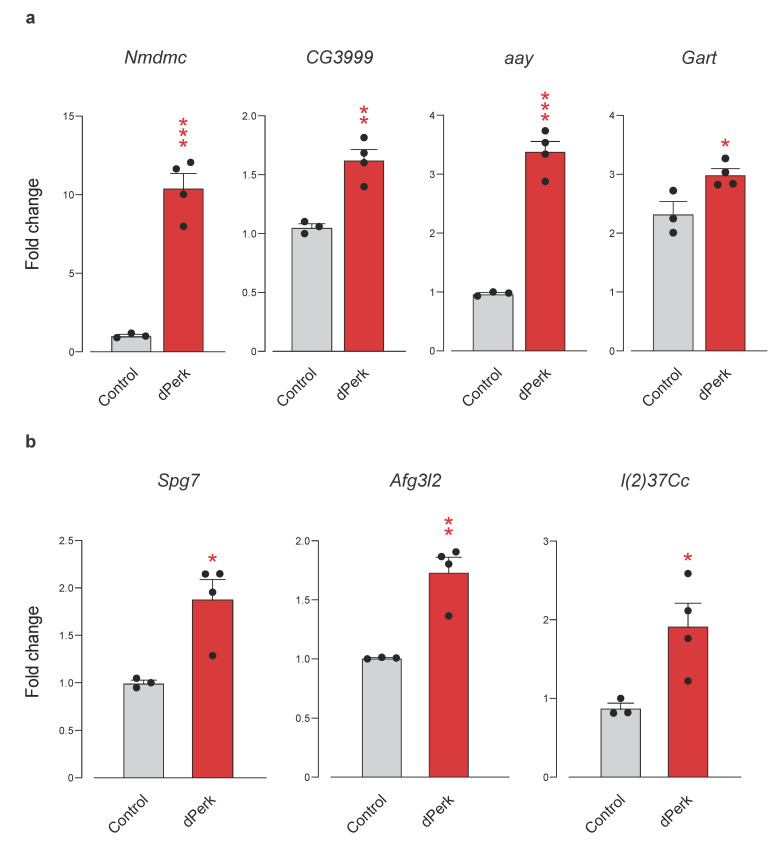
In Drosophila, endoplasmic reticulum (ER) stress activates the protein kinase R-like endoplasmic reticulum kinase (dPerk). dPerk can also be activated by defective mitochondria in fly models of Parkinson's disease caused by mutations in pink1 or parkin. The Perk branch of the unfolded protein response (UPR) has emerged as a major toxic process in neurodegenerative disorders causing a chronic reduction in vital proteins and neuronal death. In this study, we combined microarray analysis and quantitative proteomics analysis in adult flies overexpressing dPerk to investigate the relationship between the transcriptional and translational response to dPerk activation. We identified tribbles and Heat shock protein 22 as two novel Drosophila activating transcription factor 4 (dAtf4) regulated transcripts. Using a combined bioinformatics tool kit, we demonstrated that the activation of dPerk leads to translational repression of mitochondrial proteins associated with glutathione and nucleotide metabolism, calcium signalling and iron-sulphur cluster biosynthesis. Further efforts to enhance these translationally repressed dPerk targets might offer protection against Perk toxicity.

Keywords: Drosophila; Drosophila protein kinase RNA (PKR)-like ER kinase (dPerk); ER stress; activating transcription factor 4 (ATF4); unfolded protein response.


Conflict of interest statement

The authors declare no conflict of interest.

Figures

Figure 1
Figure 1
Drosophila dPerk regulates tribbles mRNA levels. (a) Workflow used for the characterisation of dPerk-dependent transcripts and proteins. To identify differentially expressed targets, transcripts and proteins were filtered by adjusted false discovery rate (FDR) and fold change (FC) values of 0.05 and ±1.6, respectively. The expression levels of transcripts and proteins were compared and further submitted for enrichment and upstream analysis. (b,c) dPerk or Nmdmc mRNA induction were assessed for different durations of the heat shock treatment (in hours (h)). The figure shows fold-change mRNA levels compared to the control, measured by real-time qPCR. (d) Western blot analysis of total and phospho-eIF2α protein levels in dPerk-HA, kinase-dead dPerk (KD)-HA and control flies following 15 h heat-shock at 29 °C. Whole-fly lysates were analysed using the indicated antibodies. (e) Tribbles (trbl), an endoplasmic reticulum stress marker, was upregulated in dPerk flies following 15 h of heat shock, as measured by real-time qPCR (mean ± SEM; asterisks, unpaired t-test). (f) Trbl overexpression is dAtf4 dependent and requires dPerk kinase function (15 h heat shock at 29 °C), as measured by real-time qPCR (mean ± SEM; asterisks, one-way ANOVA with Tukey’s multiple comparison test). Genotypes: Control: tubGal80; daGal4 > +, dPerk: tubGal80; daGal4 > dPerk-HA, dPerk(KD): tubGal80; daGal4 > dPerk-K671R-HA, dPerk, dAtf4 RNAi: tubGal80; daGal4 > dPerk-HA, dAtf4 RNAi.
Figure 2
Figure 2
Upstream analysis of dPerk-upregulated transcripts and proteins. (a) Predicted upstream regulators of upregulated transcripts (left) and proteins (right) and their respective NES scores. The number of targets regulated by the specific transcription factor (TF) is presented on the bars. (b) Highest-ranking motifs of the ATF4 TF observed in upregulated transcripts. The analysis was performed using iRegulon, a Cytoscape application.
Figure 3
Figure 3
dPerk-dependent global expression changes. ClueGO pathway enrichment analysis (PEA) of differentially regulated molecules. Selected results from the Gene Ontology (GO) Cellular Component, GO Biological Process, GO Molecular Function, KEGG and Reactome, ontology terms and their respective −log10 (adjusted term p-value) are shown. The number of associated molecules of a specific functional term is displayed on the bars. ClueGO PEA of upregulated transcripts (a) and proteins (b). ClueGO PEA of downregulated transcripts (c) and proteins (d).
Figure 4
Figure 4
dPerk differential expression analysis (DEA). Comparison of dPerk-dependent fold change (FC) expression in the transcriptome and proteome (logged). Differentially expressed molecules are shown in red (adjusted false discovery rate (FDR) ≤ 0.05 and FC±1.6). The DEA shows a proportion of genes consistently regulated between the transcriptome and proteome (Pearson’s correlation, r = 0.5, p-value < 2.2 × 10⁻¹⁶) and a number of differentially regulated transcripts and proteins. The two subgroups of genes with upregulated transcripts, representing potentially protective pathways are indicated. Group 1 represents dPerk-dependent targets that show upregulation in both transcripts and proteins; group 2 represents translationally repressed targets that only show an upregulation of transcripts, with the absence of a change in protein levels. Group 3 represents targets that are repressed at both the transcript and protein level. dPerk and Nmdmc are indicated by black lines.
Figure 5
Figure 5
Analysis of upstream open reading frames (uORFs) in group 1 and group 2 genes. (a) Levels of uORFs, present either in the total number of molecules detected at both transcript and protein levels (total detected, Supplementary Table S16), compared to number of uORFs in group 1 or 2 (Supplementary Tables S17 and S18). Significance was calculated using a Monte Carlo test, see methods, p < 0.00001 and p = 0.10, respectively. The numbers inside the bars correspond to the total number of genes in each group. (b) Group 1 targets with uORFs. (c,d) uORF features were assessed, for respectively, (c), the number of uORFs per gene (median + 95% CI, Wilcoxon Rank Sum Test, p = 0.7) or (d), the uORF length per gene (median + 95% CI, Wilcoxon Rank Sum Test, p = 0.7).
Figure 6
Figure 6
Mitochondrial chaperone Hsp22 is a target of dPerk/Atf4 signalling. (a) iRegulon analysis of group 1 genes suggests ATF4 (green) as a transcriptional regulator of Hsp22 (red). Blue squares denote group 1 genes characterised by an upstream ATF4 binding motif. (b) Hsp22 mRNA induction is regulated by dPerk and dAtf4. Expression levels were measured by real-time qPCR (mean ± SEM; asterisks, one-way ANOVA with Tukey’s multiple comparison test). Genotypes: Control: tubGal80; daGal4 > +, dPerk: tubGal80; daGal4 > dPerk-HA, dPerk, dAtf4 RNAi: tubGal80; daGal4 > dPerk-HA, dAtf4 RNAi. Adult flies were heat-shock for 15 h at 29 °C.
Figure 7
Figure 7
ClueGO pathway enrichment analysis (PEA) of dPerk-dependent targets. Genes that were upregulated at the transcript level but not at the protein level (group 2, left) and genes that were downregulated at the transcript and protein level (group 3, right) were analysed. PEA was performed using ClueGO, a Cytoscape application. Selected results from the Gene Ontology (GO) Cellular Component, GO Biological Process, GO Molecular Function, KEGG and Reactome, ontology terms and their -log10 (adjusted term p-value) are shown. The number of targets of a specific functional term is displayed on the bars.
Figure 8
Figure 8
String network analysis of dPerk-dependent targets differentially regulated by the transcriptome and proteome. Genes upregulated at the transcript level but not at the protein level were analysed (group 2, red). Clusters were determined using the inbuilt Cytoscape stringApp Markov Cluster (MCL) algorithm. Clusters were enriched with first neighbours from the background transcriptomic network in order to find additional functionally related targets not recognised by the TMT labelling. The nodes representing molecules with an upregulation in transcript levels but no available protein value (grey) and molecules with an upregulation in transcripts and downregulation in protein levels (green) were added. Molecular pathways involved in glutathione and nucleotide metabolism (a), processing of essential mitochondrial calcium uniporter regulator (EMRE) (b) and iron-sulphur metabolism (c) are shown.
Figure 9
Figure 9
dPerk overexpression causes an upregulation in mRNA levels of molecules regulating nucleotide metabolism and mitochondrial calcium signalling. (a) dPerk overexpression results in transcriptional upregulation of nucleotide metabolism genes NAD-dependent methylenetetrahydrofolate dehydrogenase (Nmdmc), CG3999, a glycine dehydrogenase (GLDC) orthologue, astray (aay) and GART trifunctional enzyme (Gart). (b) dPerk overexpression results in transcriptional upregulation of the Paraplegin (Spg7), AFG3 like matrix AAA peptidase subunit 2 (Afg3l2) and lethal (2) 37Cc (l(2)37Cc) genes involved in essential mitochondrial calcium uniporter regulator (EMRE) processing. Expression levels were measured by real-time qPCR. All bar plots show the mean ± SEM; asterisks, unpaired t-test. Genotypes, Control: tubGal80; daGal4 > +, dPerk: tubGal80; daGal4 > dPerk-HA. Adult flies were heat-shock for 15 h at 29 °C.

References

    1. Hughes D., Mallucci G.R. The unfolded protein response in neurodegenerative disorders—Therapeutic modulation of the PERK pathway. FEBS J. 2019;286:342–355. doi: 10.1111/febs.14422. - DOI - PubMed
    1. Halliday M., Mallucci G.R. Modulating the unfolded protein response to prevent neurodegeneration and enhance memory. Neuropathol. Appl. Neurobiol. 2015;41:414–427. doi: 10.1111/nan.12211. - DOI - PMC - PubMed
    1. Chen S., Novick P., Ferro-Novick S. ER structure and function. Curr. Opin. Cell Biol. 2013;25:428–433. doi: 10.1016/j.ceb.2013.02.006. - DOI - PMC - PubMed
    1. Kozutsumi Y., Segal M., Normington K., Gething M.J., Sambrook J. The presence of malfolded proteins in the endoplasmic reticulum signals the induction of glucose-regulated proteins. Nature. 1988;332:462–464. doi: 10.1038/332462a0. - DOI - PubMed
    1. Harding H.P., Zhang Y., Ron D. Protein translation and folding are coupled by an endoplasmic-reticulum-resident kinase. Nature. 1999;397:271–274. doi: 10.1038/16729. - DOI - PubMed

MeSH terms

LinkOut - more resources