. 2021 Apr 27;18(9):4655.
doi: 10.3390/ijerph18094655.

Relationship of Test Positivity Rates with COVID-19 Epidemic Dynamics

Affiliations

Relationship of Test Positivity Rates with COVID-19 Epidemic Dynamics

Yuki Furuse et al. Int J Environ Res Public Health. .

Abstract

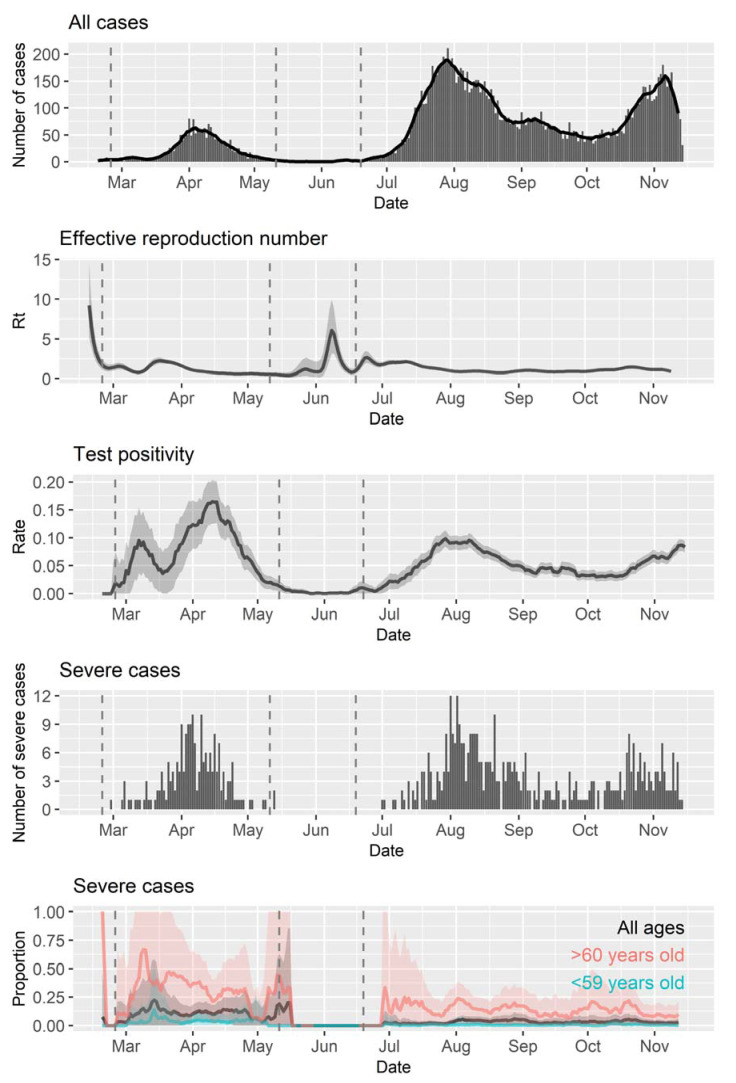
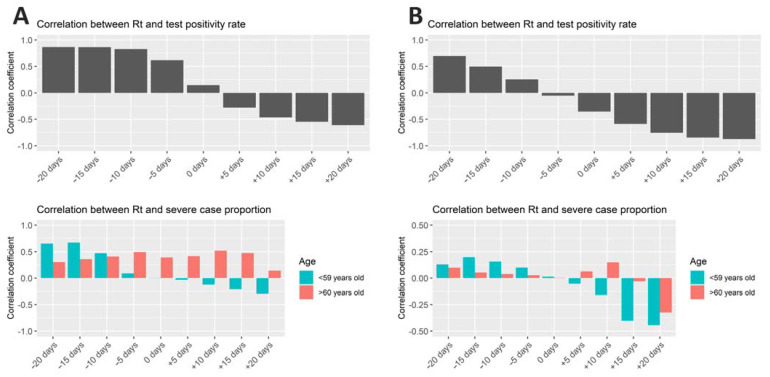
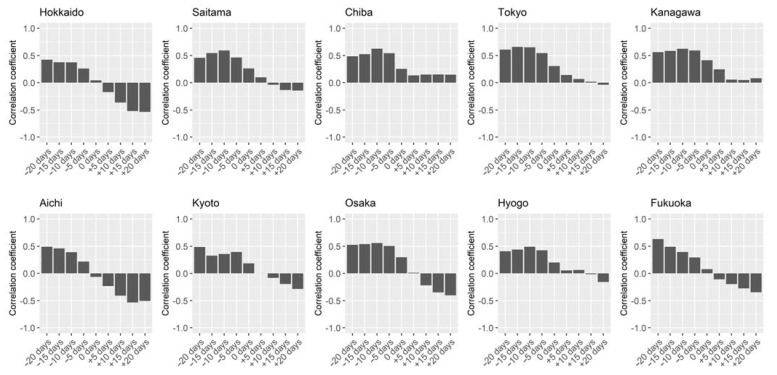
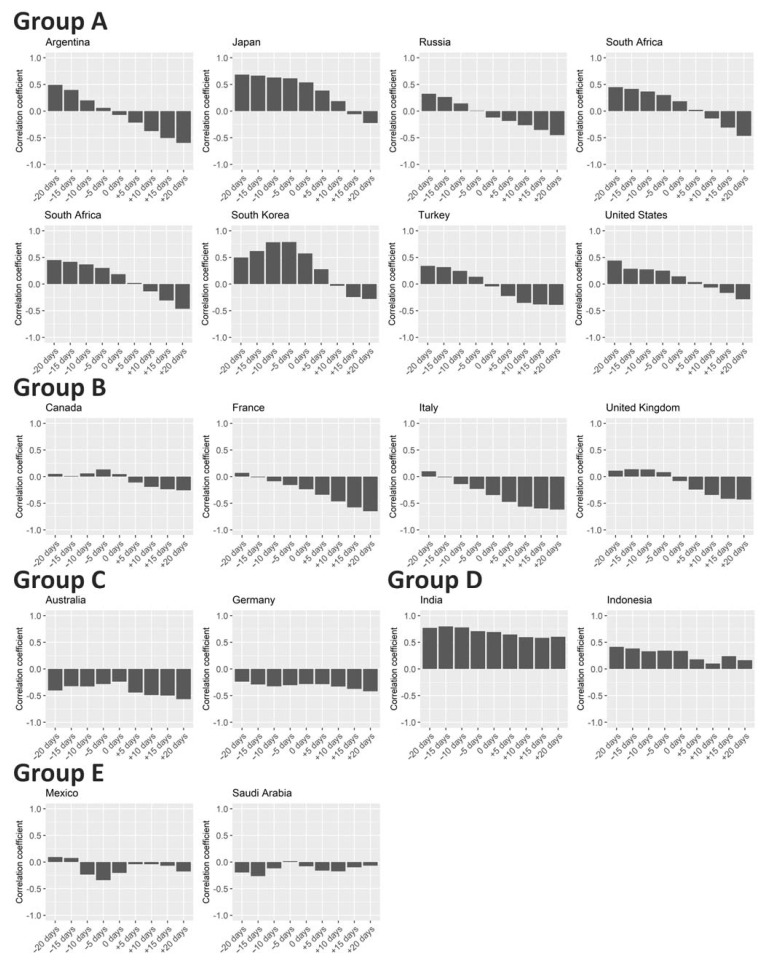
Detection and isolation of infected people are believed to play an important role in the control of the COVID-19 pandemic. Some countries conduct large-scale screenings for testing, whereas others test mainly people with high prior probability of infection such as showing severe symptoms and/or having an epidemiological link with a known or suspected case or cluster of cases. However, what a good testing strategy is and whether the difference in testing strategy shows a meaningful, measurable impact on the COVID-19 epidemic remain unknown. Here, we showed that patterns of association between effective reproduction number (Rt) and test positivity rate can illuminate differences in testing situation among different areas, using global and local data from Japan. This association can also evaluate the adequacy of current testing systems and what information is captured in COVID-19 surveillance. The differences in testing systems alone cannot predict the results of epidemic containment efforts. Furthermore, monitoring test positivity rates and severe case proportions among the nonelderly can predict imminent case count increases. Monitoring test positivity rates in conjunction with the concurrent Rt could be useful to assess and strengthen public health management and testing systems and deepen understanding of COVID-19 epidemic dynamics.

Keywords: COVID-19; SARS-CoV-2; effective reproduction number; epidemics; laboratory diagnosis; outbreaks; pandemic; surveillance.


Conflict of interest statement

The authors declare no conflict of interest.

Figures

Figure 1
Figure 1
Timeline of epidemiological parameters in Osaka, Japan, from 20 January 2020 to 15 November 2020. Seven-day moving average is shown as a curved line for the number of cases. Shaded areas indicate 95% confidence intervals for Rt, rate of test positivity, and proportion of severe cases.
Figure 2
Figure 2
Correlation between effective reproduction number and test positivity rate/severe case proportion in Osaka. Spearman’s rank correlation coefficients between Rt and rate of test positivity (top panel) and those between Rt and proportion of severe cases (bottom panel) are shown for the Periods (A,B). Day-by-day rates of test positivity and proportions of severe cases were shifted ±20 days (by 5 days) for the calculation of correlation coefficient to see the time-lagged preceding and following associations with Rt.
Figure 3
Figure 3
Correlation between effective reproduction number and test positivity rate in 10 prefectures in Japan. Spearman’s rank correlation coefficients between Rt and rate of test positivity are shown for 10 prefectures in Japan from 9 August 2020 to 17 January 2021. Day-by-day rates of test positivity were shifted ±20 days (by 5 days) for the calculation of correlation coefficient to see the time-lagged preceding and following associations with Rt.
Figure 4
Figure 4
Correlation between effective reproduction number and test positivity rate in 17 countries. Spearman’s rank correlation coefficients between Rt and rate of test positivity are shown for 17 countries from 1 August 2020 to 17 January 2021. Day-by-day rates of test positivity were shifted ±20 days (by 5 days) for the calculation of correlation coefficient to see the time-lagged preceding and following associations with Rt. Countries were categorized into five groups described in the main text.
Figure 5
Figure 5
Association with the numbers of cases and tests. The total number of tests per case and the total number of cases per million people in each country reported by 17 January 2021 were plotted with colors according to the groups described in Figure 4. France was excluded from the panel because data of the total number of tests were not available.

References

    1. Berlin D.A., Gulick R.M., Martinez F.J. Severe Covid-19. N. Engl. J. Med. 2020;383:2451–2460. doi: 10.1056/NEJMcp2009575. - DOI - PubMed
    1. COVID-19 vaccines: Acting on the evidence. Nat. Med. 2021;27:183. doi: 10.1038/s41591-021-01261-5. - DOI - PMC - PubMed
    1. MacIntyre C.R. Case isolation, contact tracing, and physical distancing are pillars of COVID-19 pandemic control, not optional choices. Lancet Infect. Dis. 2020;20:1105–1106. doi: 10.1016/S1473-3099(20)30512-0. - DOI - PMC - PubMed
    1. Brauner J.M., Mindermann S., Sharma M., Johnston D., Salvatier J., Gavenčiak T., Stephenson A.B., Leech G., Altman G., Mikulik V., et al. Inferring the effectiveness of government interventions against COVID-19. Science. 2020;371:eabd9338. doi: 10.1126/science.abd9338. - DOI - PMC - PubMed
    1. Flaxman S., Mishra S., Gandy A., Unwin H.J.T., Mellan T.A., Coupland H., Whittaker C., Zhu H., Berah T., Eaton J.W., et al. Estimating the effects of non-pharmaceutical interventions on COVID-19 in Europe. Nature. 2020;584:257–261. doi: 10.1038/s41586-020-2405-7. - DOI - PubMed

Publication types

LinkOut - more resources