. 2021 Jul 27;144(4):271-282.
doi: 10.1161/CIRCULATIONAHA.120.053216. Epub 2021 Apr 30.

Spending on Cardiovascular Disease and Cardiovascular Risk Factors in the United States: 1996 to 2016

Affiliations

Spending on Cardiovascular Disease and Cardiovascular Risk Factors in the United States: 1996 to 2016

Maxwell Birger et al. Circulation. .

Abstract

Background: Spending on cardiovascular disease and cardiovascular risk factors (cardiovascular spending) accounts for a significant portion of overall US health care spending. Our objective was to describe US adult cardiovascular spending patterns in 2016, changes from 1996 to 2016, and factors associated with changes over time.

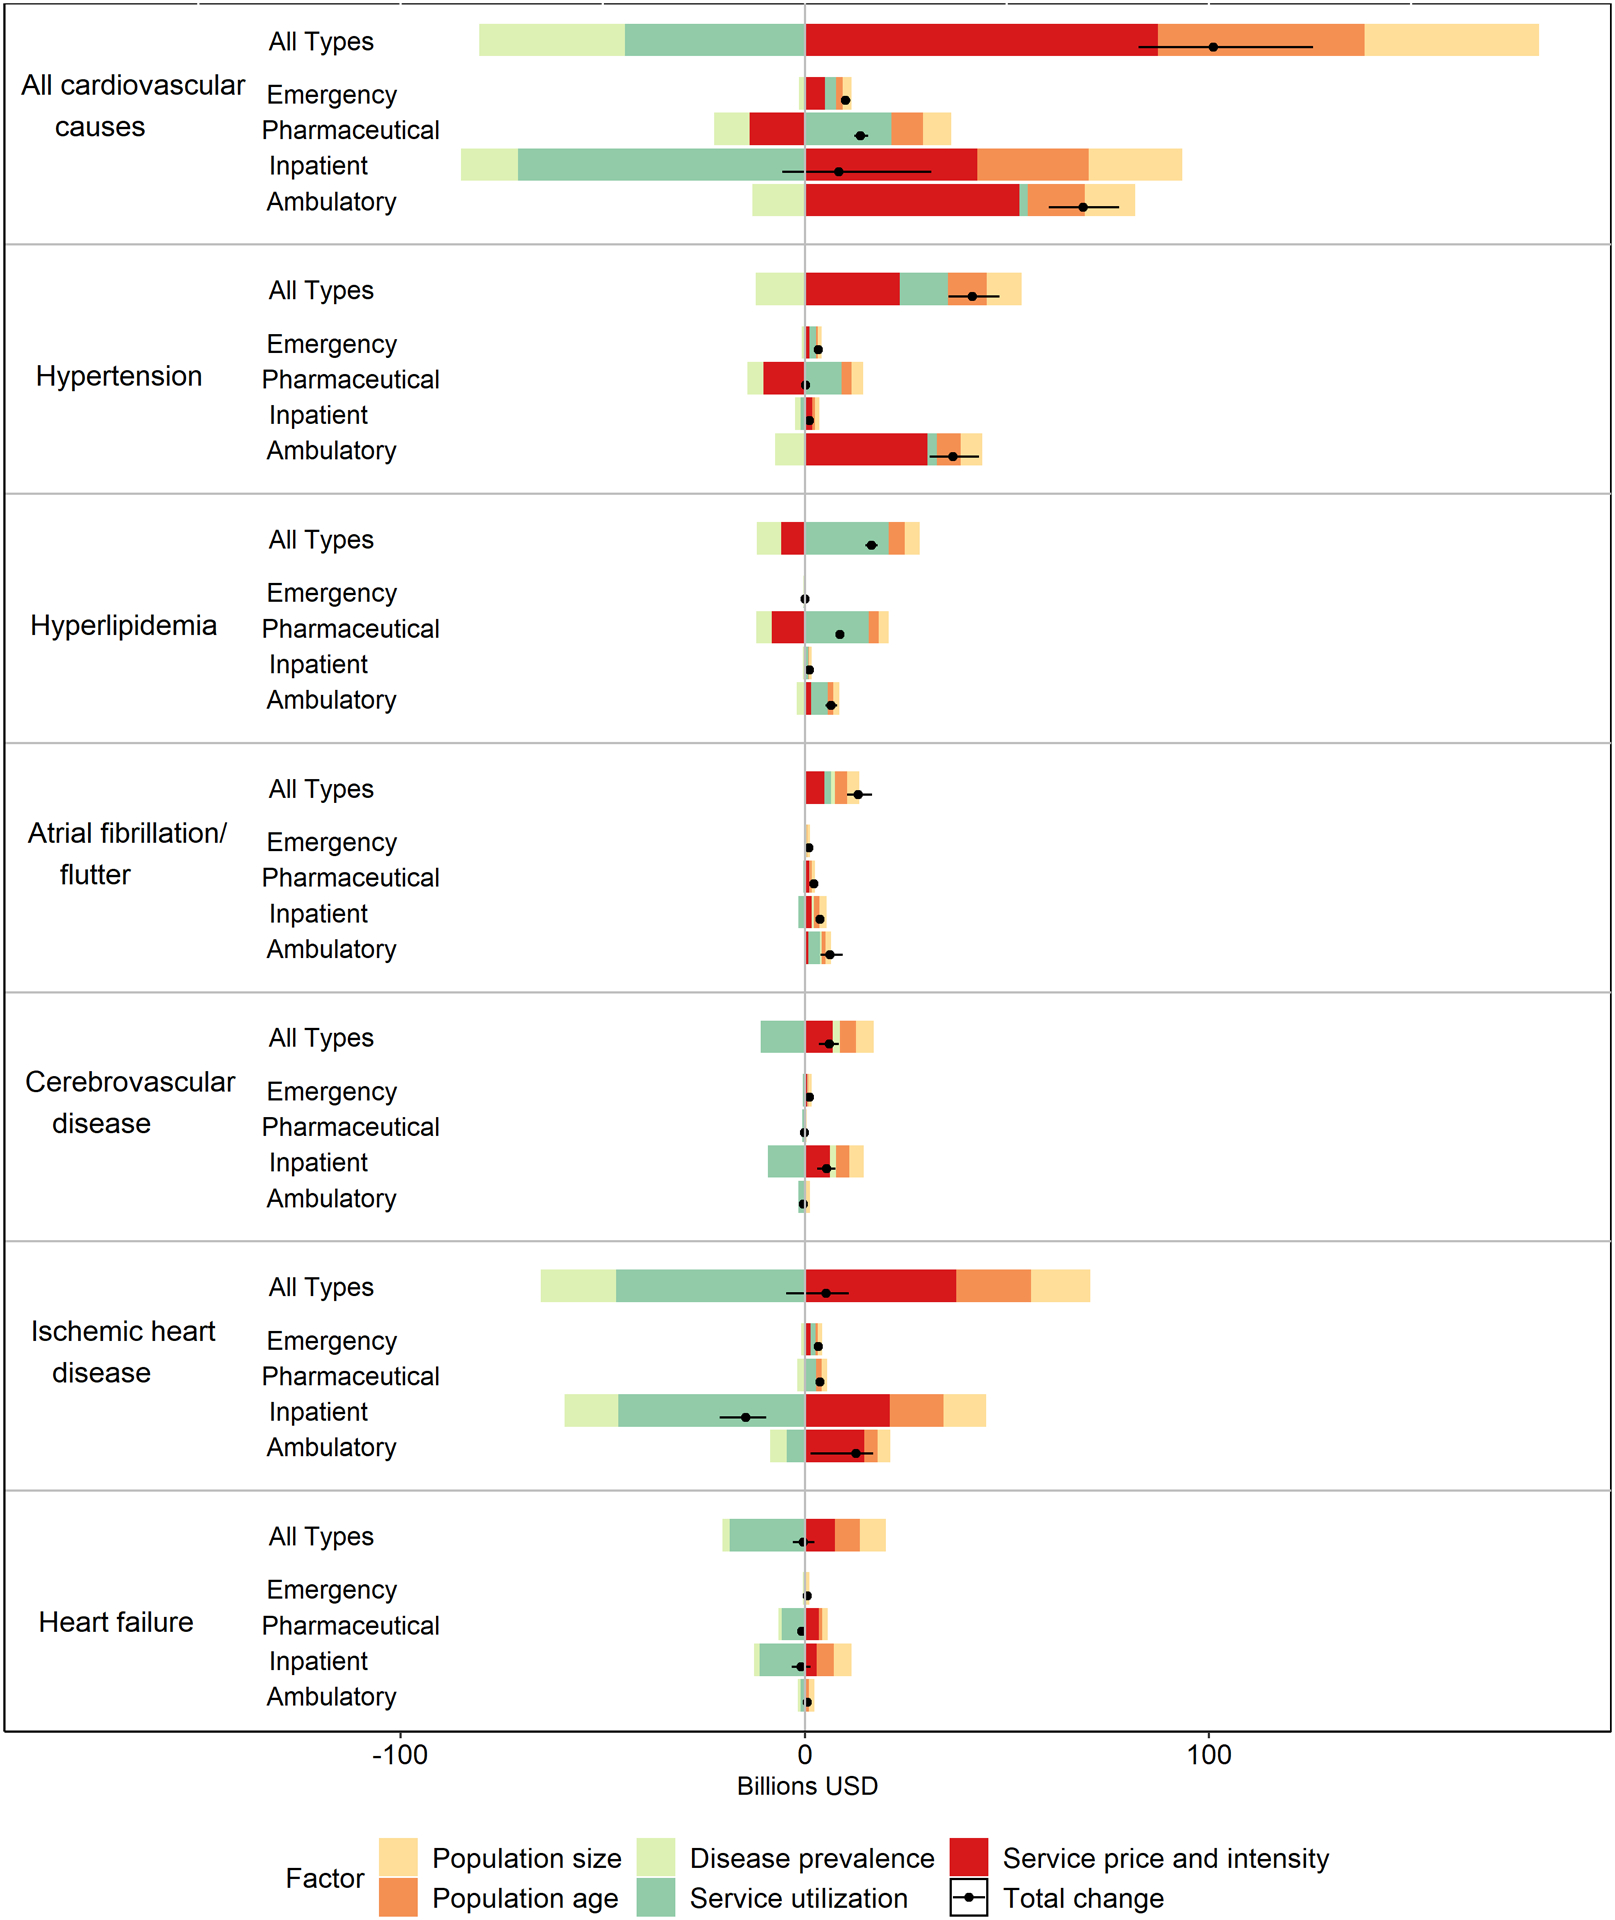
Methods: We extracted information on adult cardiovascular spending from the Institute for Health Metrics and Evaluation's disease expenditure project, which combines data on insurance claims, emergency department and ambulatory care visits, inpatient and nursing care facility stays, and drug prescriptions to estimate >85% of all US health care spending. Cardiovascular spending (2016 US dollars) was stratified by age, sex, type of care, payer, and cardiovascular cause. Time trend and decomposition analyses quantified contributions of epidemiology, service price and intensity (spending per unit of utilization, eg, spending per inpatient bed-day), and population growth and aging to the increase in cardiovascular spending from 1996 to 2016.

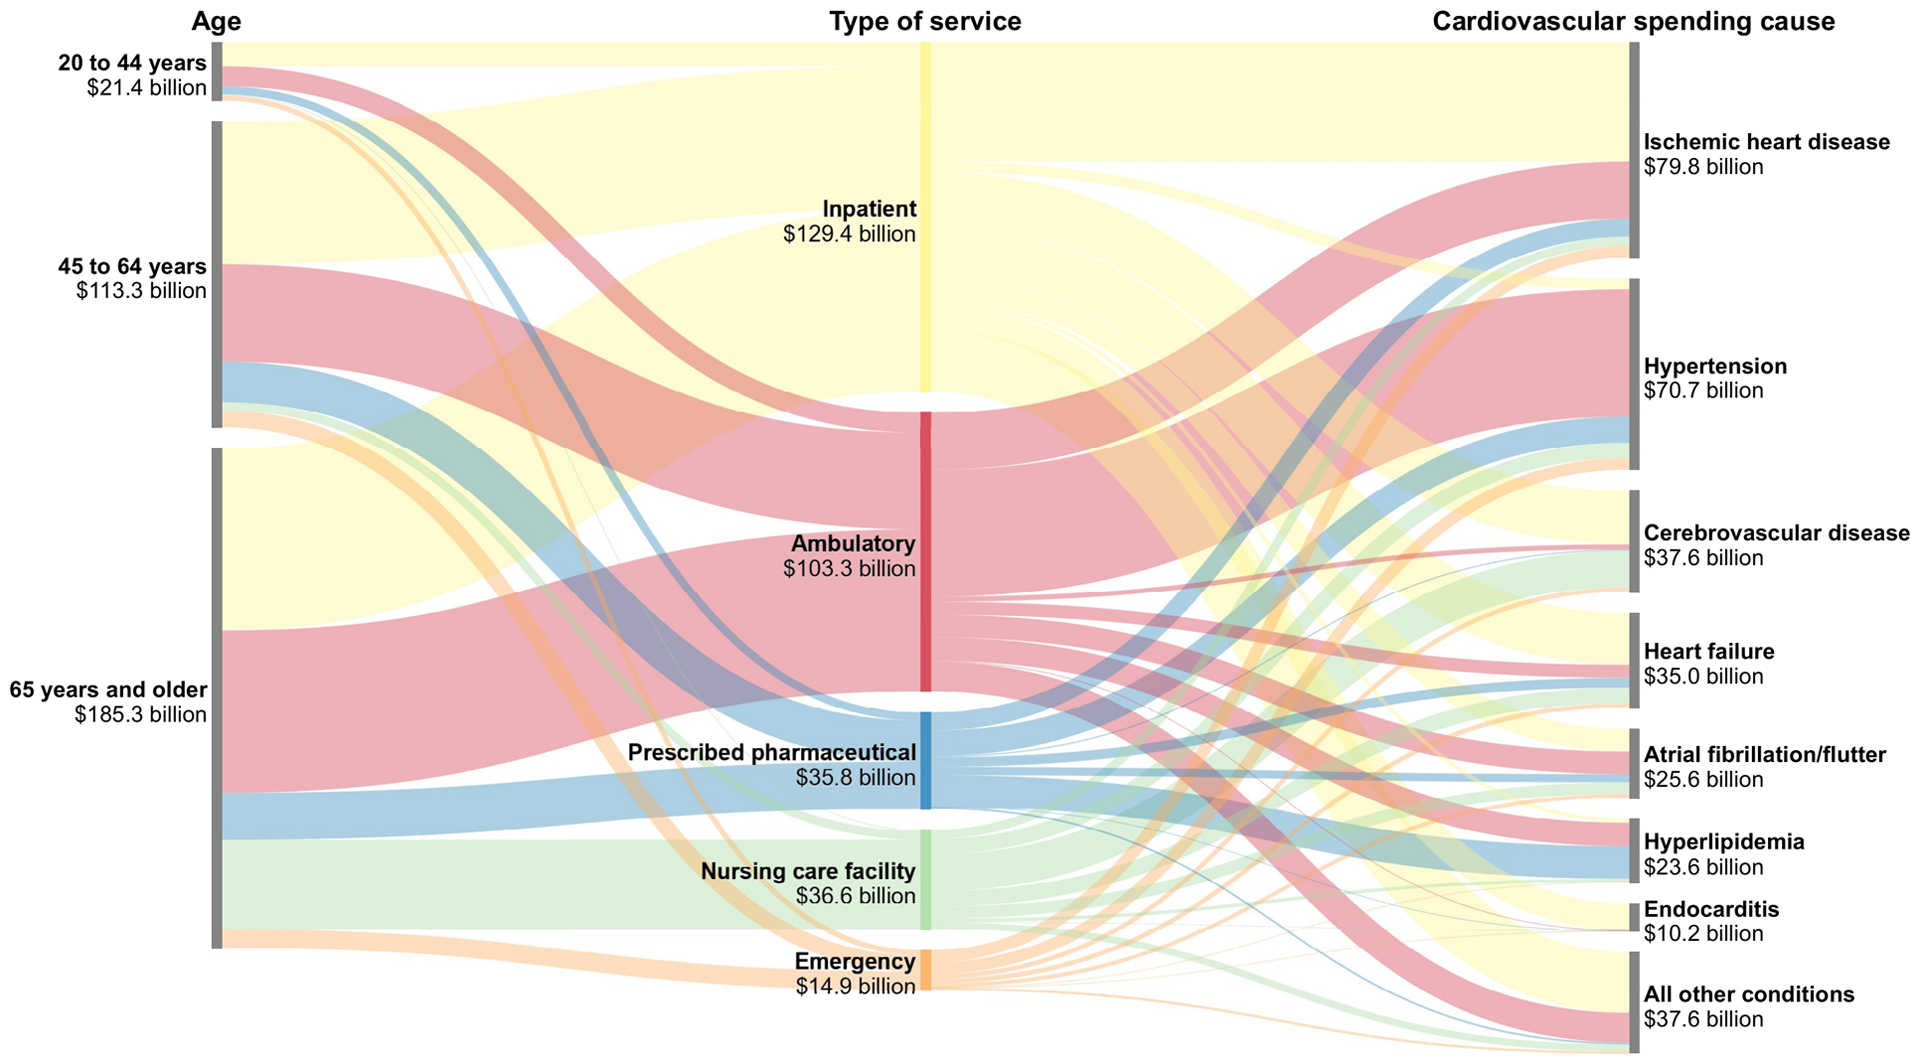
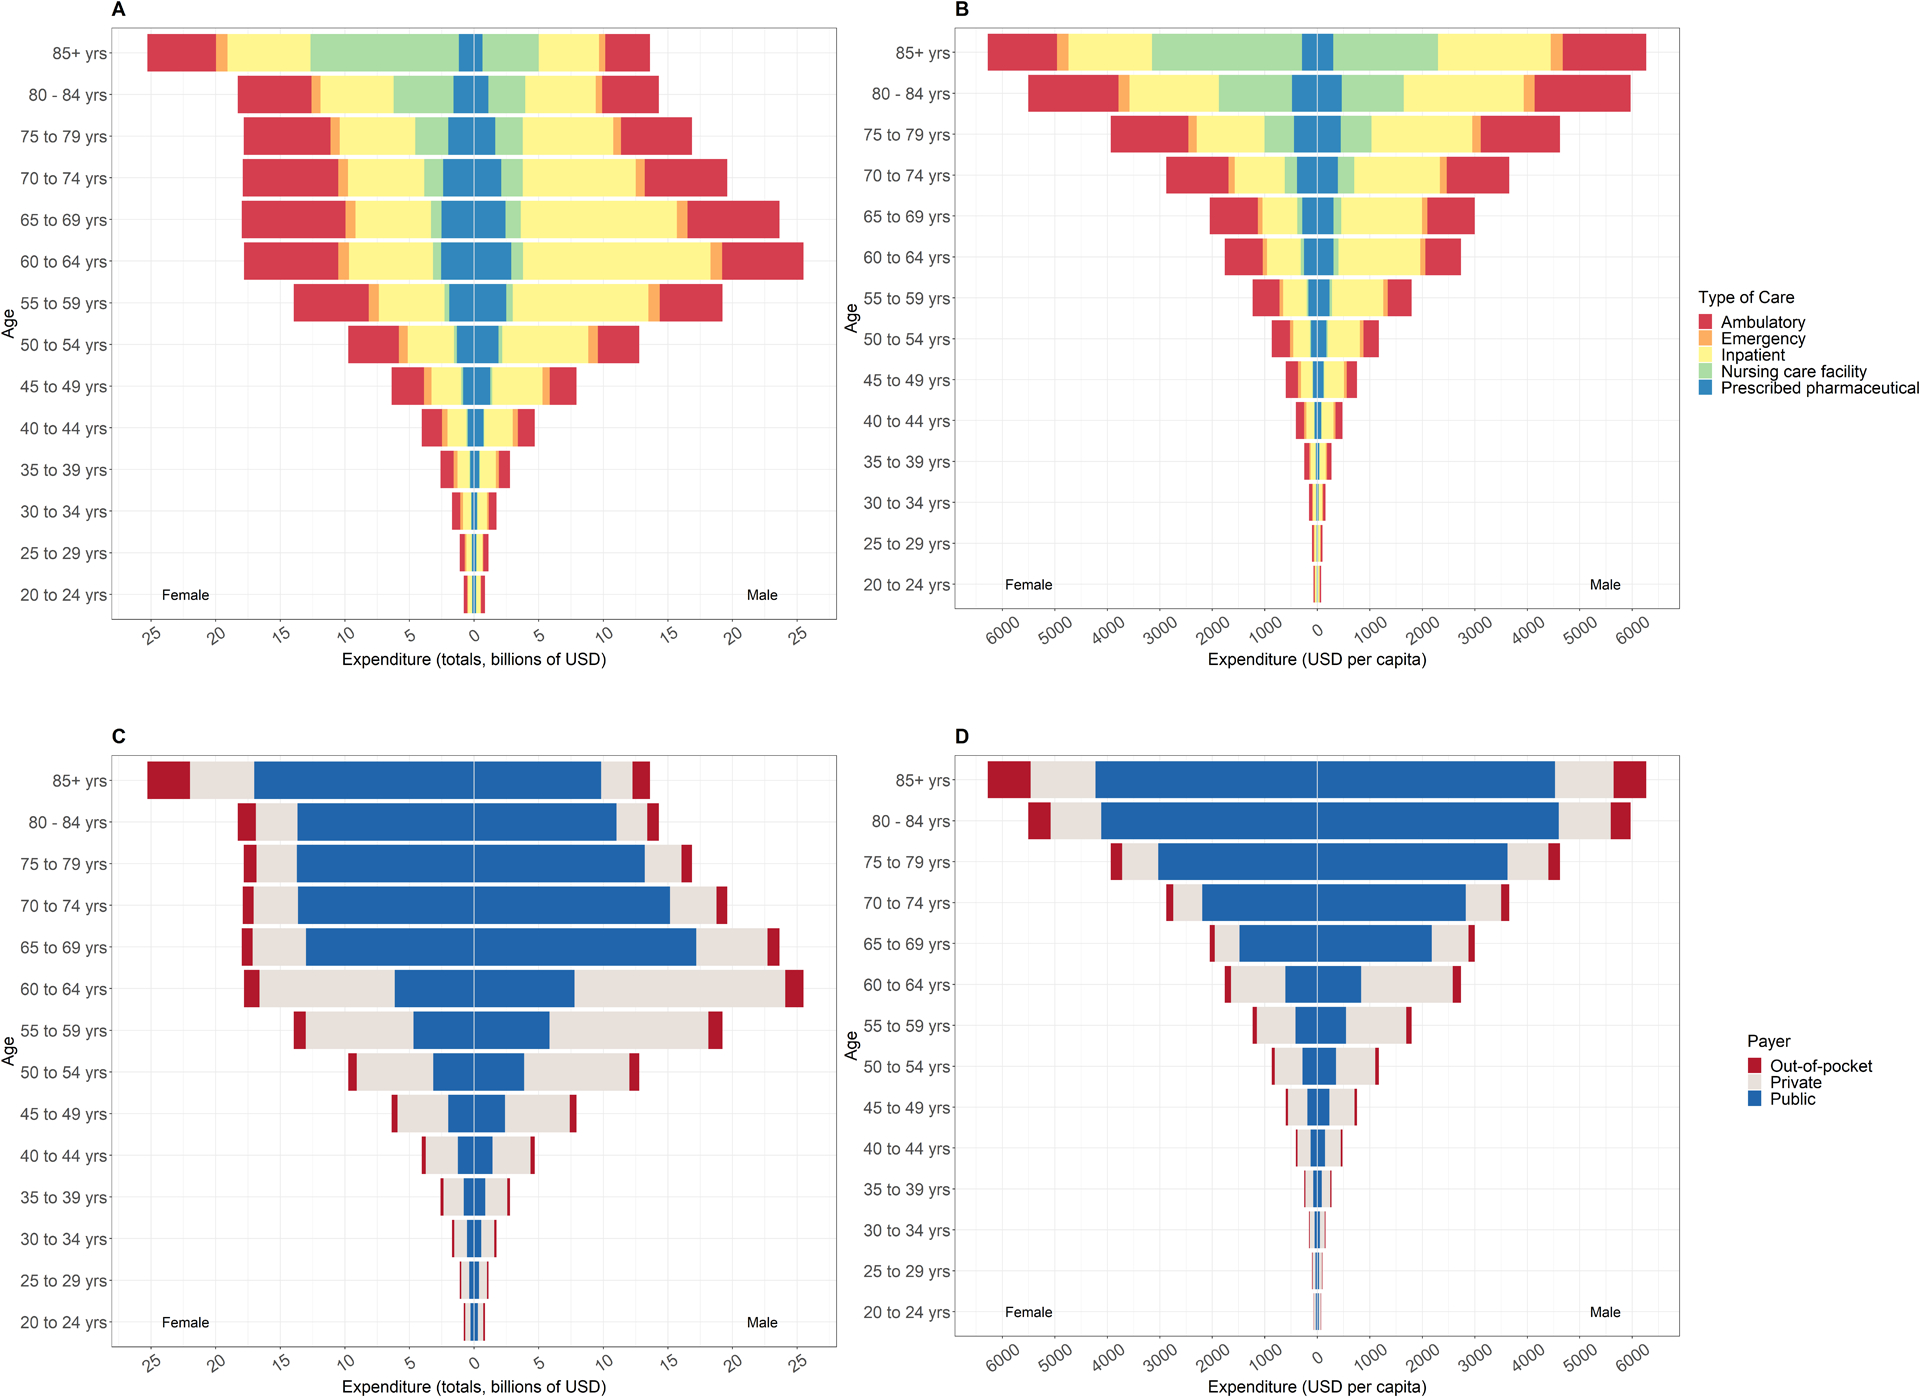
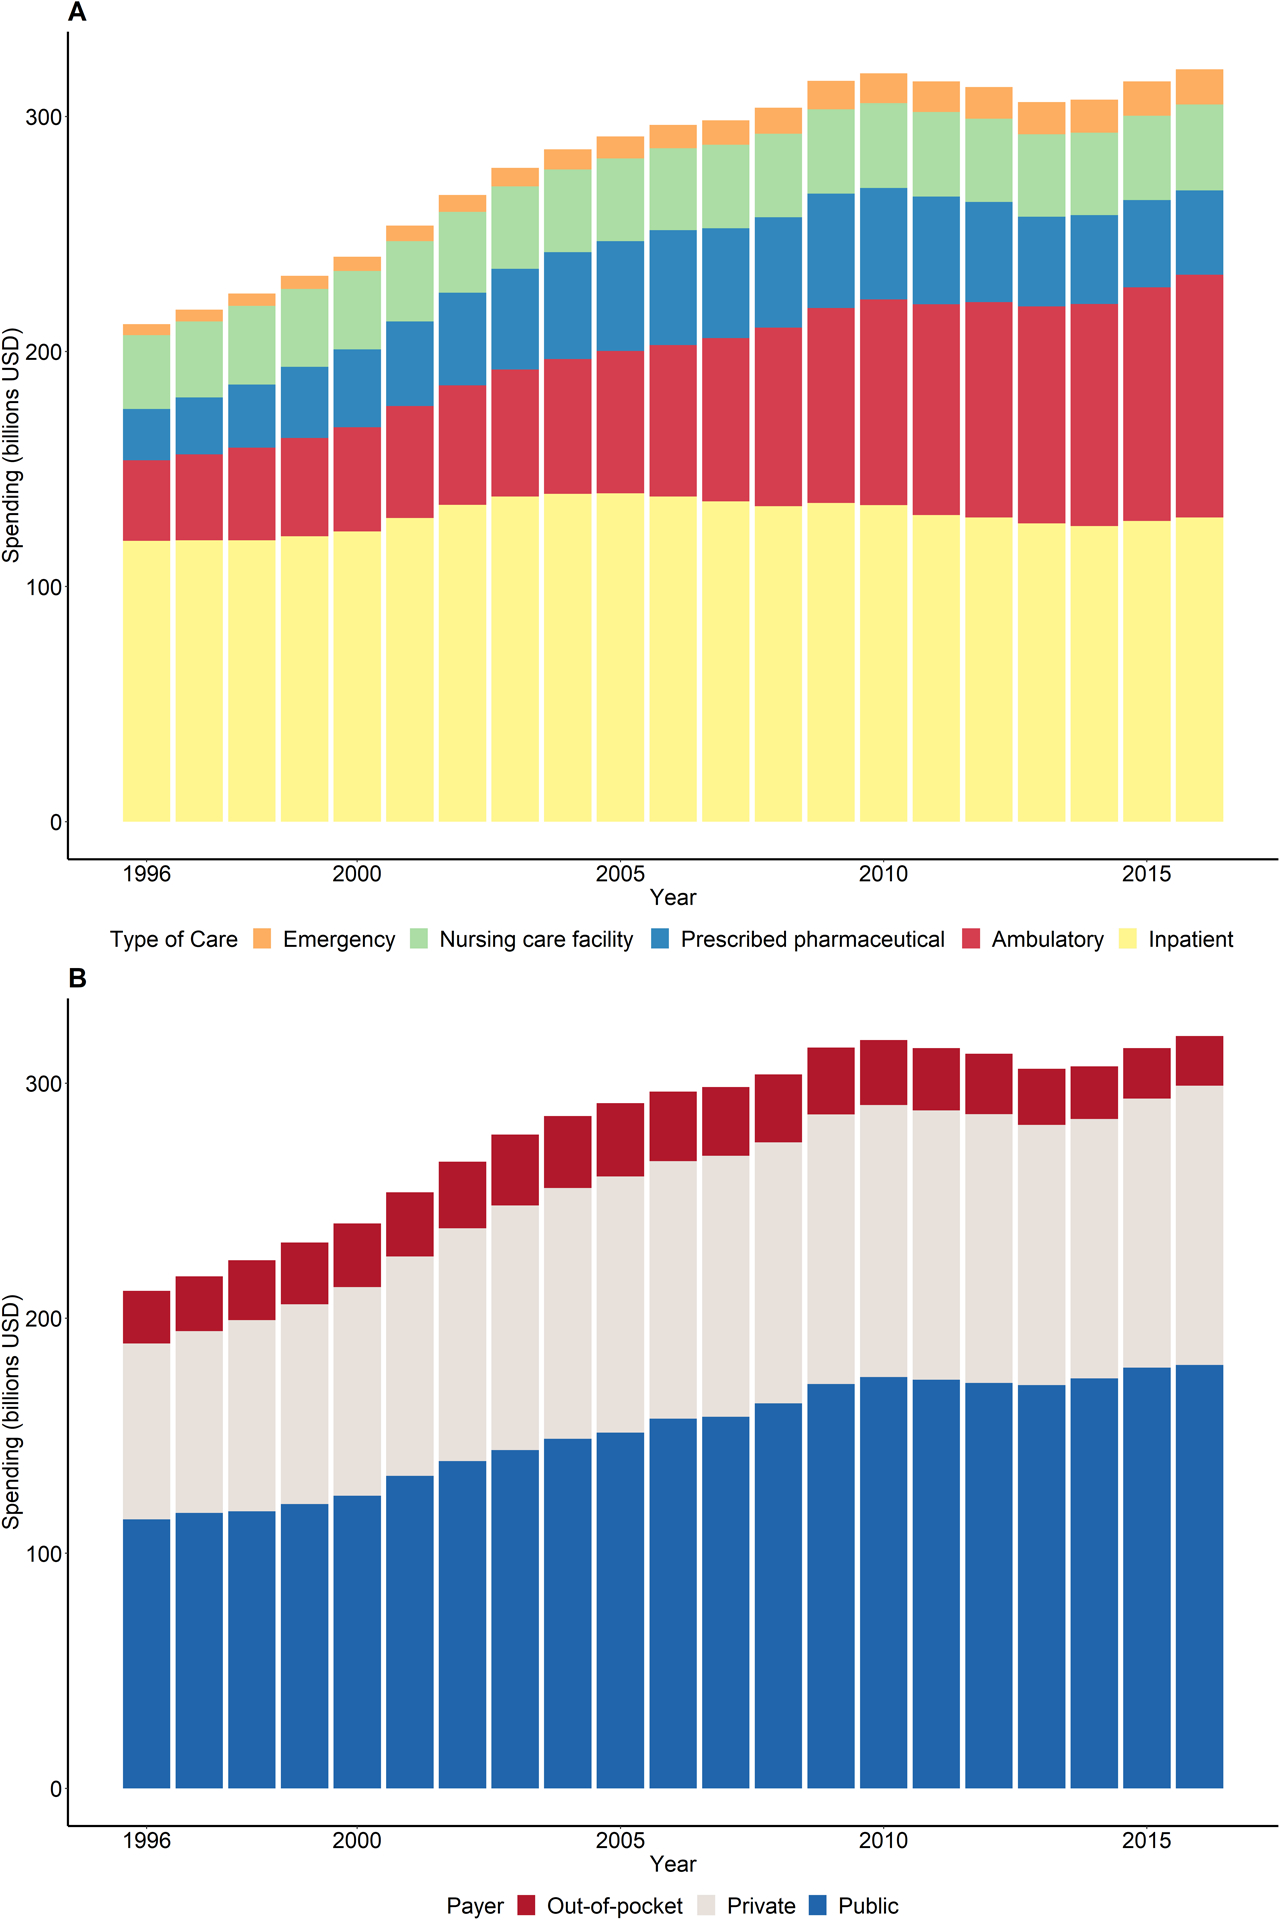
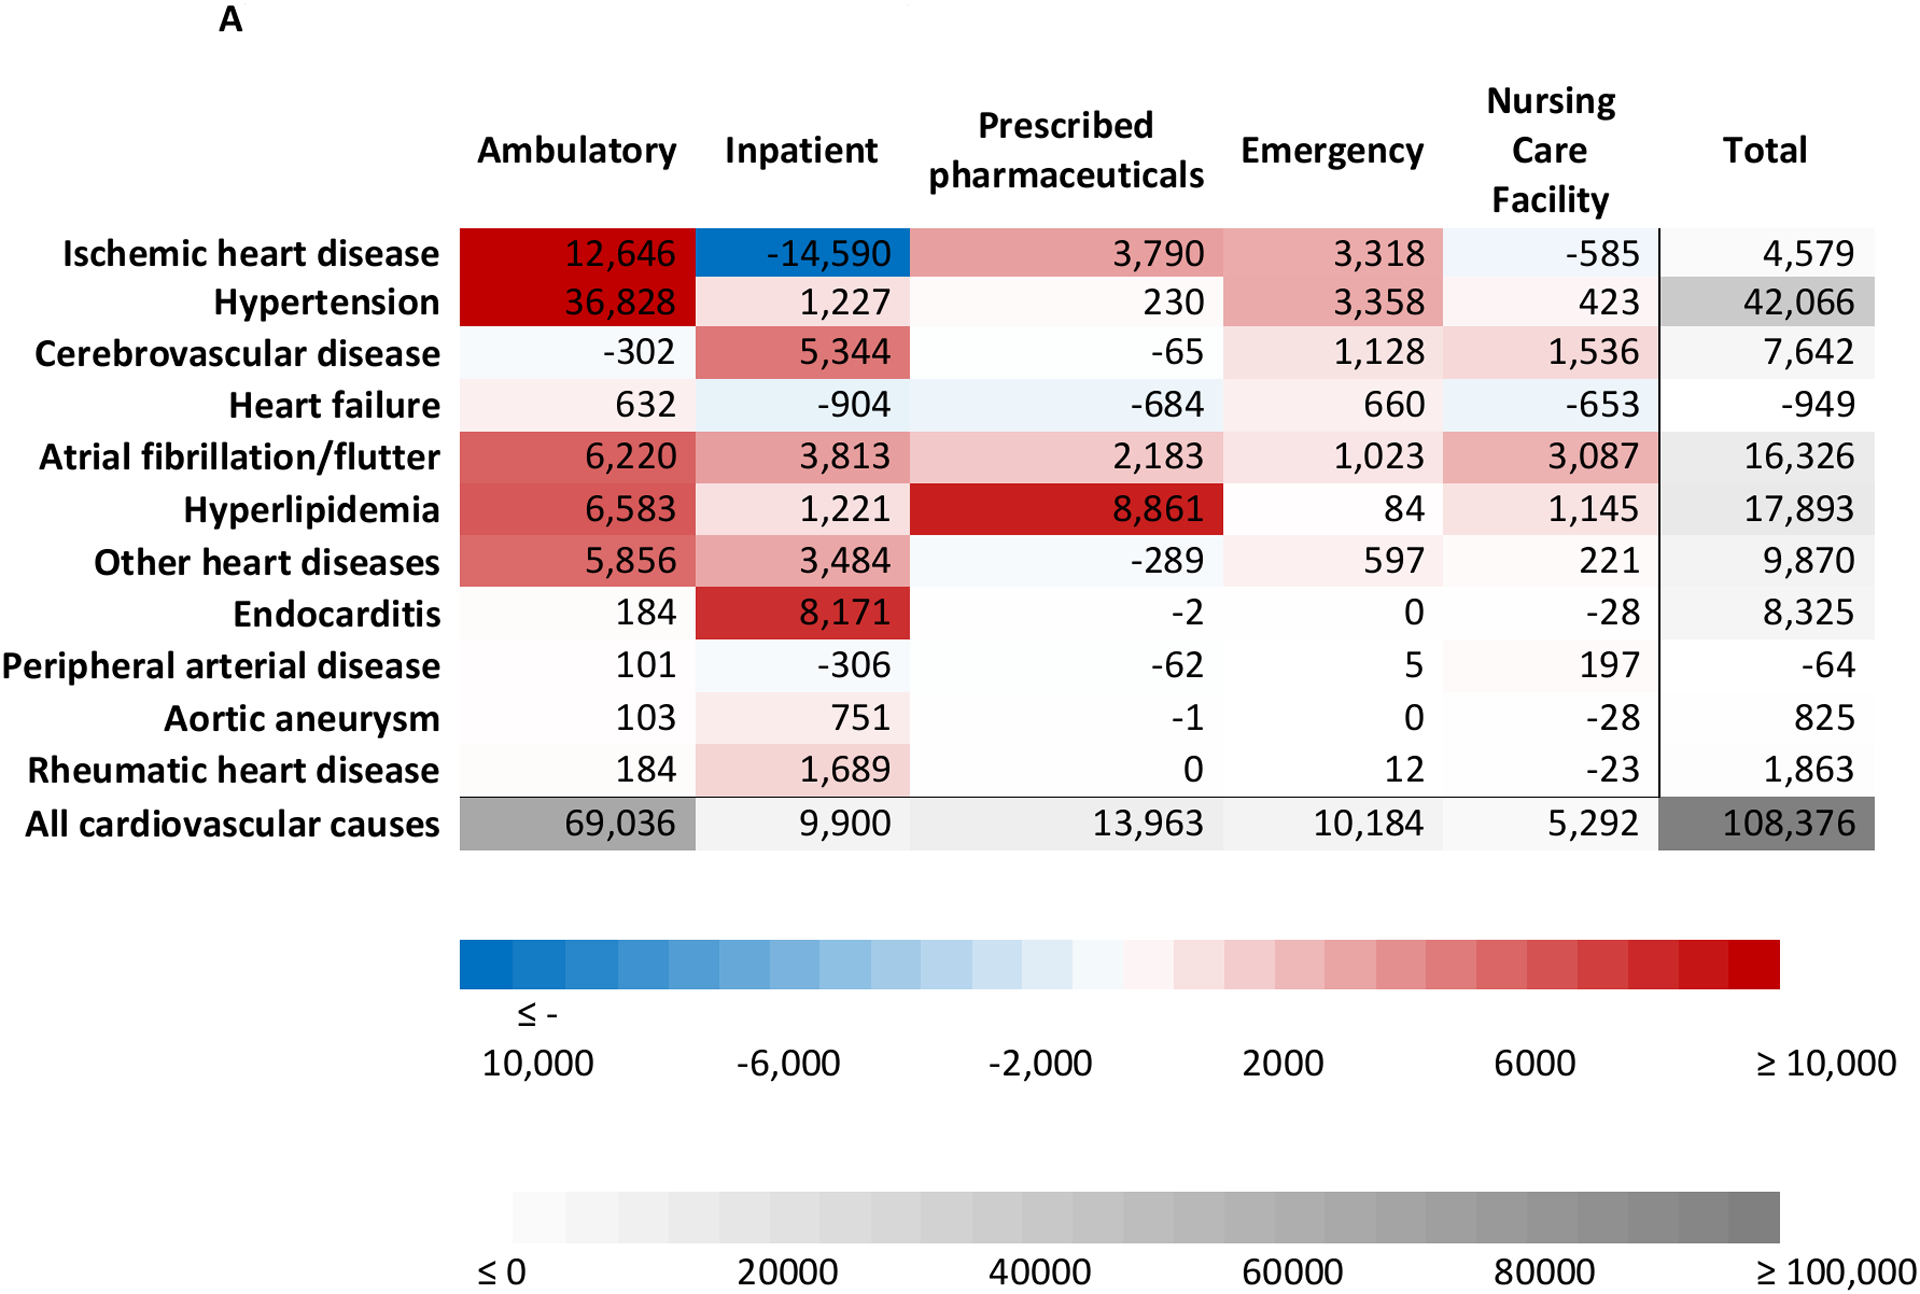
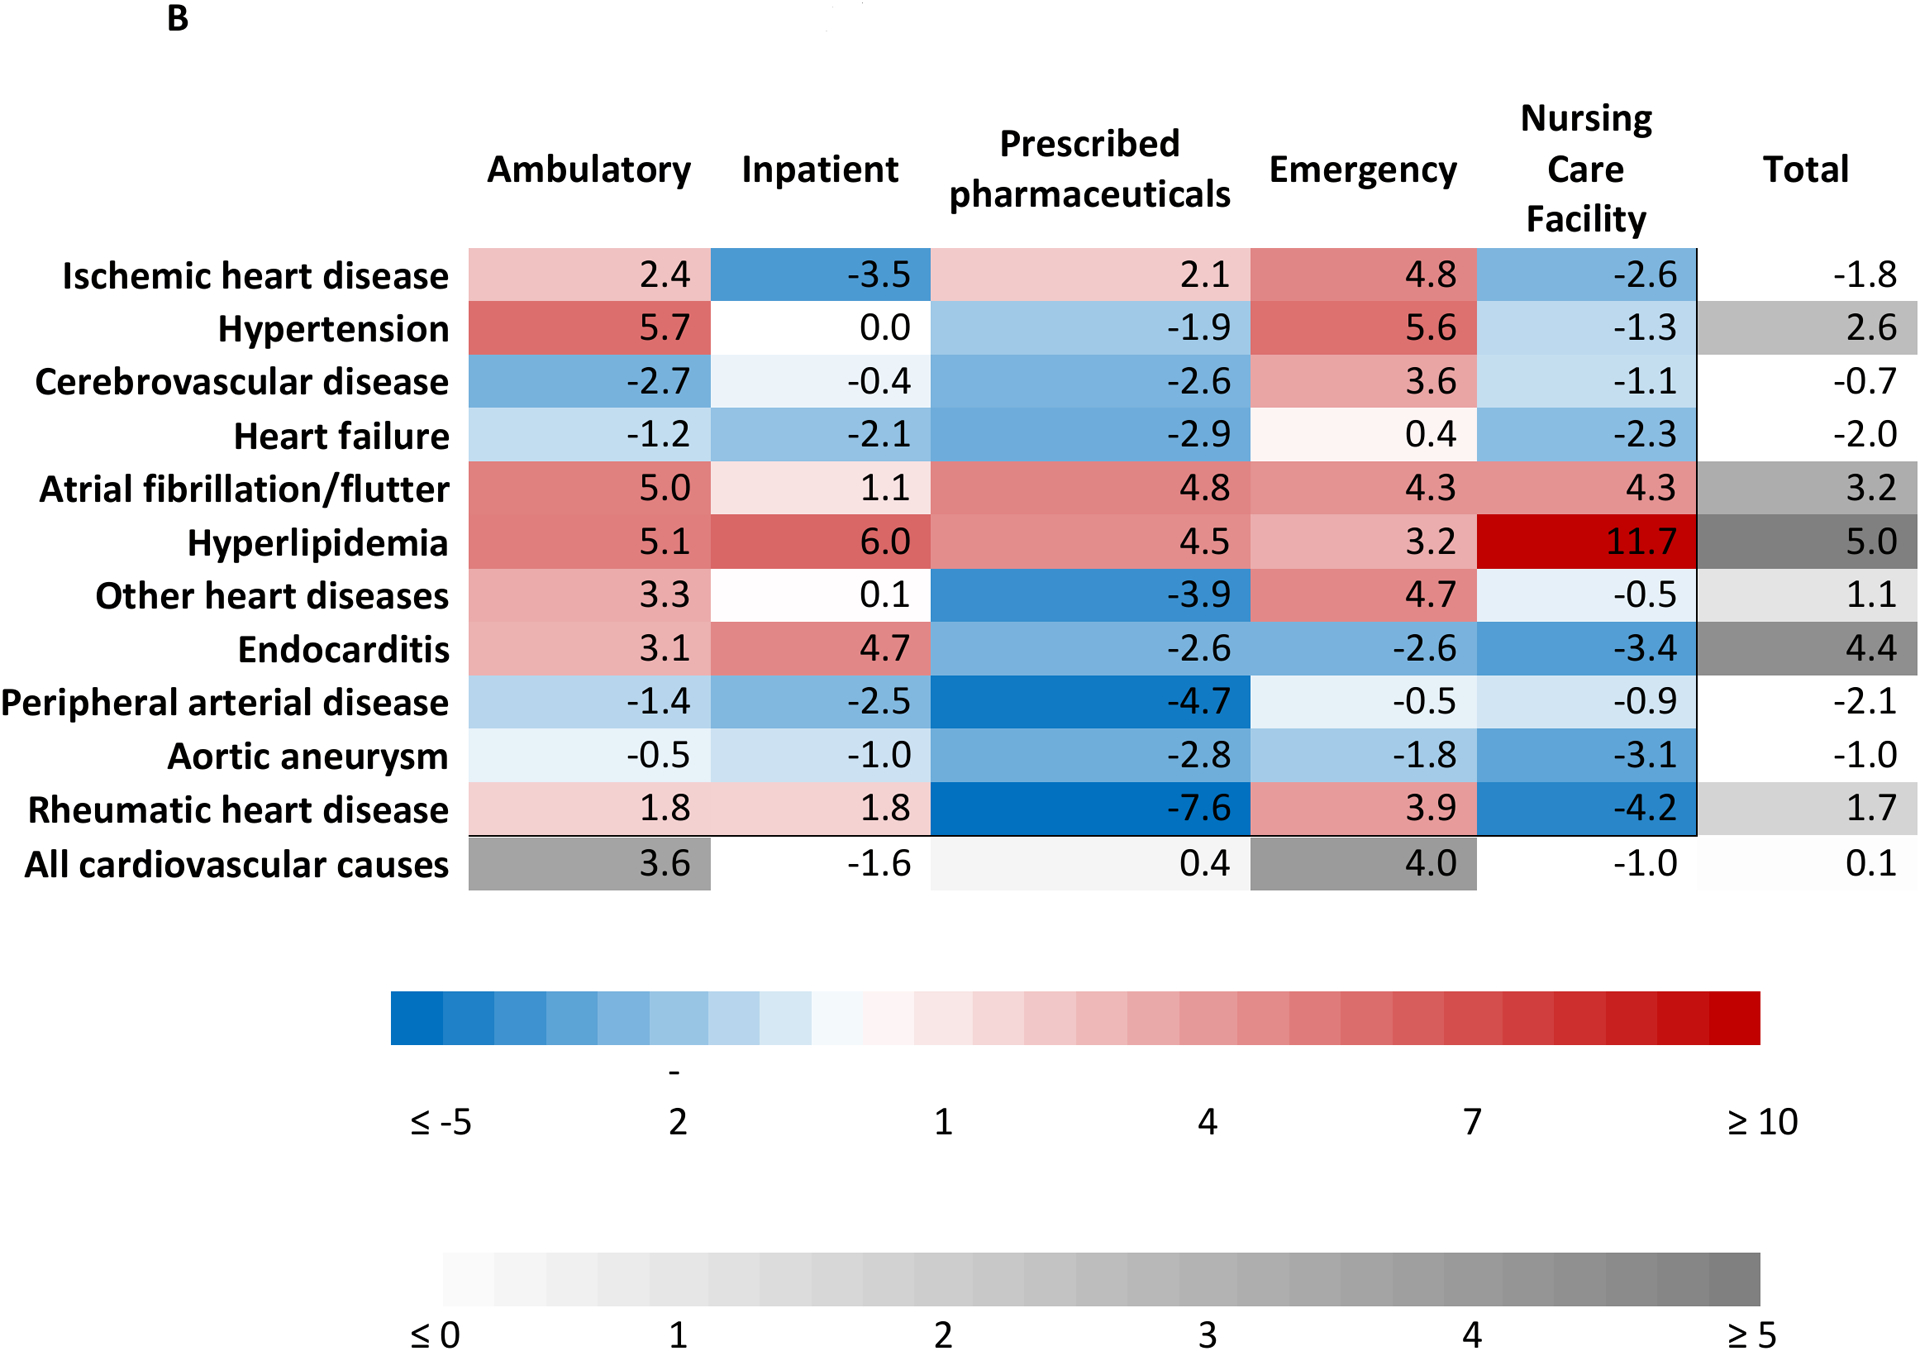
Results: Adult cardiovascular spending increased from $212 billion in 1996 to $320 billion in 2016, a period when the US population increased by >52 million people, and median age increased from 33.2 to 36.9 years. Over this period, public insurance was responsible for the majority of cardiovascular spending (54%), followed by private insurance (37%) and out-of-pocket spending (9%). Health services for ischemic heart disease ($80 billion) and hypertension ($71 billion) led to the most spending in 2016. Increased spending between 1996 and 2016 was primarily driven by treatment of hypertension, hyperlipidemia, and atrial fibrillation/flutter, for which spending rose by $42 billion, $18 billion, and $16 billion, respectively. Increasing service price and intensity alone were associated with a 51%, or $88 billion, cardiovascular spending increase from 1996 to 2016, whereas changes in disease prevalence were associated with a 37%, or $36 billion, spending reduction over the same period, after taking into account population growth and population aging.

Conclusions: US adult cardiovascular spending increased by >$100 billion from 1996 to 2016. Policies tailored to control service price and intensity and preferentially reimburse higher quality care could help counteract future spending increases caused by population aging and growth.

Keywords: cardiovascular; disease; health economics; health expenditures.


Conflict of interest statement

DISCLOSURES

All authors declare no relevant conflicts of interest to disclose.

Figures

Figure 1.
Figure 1.. Total cardiovascular spending in 2016 by payer, age, type of service, and cardiovascular cause.
Notes: The figure shows the distribution of cardiovascular spending in 2016 by age, type of service, and cardiovascular spending cause (i.e., each column sums to the total cardiovascular spending in 2016). The first column shows the distribution of cardiovascular spending across age groups, and the pathways connecting the first and second columns indicate the cardiovascular spending by type of service within each age group. Similarly, the second column shows the distribution of cardiovascular spending across type of service, and the pathways connecting to the third column indicate the cardiovascular spending causes by type of service. The third column shows the distribution of cardiovascular spending by cardiovascular spending cause. “All other conditions” indicates all causes for which less than $10 billion was spent individually. All estimates are in 2016 USD.
Figure 2.
Figure 2.. Total and per capita cardiovascular spending in 2016 by type of care and payer type.
Notes: This figures shows 2016 cardiovascular spending. Panel A shows billions of USD by sex and type of care. Panel B shows USD per capita by sex and type of care. Panel C shows billions of USD by sex and payer. Panel D shows USD per capita by sex and payer. The figure shows 2016 absolute and per capita spending for each age and sex group, disaggregated by type of care and payer.
Figure 3.
Figure 3.. Total US cardiovascular spending from 1996 to 2016 by type of care and payer type.
Notes: The figure shows cardiovascular spending over time, disaggregated by type of care (Panel A) and payer (Panel B). All estimates in 2016 USD.
Figure 4.
Figure 4.. Absolute change and age-standardized annualized rate of change for total cardiovascular spending from 1996 to 2016.
Notes: The figure shows the absolute change in spending (Panel A) and age-standardized annualized rate of change (Panel B) from 1996 through 2016. Cardiovascular causes are ranked by absolute spending in 2016. Absolute change is millions of 2016 USD.
Figure 5.
Figure 5.. Decomposition of changes in cardiovascular spending from 1996 to 2016.
Notes: Figure shows the results of the decomposition analysis for the six largest causes of cardiovascular spending in 2016 as well as all cardiovascular causes cumulatively. The change associated with each factor is independent of the change associated with all other factors. All estimates are in 2016 USD.

Comment in

References

    1. GBD Causes of Death Collaborators. Global, regional, and national age-sex specific mortality for 264 causes of death, 1980–2016: a systematic analysis for the Global Burden of Disease Study 2016. Lancet. 2017;390:1151–1210. DOI: 10.1016/S0140-6736(17)32152-9. - DOI - PMC - PubMed
    1. Mensah GA, Wei GS, Sorlie PD, Fine LJ, Rosenberg Y, Kaufmann PG, Mussolino ME, Hsu LL, Addou E, Engelgau MM, et al. Decline in Cardiovascular Mortality: Possible Causes and Implications. Circ Res. 2017;120:366–380. DOI: 10.1161/CIRCRESAHA.116.309115. - DOI - PMC - PubMed
    1. Shah NS, Molsberry R, Rana JS, Sidney S, Capewell S, O’Flaherty M, Carnethon M, Lloyd-Jones DM, Khan SS. Heterogeneous trends in burden of heart disease mortality by subtypes in the United States, 1999–2018: observational analysis of vital statistics. BMJ. 2020;370:m2688. DOI: 10.1136/bmj.m2688. - DOI - PMC - PubMed
    1. Mensah GA, Brown DW. An overview of cardiovascular disease burden in the United States. Health Aff (Millwood). 2007;26:38–48. DOI: 10.1377/hlthaff.26.1.38. - DOI - PubMed
    1. Sidney S, Quesenberry CP Jr., Jaffe MG, Sorel M, Nguyen-Huynh MN, LH Kushi, Go AS, Rana JS. Recent Trends in Cardiovascular Mortality in the United States and Public Health Goals. JAMA Cardiol. 2016;1:594–599. DOI: 10.1001/jamacardio.2016.1326. - DOI - PubMed

Publication types

MeSH terms