. 2021 Jun;28(6):587-600.
doi: 10.1089/cmb.2020.0375. Epub 2021 Apr 29.

Estimating Genetic Similarity Matrices Using Phylogenies

Affiliations

Estimating Genetic Similarity Matrices Using Phylogenies

Shijia Wang et al. J Comput Biol. 2021 Jun.

Abstract

Genetic similarity is a measure of the genetic relatedness among individuals. The standard method for computing these matrices involves the inner product of observed genetic variants. Such an approach is inaccurate or impossible if genotypes are not available, or not densely sampled, or of poor quality (e.g., genetic analysis of extinct species). We provide a new method for computing genetic similarities among individuals using phylogenetic trees. Our method can supplement (or stand in for) computations based on genotypes. We provide simulations suggesting that the genetic similarity matrices computed from trees are consistent with those computed from genotypes. With our methods, quantitative analysis on genetic traits and analysis of heritability and coheritability can be conducted directly using genetic similarity matrices and so in the absence of genotype data, or under uncertainty in the phylogenetic tree. We use simulation studies to demonstrate the advantages of our method, and we provide applications to data.

Keywords: genetic similarity; infinite sites model; phylogenetic tree.


Conflict of interest statement

No competing financial interests exist.

Figures

FIG. 1.
FIG. 1.
Bipartition of taxa induced by an unobserved genetic variant on edge ed. Only the membership of each taxon in the bipartitioned set is needed in the computation of the expected mean μed, and variance σed2.
FIG. 2.
FIG. 2.
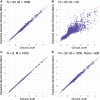
Comparison of simulated genetic similarity matrices from trees and genotypes. Scatter plots are provided for entrywise differences between the genetic similarity matrices produced by our method and the ground truth [from Equation (1), applied to the simulated genotypes]. The top left and top right panels show the entrywise differences for the two conditions for scenario (A), and the bottom left and bottom right panels show the entrywise differences for scenarios (B, C), (respectively).
FIG. 3.
FIG. 3.
Comparison of simulated genetic similarity matrices from trees and genotypes. The violins are provided for entrywise differences between the genetic similarity matrices produced by our method and the ground truth.
FIG. 4.
FIG. 4.
Comparison of expected genetic similarity matrix approaches: KijGKijT (our method, bottom), KijGKijS (middle), and KijGKijMDS (top). The entries of the expected genetic similarity matrices (the red violin, thin) are close to the empirical genetic similarity matrix. They are closer to the empirical genetic similarity matrix than are the entries of the Gaussian distance similarity matrices (the green violin), or the multidimensional scaling similarity matrices (the blue violin).
FIG. 5.
FIG. 5.
Genetic similarity matrix for eight hominin species as a heat map, computed using geological dates and Algorithm 1.
FIG. 6.
FIG. 6.
MCMC trace plots of σg2 and σe2. The red dashed lines indicate posterior means for σg2 and σe2 with initial 5000 iterations as burn-in. MCMC, Markov chain Monte Carlo.
FIG. 7.
FIG. 7.
Histograms for posterior samples of σg2, σe2, and h2. The red lines indicate posterior means for σg2, σe2, and h2, and the blue dash lines indicate the 95% credible intervals.
FIG. 8.
FIG. 8.
Uncertainty of genetic similarities between Ardipithecus ramidus and Australopithecus anamensis, Gorilla gorilla and Pan troglodytes, Parantropus robustus and Homo naledi, and P. troglodytes and Australopithecus afarensis.

References

    1. Abney, M. 2009. A graphical algorithm for fast computation of identity coefficients and generalized kinship coefficients. Bioinformatics 25, 1561–1563 - PMC - PubMed
    1. Atkinson, Q.D., and Gray, R.D.. 2005. Curious parallels and curious connections—phylogenetic thinking in biology and historical linguistics. Syst. Biol. 54, 513–526 - PubMed
    1. Berger, L.R., Hawks, J., de Ruiter, D.J., et al. . 2015. Homo naledi, a new species of the genus Homo from the Dinaledi Chamber, South Africa. eLife 4, e09560 - PMC - PubMed
    1. Berger, L.R., Hawks, J., Dirks, P.H., et al. . 2017. Homo naledi and Pleistocene hominin evolution in subequatorial Africa. eLife 6, e24234. - PMC - PubMed
    1. Bouckaert, R., Heled, J., Kühnert, D., et al. . 2014. BEAST 2: A Software Platform for Bayesian evolutionary analysis. PLoS Comput. Biol. 10, e1003537 - PMC - PubMed

Publication types

LinkOut - more resources