. 2021 Oct;11(8):613-623.
doi: 10.1089/brain.2020.0975. Epub 2021 Jun 17.

Probabilistic Atlas of the Mesencephalic Reticular Formation, Isthmic Reticular Formation, Microcellular Tegmental Nucleus, Ventral Tegmental Area Nucleus Complex, and Caudal-Rostral Linear Raphe Nucleus Complex in Living Humans from 7 Tesla Magnetic Resonance Imaging

Affiliations

Probabilistic Atlas of the Mesencephalic Reticular Formation, Isthmic Reticular Formation, Microcellular Tegmental Nucleus, Ventral Tegmental Area Nucleus Complex, and Caudal-Rostral Linear Raphe Nucleus Complex in Living Humans from 7 Tesla Magnetic Resonance Imaging

Kavita Singh et al. Brain Connect. 2021 Oct.

Abstract

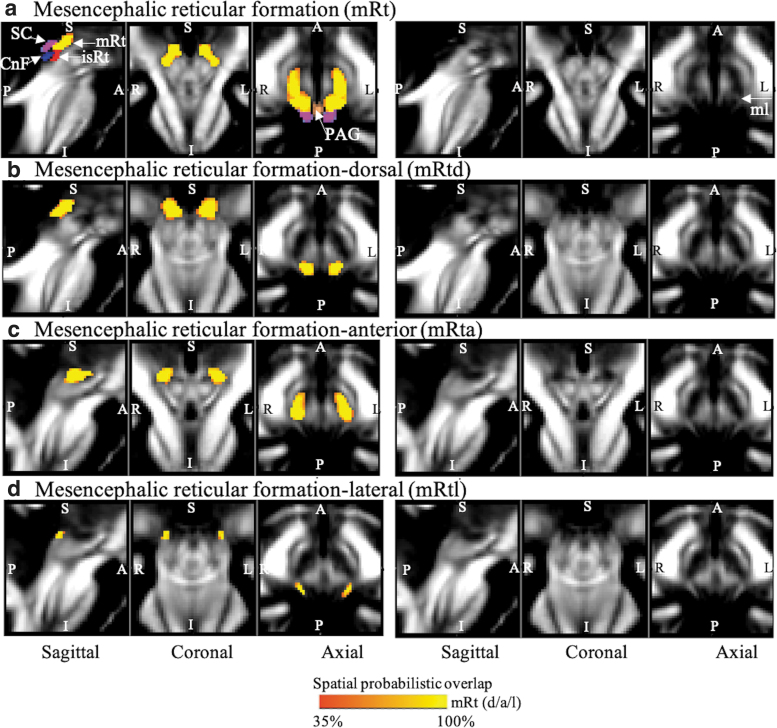
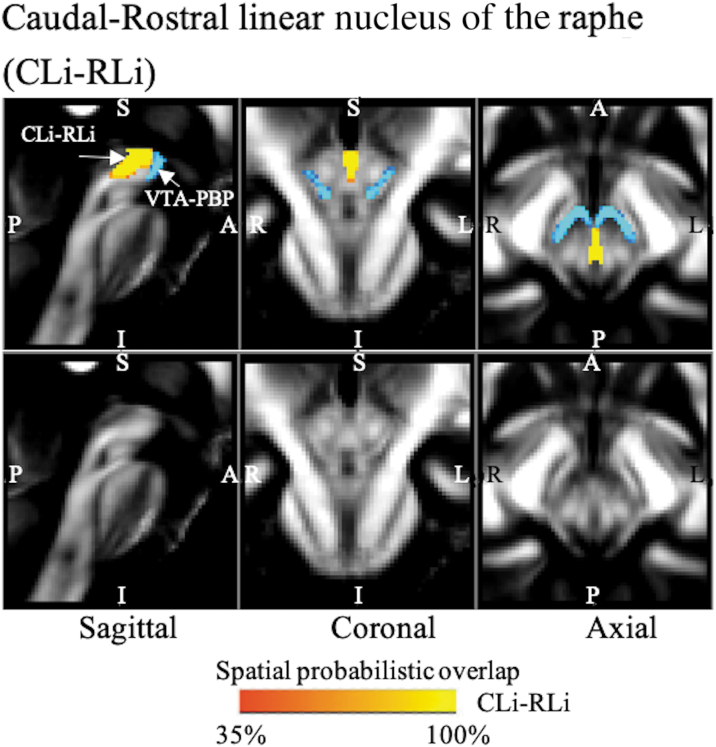
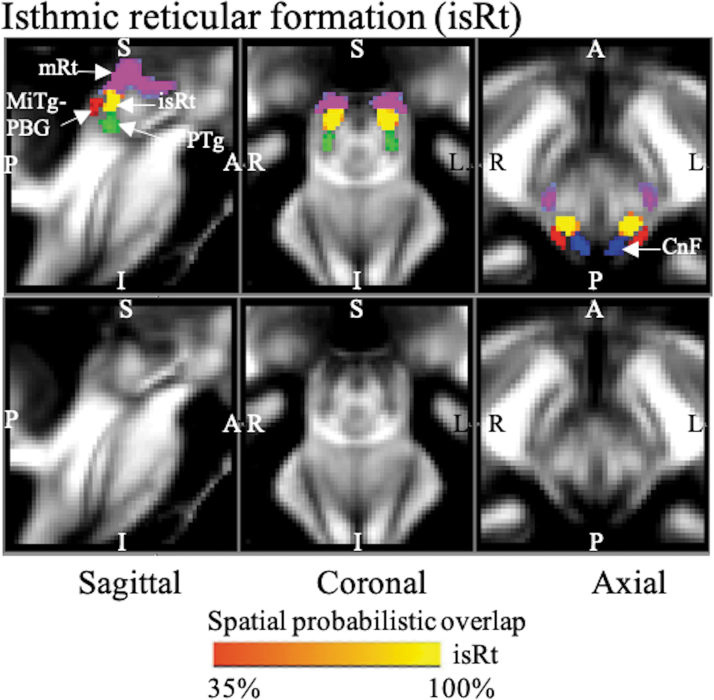
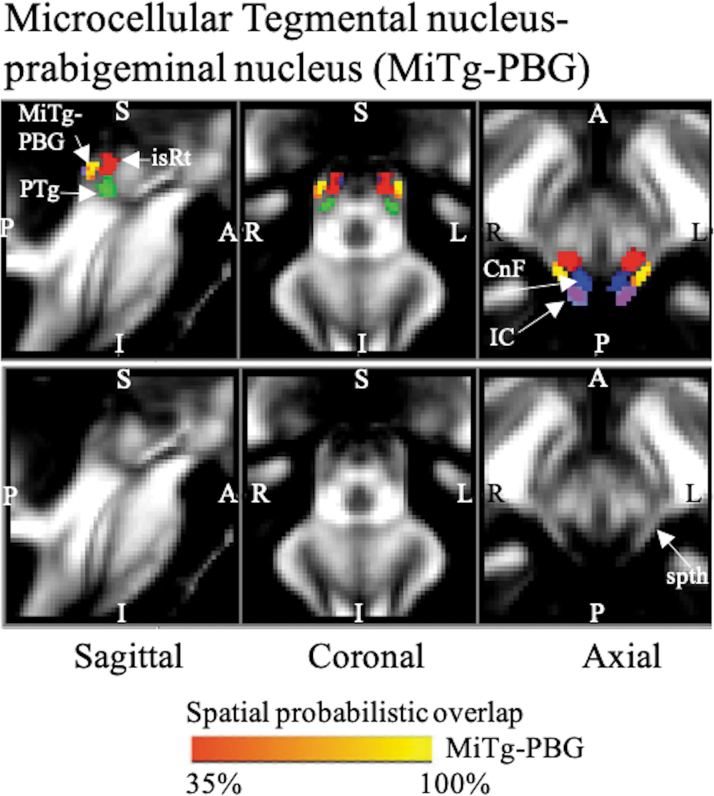
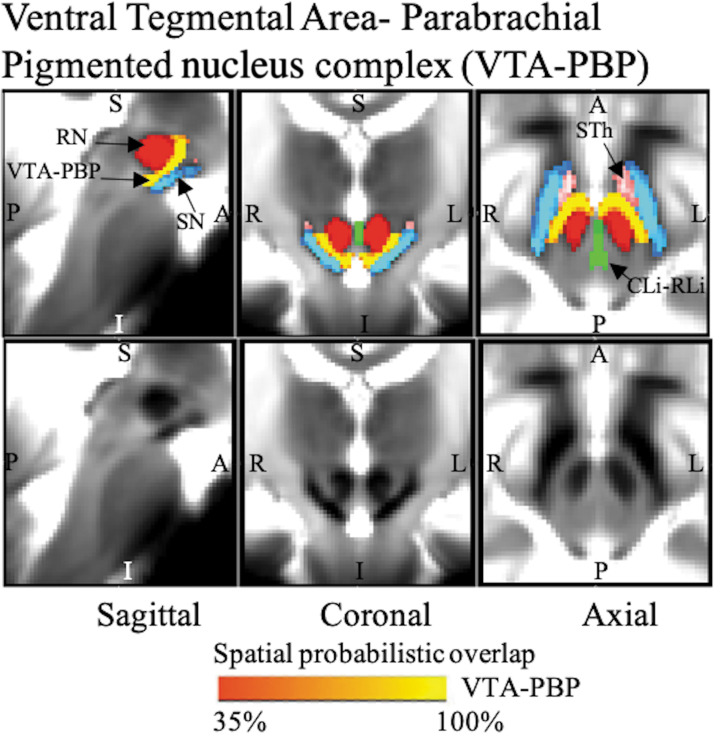
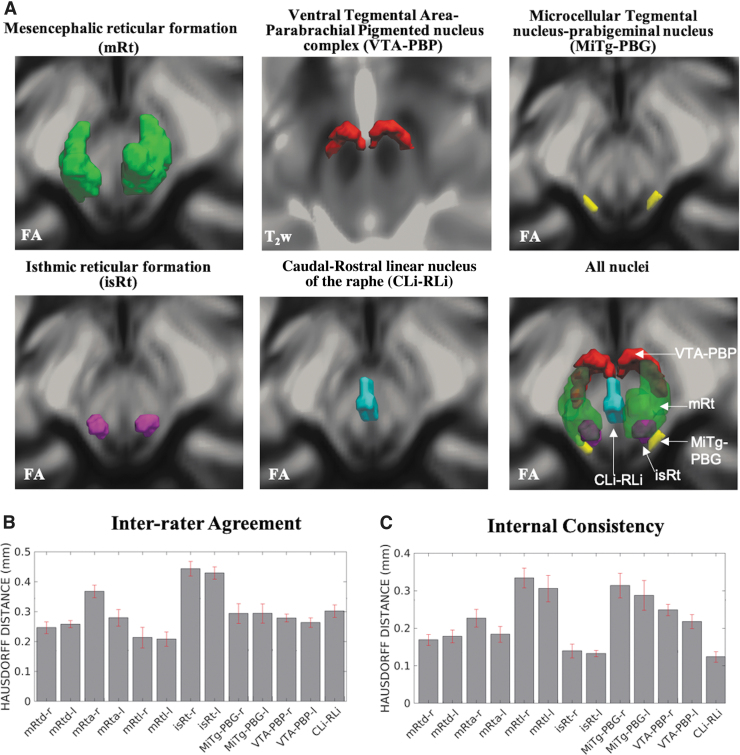
Introduction: The mesencephalic reticular formation, isthmic reticular formation, microcellular tegmental nucleus, ventral tegmental area-parabrachial pigmented nucleus complex, and caudal-rostral linear nucleus of the raphe are small brainstem regions crucially involved in arousal, sleep, and reward. Yet, these nuclei are difficult to identify with magnetic resonance imaging (MRI) of living humans. In the current work, we developed a probabilistic atlas of these brainstem nuclei in living humans, using noninvasive ultra-high-field MRI. Methods: We acquired single-subject, multicontrast (diffusion and T2-weighted), 1.1-mm isotropic resolution, 7 Tesla MRI images of 12 healthy subjects. After preprocessing and alignment to the stereotactic space, these images were used to delineate (in each subject) the nuclei of interest based on the image contrast as well as on neighboring nuclei and landmarks. Nucleus labels were averaged across subjects to yield probabilistic labels. The latter were further validated by assessment of the label inter-rater agreement, internal consistency, and volume. Results: Labels were delineated for each nucleus with good overlap across subjects. The inter-rater agreement and internal consistency were below (p < 10-8) the linear spatial imaging resolution (1.1 mm), thus validating the generated probabilistic atlas labels. The volumes of our labels did not differ from literature volumes (p < 0.05), further validating our atlas. Discussion and Conclusion: The probabilistic atlas of these five mesopontine nuclei expands current in vivo brainstem nuclei atlases and can be used as a tool to identify the location of these areas in conventional (e.g., 3 Tesla) images. This might serve to unravel the brainstem structure-to-function link and thus improve clinical outcomes. Impact statement The mesencephalic reticular formation, isthmic reticular formation, microcellular tegmental nucleus, ventral tegmental area-parabrachial pigmented nucleus complex, and caudal-rostral linear nucleus of the raphe are small brainstem regions crucially involved in arousal, sleep, and reward. In the current work, we developed a probabilistic atlas of these brainstem nuclei in living humans, using noninvasive, ultra-high-field magnetic resonance imaging. The probabilistic atlas of these five mesopontine nuclei expands current in vivo brainstem nuclei atlases and can be used as a tool to identify the location of these areas in conventional (e.g., 3 Tesla) images. This might serve to unravel the brainstem structure-to-function link and thus improve clinical outcomes.

Keywords: brainstem nuclei atlas; caudal-rostral linear nucleus of the raphe; isthmic reticular formation; mesencephalic reticular formation; microcellular tegmental nucleus; ventral tegmental area-parabrachial pigmented nucleus complex.


Conflict of interest statement

Authors have no conflicts of interest to disclose.

Figures

FIG. 1.
FIG. 1.
Probabilistic (n = 12) atlas label in the MNI space of the (a) entire mRt (both left and right nuclei: red-to-yellow). White arrows indicate neighboring nuclei such as SC (cool), CnF (blue), isRt (red), PAG (copper), and white matter tract of medial lemniscus (mL). Probabilistic (n = 12) atlas label in the MNI space of the (b) mRtd, (c) mRta, and (d) mRtl (both left and right nuclei: red-to-yellow). As a background image, we used the FA map in the MNI space. Very good (i.e., up to 100%) spatial agreement of labels across subjects was observed, indicating the feasibility of delineating the probabilistic labels of these nuclei. CnF, cuneiform nucleus; FA, fractional anisotropy; isRt, isthmic reticular formation; mRt, mesencephalic reticular formation; mRta, mesencephalic reticular formation anterior part; mRtd, mesencephalic reticular formation dorsal part; mRtl, mesencephalic reticular formation lateral part; PAG, periaqueductal gray; SC, superior colliculus.
FIG. 5.
FIG. 5.
The probabilistic (n = 12) atlas label in the MNI space of the CLi-RLi nucleus complex is shown (red-to-yellow) with neighboring nuclei, such as VTA-PBP (blue-to-light blue). As a background image, we used the FA map in the MNI space. Very good (i.e., up to 100%) spatial agreement of labels across subjects was observed, indicating the feasibility of delineating the probabilistic label of this nucleus. CLi-RLi, caudal–rostral linear nucleus of the raphe.
FIG. 2.
FIG. 2.
The probabilistic (n = 12) atlas label in MNI space of the isRt is shown (red-to-yellow) with neighboring nuclei (white arrows), such as PTg (green), CnF (blue), entire mRt (cool), and MiTg-PBG (red). As a background image, we used the FA map in the MNI space. Very good (i.e., up to 100%) spatial agreement of labels across subjects was observed, indicating the feasibility of delineating the probabilistic labels of these nuclei. CnF, cuneiform nucleus; MiTg-PBG, microcellular tegmental nucleus–prabigeminal nucleus; PTg, pedunculotegmental nucleus.
FIG. 3.
FIG. 3.
The probabilistic (n = 12) atlas label in MNI space of the MiTg-PBG is shown (red-to-yellow) with neighboring nuclei (white arrows) such as IC (cool), CnF (blue), PTg (green), isRt (red), and white matter spth. As a background image, we used the FA map in the MNI space. Very good (i.e., up to 100%) spatial agreement of labels across subjects was observed, indicating the feasibility of delineating the probabilistic label of this complex of nuclei. IC, inferior colliculus; spth, spinothalamic tract.
FIG. 4.
FIG. 4.
The probabilistic (n = 12) atlas label in the MNI space of VTA-PBP is shown (red-to-yellow) with neighboring nuclei (black arrows), such as STh (pink), SN (blue-light blue), RN (red), and CLi-RLi (green). As a background image, we used the T2w map in the MNI space. Very good (i.e., up to 100%) spatial agreement of labels across subjects was observed, indicating the feasibility of delineating the probabilistic label of this nucleus complex. Of note, we found good contrast for these nuclei, sandwiched between RN and SN, showing a horseshoe-shaped structure in the coronal and axial sections, which matched the description of these nuclei from literature (Olszewski and Baxter, ; Paxinos et al., 2012). CLi-RLi, caudal–rostral linear nucleus of the raphe; RN, red nucleus; SN, substantia nigra; STh, subthalamic nucleus; VTA-PBP, ventral tegmental area–parabrachial pigmented nucleus complex.
FIG. 6.
FIG. 6.
(A) 3D rendering of our nucleus labels of the entire mRt, isRt, MiTg-PBG, VTA-PBP, and CLi-RLi in the MNI space and of all the nuclei. As a background image, we used the FA map in the MNI space, except for VTA-PBP, for which we used the T2w image in the MNI space. The 3D rendering was achieved by the use of ITK-SNAP, v. 3.8.0 (Yushkevich et al., 2006), and ParaView, v. 5.9.0 (Ayachit, 2015); images were mildly rotated in the left/right direction to also display the nucleus label depth. (B, C) Atlas validation. (B) The inter-rater agreement of nucleus segmentation (bar/error bar = mean/SE modified Hausdorff distance across 12 subjects). (C) The internal consistency of nucleus labels across subjects (bar/error bar = mean/SE modified Hausdorff distance across 12 subjects). The labels of the mRtd-r/l, mRta-r/l, mRtl-r/l, isRt-r/l, MiTg-PBG-r/l, VTA-PBP-r/l, and CLi-RLi displayed good spatial overlap across raters and subjects (the modified Hausdorff distance was smaller than the spatial imaging resolution, p < 0.05), thus validating the probabilistic nucleus atlas. 3D, three-dimensional; SE, standard error.

Similar articles

Cited by

References

    1. Avants BB, Tustison NJ, Song G, et al. . 2011. A reproducible evaluation of ANTs similarity metric performance in brain image registration. Neuroimage 54:2033–2044. - PMC - PubMed
    1. Ayachit U. 2015. The Paraview Guide: A Parallel Visualization Application. NY, USA: Kitware, Inc.
    1. Barreiro-Iglesias A, Villar-Cerviño V, Anadón R, et al. . 2008. Development and organization of the descending serotonergic brainstem-spinal projections in the sea lamprey. J Chem Neuroanat 36:77–84. - PubMed
    1. Bianciardi M, Strong C, Toschi N, et al. . 2018. A probabilistic template of human mesopontine tegmental nuclei from in vivo 7T MRI. Neuroimage 170:222–230. - PMC - PubMed
    1. Bianciardi M, Toschi N, Edlow BL, et al. . 2015. Toward an in vivo neuroimaging template of human brainstem nuclei of the ascending arousal, autonomic, and motor systems. Brain Connect 5:597–607. - PMC - PubMed

Publication types

LinkOut - more resources