

Impacts of the 2008 Great Recession on dietary intake: a systematic review and meta-analysis
- PMID: 33926455
- PMCID: PMC8084260
- DOI: 10.1186/s12966-021-01125-8
Impacts of the 2008 Great Recession on dietary intake: a systematic review and meta-analysis
Abstract
Background: The 2008 Great Recession significantly impacted economies and individuals globally, with potential impacts on food systems and dietary intake. We systematically reviewed evidence on the impact of the Great Recession on individuals' dietary intake globally and whether disadvantaged individuals were disproportionately affected.
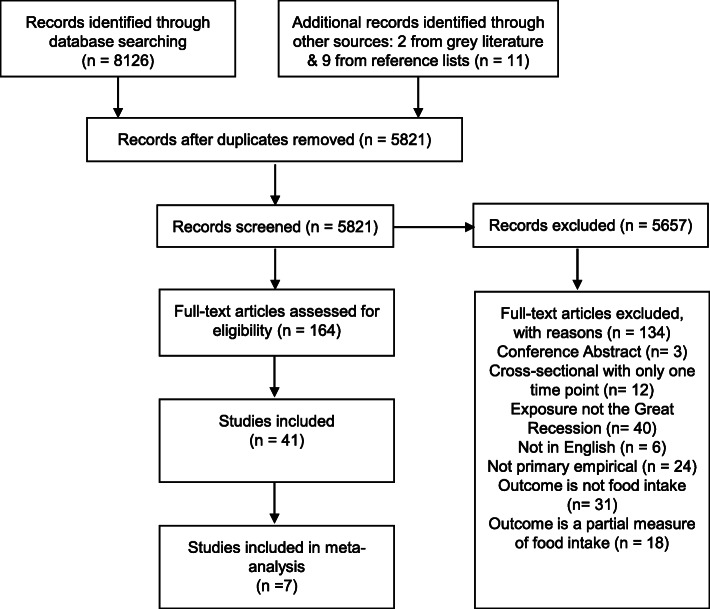
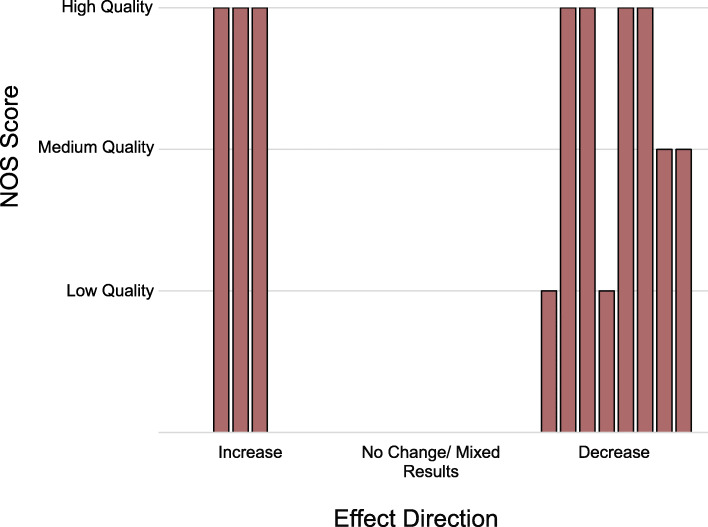
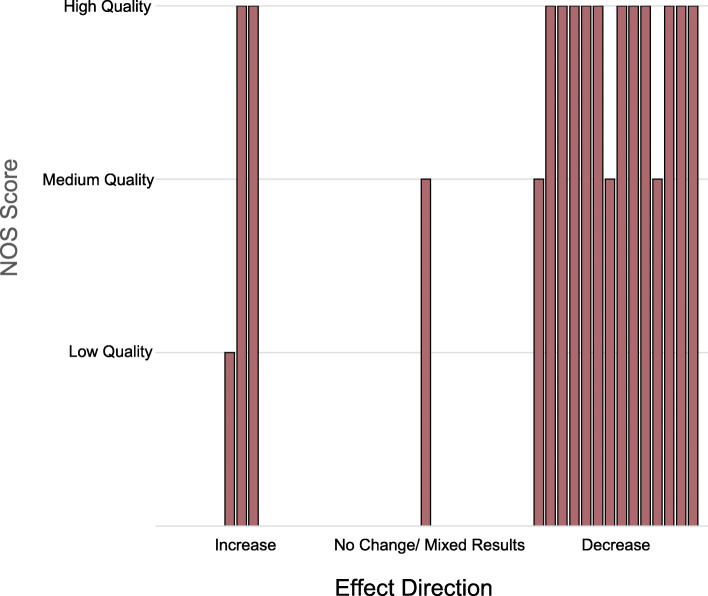
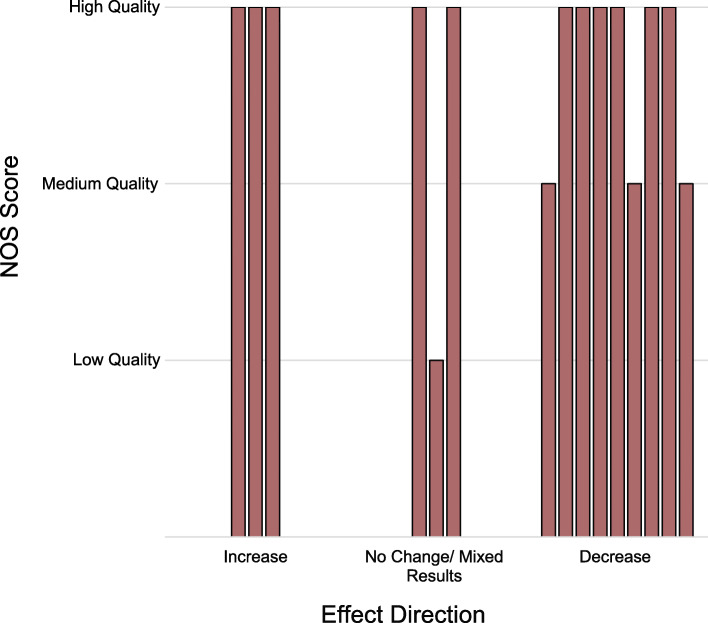
Methods: We searched seven databases and relevant grey literature through June 2020. Longitudinal quantitative studies with the 2008 recession as the exposure and any measure of dietary intake (energy intake, dietary quality, and food/macronutrient consumption) as the outcome were eligible for inclusion. Eligibility was independently assessed by two reviewers. The Newcastle Ottawa Scale was used for quality and risk of bias assessment. We undertook a random effects meta-analysis for changes in energy intake. Harvest plots were used to display and summarise study results for other outcomes. The study was registered with PROSPERO (CRD42019135864).
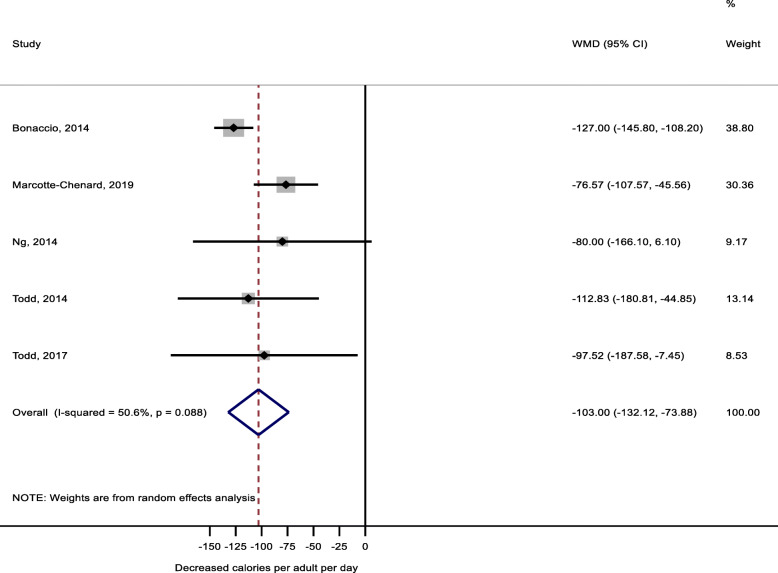
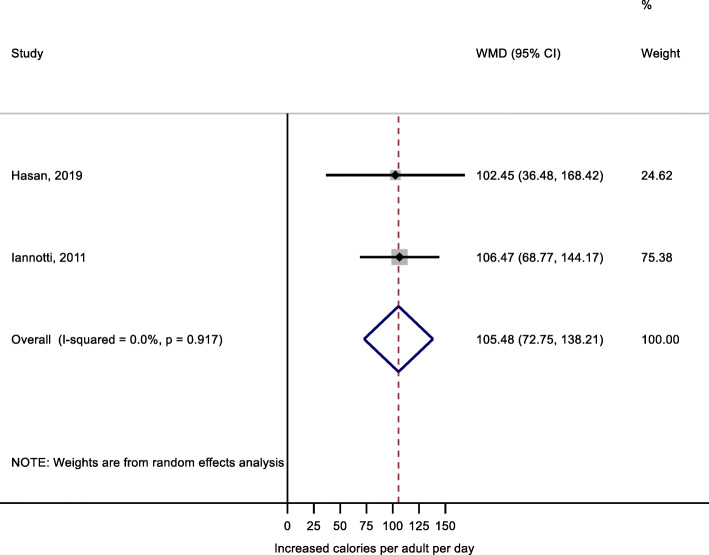
Results: Forty-one studies including 2.6 million people met our inclusion criteria and were heterogenous in both methods and results. Ten studies reported energy intake, 11 dietary quality, 34 food intake, and 13 macronutrient consumption. The Great Recession was associated with a mean reduction of 103.0 cal per adult equivalent per day (95% Confidence Interval: - 132.1, - 73.9) in high-income countries (5 studies) and an increase of 105.5 cal per adult per day (95% Confidence Interval: 72.8, 138.2) in middle-income countries (2 studies) following random effects meta-analysis. We found reductions in fruit and vegetable intake. We also found reductions in intake of fast food, sugary products, and soft drinks. Impacts on macronutrients and dietary quality were inconclusive, though suggestive of a decrease in dietary quality. The Great Recession had greater impacts on dietary intake for disadvantaged individuals.
Conclusions: The 2008 recession was associated with diverse impacts on diets. Calorie intake decreased in high income countries but increased in middle income countries. Fruit and vegetable consumption reduced, especially for more disadvantaged individuals, which may negatively affect health. Fast food, sugary products, and soft drink consumption also decreased which may confer health benefits. Implementing effective policies to mitigate adverse nutritional changes and encourage positive changes during the COVID-19 pandemic and other major economic shocks should be prioritised.
Keywords: Dietary intake; Economic recession; Economy; Food; Nutrition.
Conflict of interest statement
The authors declare that they have no competing interests.
Figures
References
-
- Long W, Li N, Wang H, Cheng S. Impact of US financial crisis on different countries: based on the method of functional analysis of variance. Procedia Comput Sci. 2012;9:1292–1298. doi: 10.1016/j.procs.2012.04.141. - DOI
Publication types
MeSH terms
Grants and funding
LinkOut - more resources
Full Text Sources
Other Literature Sources
Miscellaneous
