. 2021 Apr 29;22(1):122.
doi: 10.1186/s13059-021-02334-x.

The impact of cell type and context-dependent regulatory variants on human immune traits

Affiliations

The impact of cell type and context-dependent regulatory variants on human immune traits

Zepeng Mu et al. Genome Biol. .

Abstract

Background: The vast majority of trait-associated variants identified using genome-wide association studies (GWAS) are noncoding, and therefore assumed to impact gene regulation. However, the majority of trait-associated loci are unexplained by regulatory quantitative trait loci (QTLs).

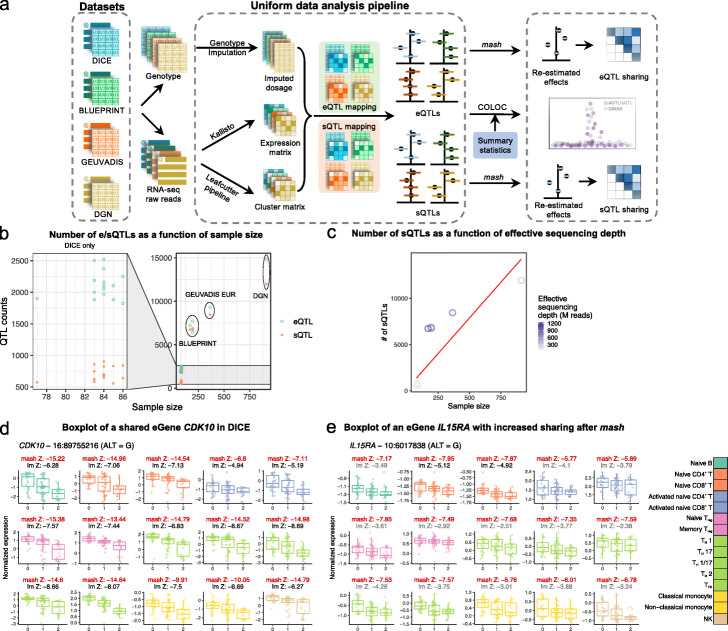
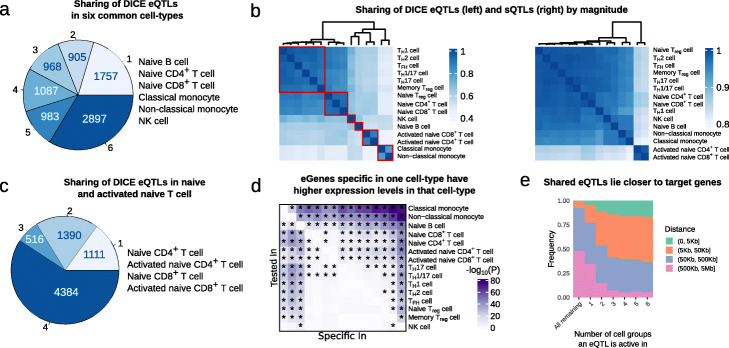
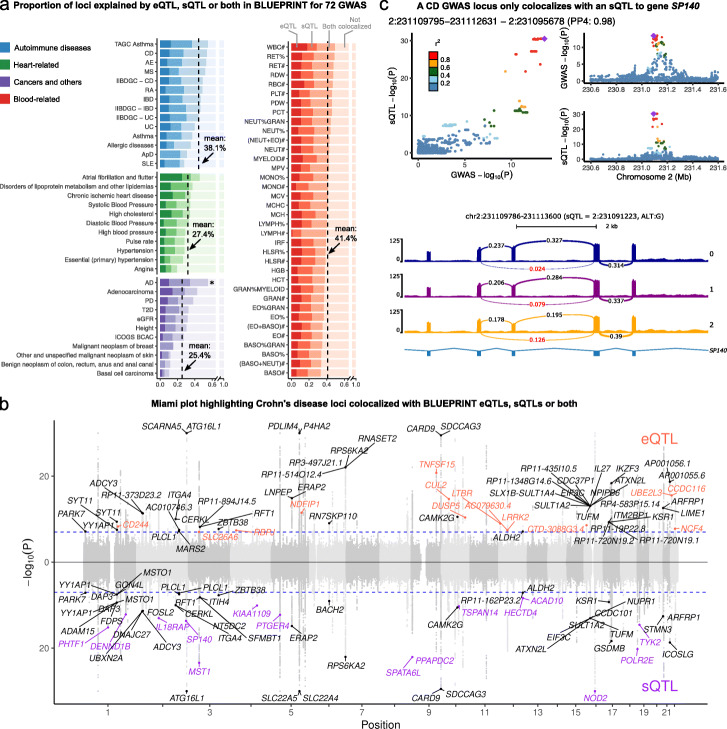
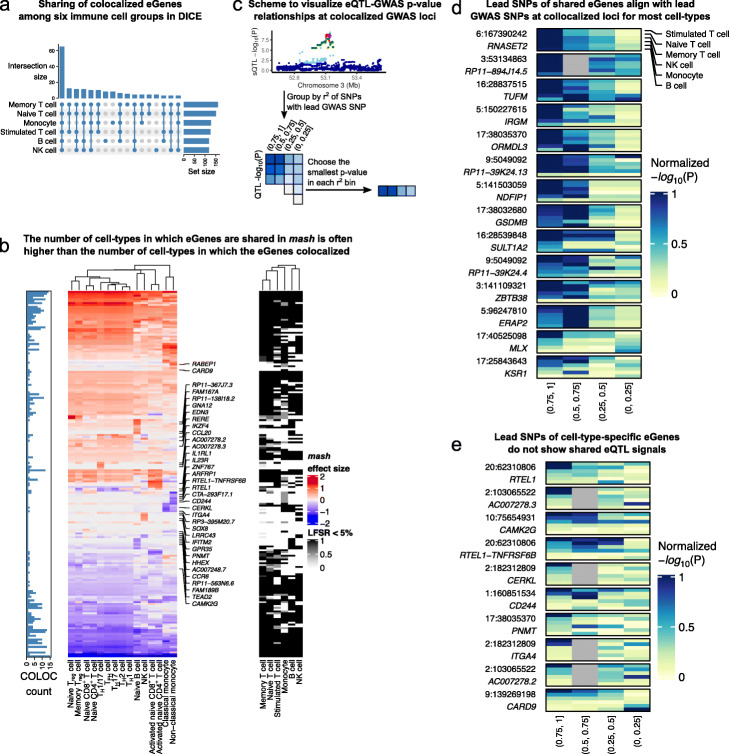
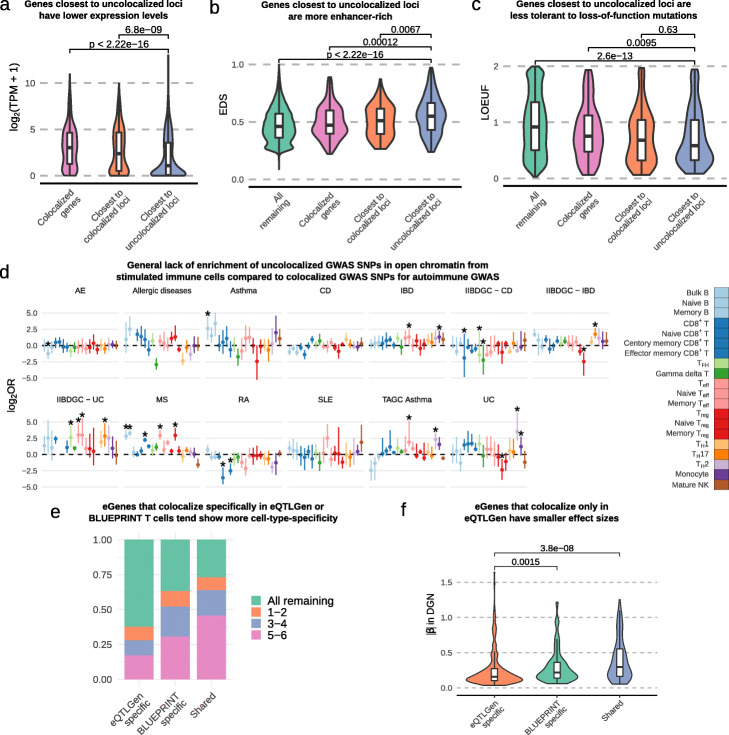
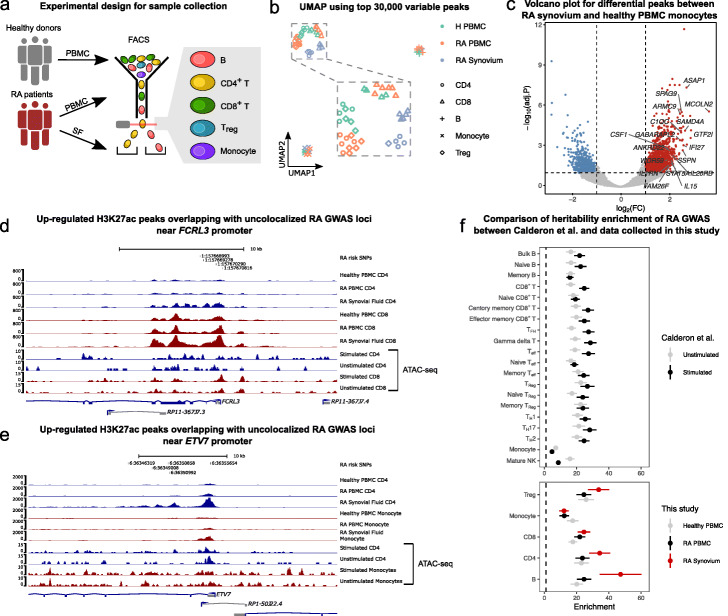
Results: We perform a comprehensive characterization of the putative mechanisms by which GWAS loci impact human immune traits. By harmonizing four major immune QTL studies, we identify 26,271 expression QTLs (eQTLs) and 23,121 splicing QTLs (sQTLs) spanning 18 immune cell types. Our colocalization analyses between QTLs and trait-associated loci from 72 GWAS reveals that genetic effects on RNA expression and splicing in immune cells colocalize with 40.4% of GWAS loci for immune-related traits, in many cases increasing the fraction of colocalized loci by two fold compared to previous studies. Notably, we find that the largest contributors of this increase are splicing QTLs, which colocalize on average with 14% of all GWAS loci that do not colocalize with eQTLs. By contrast, we find that cell type-specific eQTLs, and eQTLs with small effect sizes contribute very few new colocalizations. To investigate the 60% of GWAS loci that remain unexplained, we collect H3K27ac CUT&Tag data from rheumatoid arthritis and healthy controls, and find large-scale differences between immune cells from the different disease contexts, including at regions overlapping unexplained GWAS loci.

Conclusion: Altogether, our work supports RNA splicing as an important mediator of genetic effects on immune traits, and suggests that we must expand our study of regulatory processes in disease contexts to improve functional interpretation of as yet unexplained GWAS loci.

Keywords: Colocalization; GWAS; eQTL; sQTL.


Conflict of interest statement

The authors declare that they have no competing interests.

Figures

Fig. 1
Fig. 1
Summary of analysis workflow. a A uniform computational pipeline to analyze data from four immune RNA-seq datasets (DICE, BLUEPRINT, GEUVADIS, and DGN). The same pipeline for genotype imputation, expression and splicing quantification and QTL-mapping were applied to the four datasets. Sharing of QTLs among celltypes were quantified using mash [19], a statistical method that leverages the correlation structure of QTL effect sizes across multiple samples to re-estimate QTL effect in each sample. Colocalization analyses were performed for 72 GWAS of immune-related and non-immune traits. b Total number of genes and intron clusters with a significant QTL identified in DICE (left) and the other three studies (right) as a function of sample sizes. QTLs are considered significant when Storey’s q-value is below 0.05. c Studies with larger effective sequencing depth (BLUEPRINT and GEUVADIS EUR) have more sQTLs comapred to other studies. Effective sequencing depth = library size × read-length. Red line represents the fitted line in a simple linear model. d An eQTL at the gene CDK10 that is shared by all 15 cell types in DICE despite large differences in baseline expression levels across cell types. e An eQTL at the IL15RA gene that is shared across immune cell types but show cell type-specificity according to linear regression. Sharing of QTLs among cell types were quantified using mash [19], a statistical method that leverages the correlation structure of QTL effect sizes across multiple samples to re-estimate QTL effect in each sample. lm Z: Z-scores of linear model from FastQTL, mash Z: Z-scores estimated by mash (red). The lm Z-scores were colored in gray when the Z-score did not pass statistical significance after FastQTL permutation and in black when they were determined to be significant
Fig. 2
Fig. 2
Sharing of eQTLs and sQTLs using mash. a Estimated number of cell types in which eQTLs are inferred to be active out of six DICE cell type groups according to mash. These estimates of sharing are much higher than that from the original study [8]. b Sharing of eQTLs (left) and sQTLs (right) by magnitude (Fold difference in QTL effect size less than 2). Red square: cells were grouped into six clusters based on eQTL sharing, which resulted in the following groups: (i) Naïve T cells, (ii) Memory and Effector T cells, (iii) Monocytes, (iv) activated T cells, (v) B cells, and (vi) NK cells. c Estimated number of cell types in which eQTLs are inferred to be active among naïve and activated naïve T-cells from DICE. d Heatmap showing - log10p values of a differential gene expression analysis that compared the expression level of cell type-specific eGene in the discovery cell type to the expression levels of the eGene in the other 14 cell types. e Distance between eQTLs and their target genes stratified by the number of cell groups in which the eQTL is active. To obtain the six cell groups, we grouped the 15 cell types based on similarity in their mash effect sizes as described in b
Fig. 3
Fig. 3
Colocalization analysis explained up to 47% of GWAS variants and revealed potential causal SNPs to non-immune traits. a Proportions of GWAS loci colocalized with eQTLs, sQTLs, or both. Dashed line: mean colocalization rate. *: Alzheimer’s disease (AD) GWAS was not included in the mean calculation owing to the well-documented involvement of microglia in AD. b Colocalization of Crohn’s Disease (CD) GWAS with eQTLs (orange), sQTLs (purple), or both (black). GWAS SNPs with -log 10(P) larger than 30 were set to 30 to facilitate visualization. c LocusCompare plot (top) and Sashimi plot (bottom) showing colocalization between a sQTL of an intron in gene SP140 in T cell and a GWAS locus for CD. Arrows in the Sashimi plot point to the intron affected by the sQTL, labeled with PSI quantification from LeafCutter [23]
Fig. 4
Fig. 4
mash analysis indicates high sharing of QTLs among immune cell types. a Upset plot showing the cell-group-specificity or sharing of eGenes colocalized with immune-related GWAS loci. The majority of colocalized eGenes are shared across the 6 cell groups. b Heatmaps showing mash effect sizes of colocalized eGenes (left) and LFSR (<0.05, right). Barplot on the left shows the number of cell types in which the eGenes was determined to colocalize with a GWAS variant using COLOC. While the mash effect sizes are estimated to be shared across most immune cell types for most GWAS loci, the colocalization status as determined using COLOC (PP4 >0.75) often imply cell type-specificity. c Schematic representation of our approach to visualize the QTL association P value distribution of colocalized eGenes across SNPs with different amount of LD with the lead GWAS SNP. If a QTL in a cell type colocalizes with a GWAS loci, then in general the significance of the QTL association should decrease for SNPs with decreasing amount of LD with the lead GWAS SNP. d eQTL p values in different LD bins (as described in c) at GWAS loci with colocalized eQTLs across all 6 cell groups. Colocalized eGenes that were inferred to be shared all have lower eQTL p values at SNPs in high LD with the lead GWAS SNPs. e By contrast, colocalized eGenes that were inferred to be cell type-specific show different patterns of eQTL p value distribution in the LD bins
Fig. 5
Fig. 5
Characterizations of uncolocalized GWAS loci. a Genes closest to uncolocalized loci are expressed at lower levels compared to colocalized eGenes. b Genes closest to uncolocalized loci have higher EDS, indicating their expression is more constrained. c Genes closest to uncolocalized loci have lower LOEUF [40], suggesting that they are less tolerant to rare mutations. d Forest plot showing the log2 odds ratios of the enrichment of uncolocalized GWAS SNPs in open chromatin of stimulated immune cells compared to colocalized GWAS SNPs (Fisher’s exact test). Few stimulated immune cell types are enriched for uncolocalized autoimmune GWAS loci. Error bars show 95% confidence intervals from bootstrap (Methods); *: FDR <0.05. e eGenes that colocalized only in eQTLGen data tend to be restricted in fewer cell types (in DICE data) compared to eGenes that colocalized only in BLUEPRINT data or eGenes that colocalized in both BLUEPRINT and eQTLGen. f eGenes that colocalize only in eQTLGen data have smaller effect sizes compared to eGenes that colocalize only in BLUEPRINT T cells or eGenes that are shared between eQTLGen and BLUEPRINT. To reduce the Winner’s curse effect, the effect sizes were ascertained using the DGN dataset
Fig. 6
Fig. 6
H3K27ac profiling in RA samples reveals disease-specific effects. a Schematic representation of our sample collection design. b UMAP of healthy and RA samples collected from PBMC and synovial fluid. The samples clustered by cell type and by immune context. c Volcano plot showing differentially acetylated (H3K27ac) peaks between RA SF and healthy PBMC monocytes. d, e Examples of unexplained GWAS loci that overlap with regions that with higher H3K27ac activity in RA synovial fluid immune cells. RA risk SNPs were fine-mapped using SuSiE [51] and are shown along with their GWAS − log10p-values. ATAC-seq peaks from Calderon et.al [41] were plotted for comparison. d H3K27ac activity at the FCRL3 promoter is increased in RA SF CD4+ T cells (log2CPM: 4.02) compared to RA PBMC CD4+ T cells (log2-fold-change: 1.55, log2CPM: 2.46, FDR: 0.016) and healthy PBMC CD4+ T cells (log2-fold-change: 1.72, log2CPM: 2.30, FDR: 0.0077). For CD8+ T cells, the log2-fold-change is 1.32 compared to healthy PBMC. e H3K27ac activity at the ETV7 promoter is increased in RA SF CD4+ T cells (log2CPM: 6.48) compared to RA PBMC CD4+ T cells (log2-fold-change: 1.89, log2CPM: 4.60, FDR: 0.0016) and healthy PBMC CD4 T cells (log2-fold-change: 2.47, log2CPM: 4.01, FDR: 5.70×10⁻⁵). For monocytes, the log2-fold-change is 2.02 compared to healthy PBMC. f Forest plot of hetibability enrichment in ATAC-seq peaks (top) and H3K27ac CUT&TAG peaks from various cell types (bottom) computed using stratified LDscore regression [5]. RA heritability enrichments in H3K27ac peaks detected in T cells and B cells from RA synovial fluids are greater than that of ATAC-seq peaks of the same cell types subject to in vitro stimulation. Error bars represent ±1 standard error

Similar articles

Cited by

References

    1. Visscher PM, Wray NR, Zhang Q, Sklar P, McCarthy MI, Brown MA, Yang J. 10 years of GWAS discovery: biology, function, and translation. Am J Hum Genet. 2017;101(1):5–22. doi: 10.1016/j.ajhg.2017.06.005. - DOI - PMC - PubMed
    1. Hindorff LA, Sethupathy P, Junkins HA, Ramos EM, Mehta JP, Collins FS, Manolio TA. Potential etiologic and functional implications of genome-wide association loci for human diseases and traits. Proc Natl Acad Sci. 2009;106(23):9362–7. doi: 10.1073/pnas.0903103106. - DOI - PMC - PubMed
    1. Nicolae DL, Gamazon E, Zhang W, Duan S, Dolan ME, Cox NJ. Trait-associated SNPs are more likely to be eQTLs: annotation to enhance discovery from GWAS. PLoS Genet. 2010;6(4):1000888. doi: 10.1371/journal.pgen.1000888. - DOI - PMC - PubMed
    1. Maurano MT, Humbert R, Rynes E, Thurman RE, Haugen E, Wang H, Reynolds AP, Sandstrom R, Qu H, Brody J, et al. Systematic localization of common disease-associated variation in regulatory DNA. Science. 2012;337(6099):1190–5. doi: 10.1126/science.1222794. - DOI - PMC - PubMed
    1. Finucane HK, Bulik-Sullivan B, Gusev A, Trynka G, Reshef Y, Loh P-R, Anttila V, Xu H, Zang C, Farh K, et al. Partitioning heritability by functional annotation using genome-wide association summary statistics. Nat Genet. 2015;47(11):1228. doi: 10.1038/ng.3404. - DOI - PMC - PubMed

Publication types

MeSH terms

LinkOut - more resources