. 2021 Apr 29;13(1):72.
doi: 10.1186/s13073-021-00880-4.

Crosstalk between microRNA expression and DNA methylation drives the hormone-dependent phenotype of breast cancer

Collaborators, Affiliations

Crosstalk between microRNA expression and DNA methylation drives the hormone-dependent phenotype of breast cancer

Miriam Ragle Aure et al. Genome Med. .

Abstract

Background: Abnormal DNA methylation is observed as an early event in breast carcinogenesis. However, how such alterations arise is still poorly understood. microRNAs (miRNAs) regulate gene expression at the post-transcriptional level and play key roles in various biological processes. Here, we integrate miRNA expression and DNA methylation at CpGs to study how miRNAs may affect the breast cancer methylome and how DNA methylation may regulate miRNA expression.

Methods: miRNA expression and DNA methylation data from two breast cancer cohorts, Oslo2 (n = 297) and The Cancer Genome Atlas (n = 439), were integrated through a correlation approach that we term miRNA-methylation Quantitative Trait Loci (mimQTL) analysis. Hierarchical clustering was used to identify clusters of miRNAs and CpGs that were further characterized through analysis of mRNA/protein expression, clinicopathological features, in silico deconvolution, chromatin state and accessibility, transcription factor binding, and long-range interaction data.

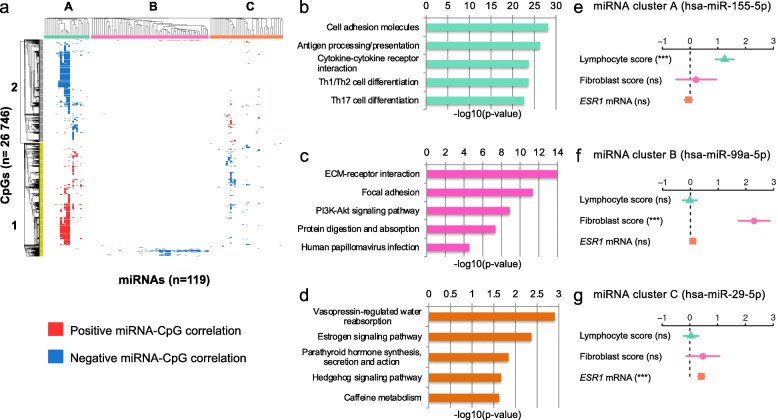
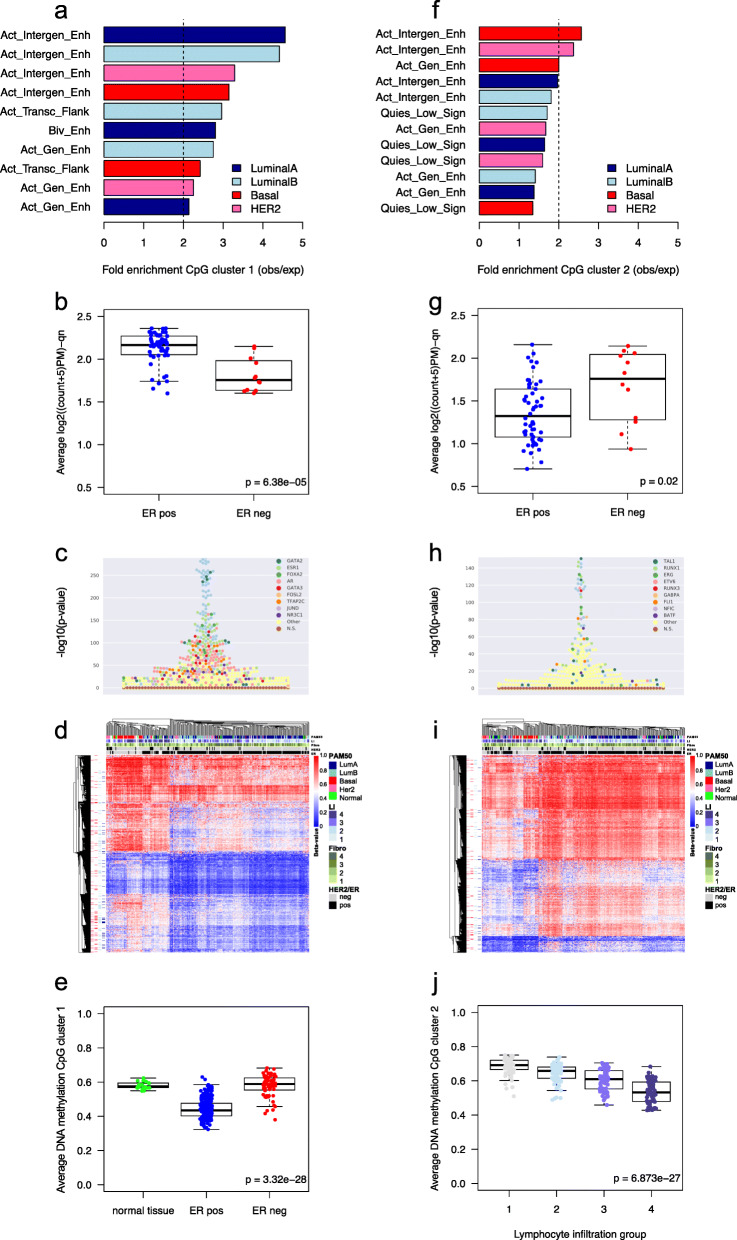
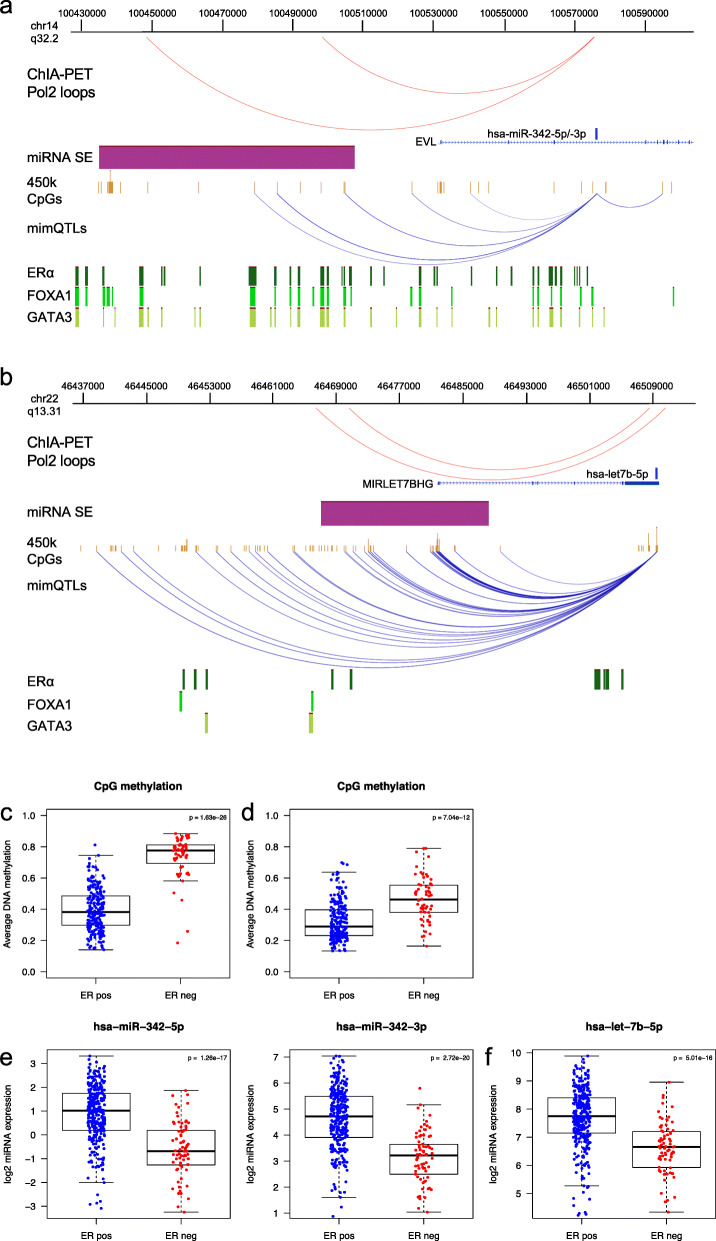
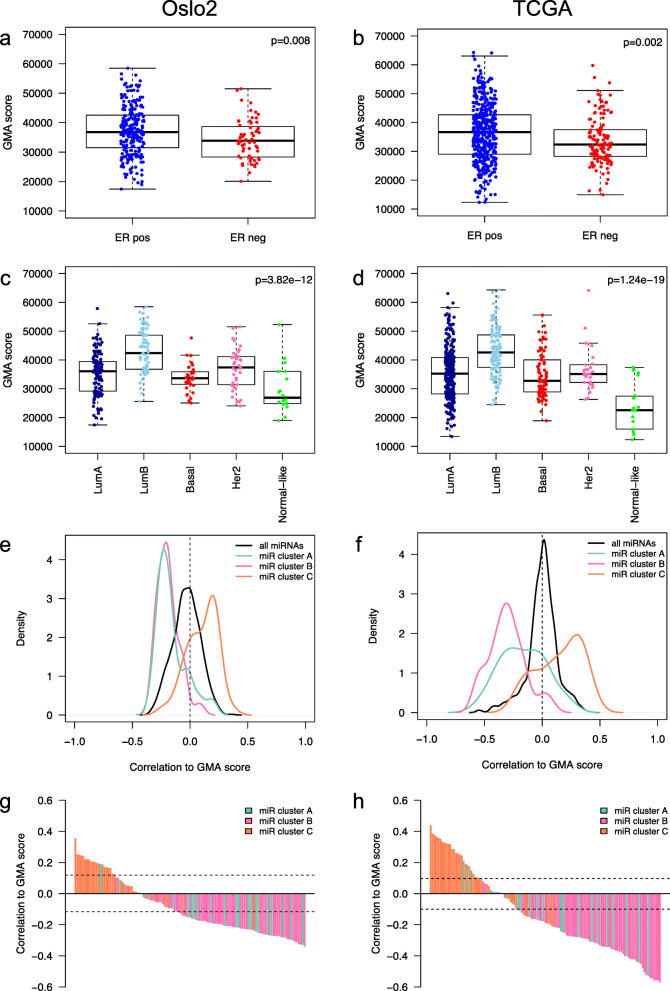
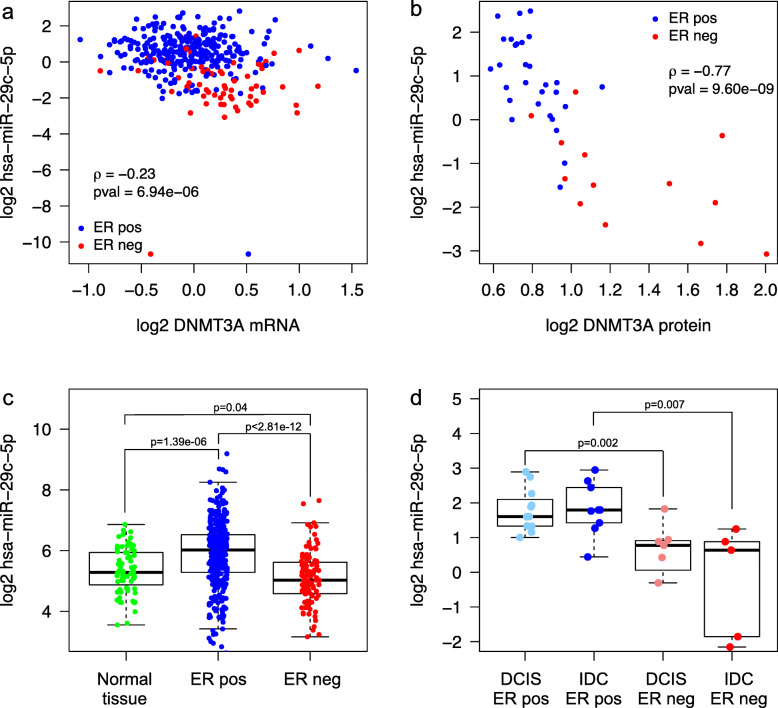
Results: Clustering of the significant mimQTLs identified distinct groups of miRNAs and CpGs that reflect important biological processes associated with breast cancer pathogenesis. Notably, two major miRNA clusters were related to immune or fibroblast infiltration, hence identifying miRNAs associated with cells of the tumor microenvironment, while another large cluster was related to estrogen receptor (ER) signaling. Studying the chromatin landscape surrounding CpGs associated with the estrogen signaling cluster, we found that miRNAs from this cluster are likely to be regulated through DNA methylation of enhancers bound by FOXA1, GATA2, and ER-alpha. Further, at the hub of the estrogen cluster, we identified hsa-miR-29c-5p as negatively correlated with the mRNA and protein expression of DNA methyltransferase DNMT3A, a key enzyme regulating DNA methylation. We found deregulation of hsa-miR-29c-5p already present in pre-invasive breast lesions and postulate that hsa-miR-29c-5p may trigger early event abnormal DNA methylation in ER-positive breast cancer.

Conclusions: We describe how miRNA expression and DNA methylation interact and associate with distinct breast cancer phenotypes.

Keywords: Breast cancer; Methylation; Omics integration; Systems biology; miRNA.


Conflict of interest statement

The authors declare that they have no competing interests.

Figures

Fig. 1
Fig. 1
Identification of miRNA-methylation Quantitative Trait Loci (mimQTL) clusters and corresponding annotation. a Heatmap showing hierarchical clustering of the 89,118 significant mimQTLs found in both the Oslo2 and TCGA cohorts. miRNAs are shown in columns and CpGs in rows. In the heatmap, blue color indicates a negative correlation and red color indicates a positive correlation between miRNA expression and CpG methylation. Three main miRNA clusters (cluster A, B, and C) and two main CpG clusters (cluster 1 and 2) were identified. b–d Barplots showing the top five most enriched pathways for genes co-expressed (miRNA-mRNA expression Spearman correlation > 0.4) with the miRNAs of cluster A (b), B (c), and C (d). The x-axis show the − log10(p value) of the pathway enrichment obtained from Enrichr [33]. Bars are color-coded according to the associated miRNA cluster. e–g Results from fitting generalized linear models (GLM) to model miRNA expression as a multivariate function of lymphocyte infiltration (obtained by Nanodissect [34]), fibroblast infiltration (obtained by xCell [35]), and ESR1 mRNA expression. The GLM coefficients are depicted with 95% confidence intervals for each of the miRNAs with the highest number of CpG associations in each cluster. Asterisks (***) denote a p value < 0.001 and “ns” denotes not significant (p value > 0.05)
Fig. 2
Fig. 2
Functional annotation of the CpG clusters. a Genomic location enrichment of mimQTL CpGs in cluster 1 according to ChromHMM data from cell lines representing different breast cancer subtypes [37]. Only regions with fold-enrichment > 2 are shown. Active Genic Enhancer = Act_Gen_Enh, Active Transcription Flanking = Act_Transc_Flank, Bivalent Enhancer = Biv_Enh, Active Intergenic Enhancer = Act_Intergen_Enh, observed = obs, expected = exp. b Average normalized counts per tumor sample for all ATAC-seq peaks mapped to CpGs of cluster 1 (TCGA data). c Beeswarm plot showing enrichment of TF binding sites (−(log10(p value) using Fisher’s exact tests) on the y-axis for CpGs of cluster 1 (n = 14,040) according to UniBind [40]. TF names of the top 10 enriched TF binding sites data sets are provided with dedicated colors. Data sets for the same TFs are highlighted with the corresponding colors. d Heatmap showing hierarchical clustering of tumor methylation levels of CpG cluster 1 (n = 14,040) in the Oslo2 cohort (CpGs in rows and tumors in columns). Tumors are annotated according to PAM50 molecular subtypes; lymphocyte infiltration (LI) quartile groups 1(low)–4(high); fibroblast infiltration quartile groups (Fibro): 1(low)–4(high); human epidermal growth factor receptor 2 (HER2) status; estrogen receptor (ER) status. CpGs are annotated according to overlap with regions annotated as “Active Intergenic Enhancer” from ChromHMM of subtype-specific cell lines [37]; Her2 (pink), Basal (red), LumB (light blue), and LumA (dark blue). e Boxplot showing average DNA methylation of CpGs from cluster 1 in normal breast tissue (n = 17), ER-positive (pos; n = 223) and ER-negative tumors (neg; n = 60) of the Oslo2 cohort. f Enrichment of mimQTL CpGs in cluster 2 according to ChromHMM data. Quiescent_Low signals = Quies_Low_Sign. g Average normalized counts for ATAC-seq peaks mapped to CpGs of cluster 2. h Enrichment of TF binding sites for CpGs of cluster 2 (n = 12,706). i Hierarchical clustering of tumor methylation levels of CpG cluster 2 (n = 12,706). j Boxplot showing average DNA methylation of cluster 2 CpGs when Oslo2 tumors were separated into lymphocyte infiltration quartile groups from low (1) to high (4). Wilcoxon rank-sum p values (two-group comparisons) and Kruskal-Wallis p values (three or more groups) are indicated
Fig. 3
Fig. 3
Super-enhancer (SE)–miRNA interactions and impact of CpG methylation on miRNA expression. a Example of mimQTLs (blue arcs) and ChIA-PET Pol2 loops (red arcs) where mimQTL CpGs (n = 3) or one foot of the ChIA-PET Pol2 loop is located within the hsa-miR-342 SE (purple) and the other loop foot resides within hsa-miR-342-5p/-3p. Also shown are the location of 450k methylation array CpGs and ER-alpha (ERα), FOXA1, and GATA3 binding regions obtained from ChIP-Seq experiments of the MCF7 cell line. The figure was made using the WashU Epigenome Browser v. 46.2 [64]. b mimQTLs and ChIA-PET Pol2 loops where mimQTL CpGs (n = 21) or one foot of the ChIA-PET Pol2 loop is located within the let-7b SE (purple) and the other loop foot resides within hsa-let-7b-5p. c Boxplot showing average DNA methylation in Oslo2 estrogen receptor (ER)-positive (pos) and ER-negative (neg) tumors across all CpGs within the hsa-miR-342 SE and in mimQTL with hsa-miR-342-3p/-5p (n = 3). d Boxplot showing average DNA methylation in Oslo2 ER-positive and ER-negative tumors across all CpGs within the let-7b SE and in mimQTL with hsa-let-7b-5p (n = 21). e Boxplots showing hsa-miR-342-5p/-3p expression in ER-positive and ER-negative tumors of the Oslo2 cohort. f Boxplots showing hsa-let-7b-5p expression in ER-positive and ER-negative tumors of the Oslo2 cohort. P values resulting from Wilcoxon rank-sum tests are indicated in the boxplots
Fig. 4
Fig. 4
Global methylation alteration (GMA) score in clinical breast cancer groups and correlation to miRNA expression. a, b Boxplots showing the GMA score in estrogen receptor (ER)-positive (pos) and ER-negative (neg) tumors of the Oslo2 (a) and TCGA (b) cohorts. Wilcoxon rank-sum test p values are shown. c, d Boxplots showing the GMA score in PAM50 molecular subtypes of the Oslo2 (c) and TCGA (d) cohorts. LumA: Luminal A, LumB: Luminal B, Basal: Basal-like, Her2: HER2-enriched. Kruskal-Wallis test p values are denoted. e, f Plots showing density curves of the correlation between miRNA cluster members and the GMA score for the Oslo2 (e) and TCGA (f) cohorts. The density lines are color-coded according to miRNA cluster. g, h Barplots showing miRNAs decreasingly ranked according to GMA score correlation level (y-axis) in the Oslo2 (g) and TCGA (h) cohorts. The bars are color-coded according to miRNA cluster
Fig. 5
Fig. 5
Expression of hsa-miR-29c-5p and correlation to DNMT3A. a DNMT3A mRNA expression (x-axis) vs. hsa-miR-29c-5p expression (y-axis) measured in 377 samples of the Oslo2 cohort. Estrogen receptor (ER)-positive (pos) tumors are plotted in blue and ER-negative (neg) in red. Spearman correlation coefficient (rho: ρ) and p value (pval) indicated. b DNMT3A protein expression (x-axis) vs. hsa-miR-29c-5p expression (y-axis) measured in 45 samples of the Oslo2 cohort. c hsa-miR-29c-5p expression in normal adjacent breast tissue (Normal tissue; n = 76), ER-positive (n = 333) and ER-negative tumors (n = 106) of the TCGA cohort. Wilcoxon rank-sum test p values are denoted. d hsa-miR-29c-5p expression in ER-positive (n = 11) and ER-negative (n = 7) ductal carcinoma in situ (DCIS) samples and ER-positive (n = 9) and ER-negative (n = 5) invasive ductal carcinoma (IDC) samples from the same data set [13]. Wilcoxon rank-sum test p values are denoted

Similar articles

Cited by

References

    1. Fleischer T, Frigessi A, Johnson KC, Edvardsen H, Touleimat N, Klajic J, Riis ML, Haakensen VD, Wärnberg F, Naume B, et al. Genome-wide DNA methylation profiles in progression to in situ and invasive carcinoma of the breast with impact on gene transcription and prognosis. Genome Biol. 2014;15:435. - PMC - PubMed
    1. Fleischer T, Tekpli X, Mathelier A, Wang S, Nebdal D, Dhakal HP, Sahlberg KK, Schlichting E, Sauer T, Geisler J, et al. DNA methylation at enhancers identifies distinct breast cancer lineages. Nat Commun. 2017;8(1):1379. doi: 10.1038/s41467-017-00510-x. - DOI - PMC - PubMed
    1. Stefansson OA, Moran S, Gomez A, Sayols S, Arribas-Jorba C, Sandoval J, Hilmarsdottir H, Olafsdottir E, Tryggvadottir L, Jonasson JG, Eyfjord J, Esteller M. A DNA methylation-based definition of biologically distinct breast cancer subtypes. Mol Oncol. 2015;9(3):555–568. doi: 10.1016/j.molonc.2014.10.012. - DOI - PMC - PubMed
    1. Achinger-Kawecka J, Valdes-Mora F, Luu P-L, Giles KA, Caldon CE, Qu W, et al. Epigenetic reprogramming at estrogen-receptor binding sites alters 3D chromatin landscape in endocrine-resistant breast cancer. Nat Commun. 2020;11(1):320. 10.1038/s41467-019-14098-x. - PMC - PubMed
    1. Rodríguez-Paredes M, Esteller M. Cancer epigenetics reaches mainstream oncology. Nat Med. 2011;17(3):330–9. 10.1038/nm.2305. - PubMed

Publication types