Review
. 2021 Apr 29;22(1):121.
doi: 10.1186/s13059-021-02337-8.

Best practices on the differential expression analysis of multi-species RNA-seq

Affiliations
Review

Best practices on the differential expression analysis of multi-species RNA-seq

Matthew Chung et al. Genome Biol. .

Abstract

Advances in transcriptome sequencing allow for simultaneous interrogation of differentially expressed genes from multiple species originating from a single RNA sample, termed dual or multi-species transcriptomics. Compared to single-species differential expression analysis, the design of multi-species differential expression experiments must account for the relative abundances of each organism of interest within the sample, often requiring enrichment methods and yielding differences in total read counts across samples. The analysis of multi-species transcriptomics datasets requires modifications to the alignment, quantification, and downstream analysis steps compared to the single-species analysis pipelines. We describe best practices for multi-species transcriptomics and differential gene expression.

Keywords: Best practices; Differential gene expression; RNA-Seq; Transcriptomics.


Conflict of interest statement

The authors declare no competing interests.

Figures

Fig. 1
Fig. 1
A general workflow for the enrichment, library preparation, and sequencing steps of a typical multi-species RNA-Seq analysis. Created with BioRender.com
Fig. 2
Fig. 2
A general workflow for the read processing, alignment, and quantification steps of a typical multi-species RNA-Seq analysis. Created with BioRender.com
Fig. 3
Fig. 3
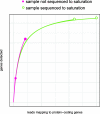
Examples of saturation curves for two samples that reach saturation and two samples that do not reach saturation
Fig. 4
Fig. 4
A general workflow showing examples of downstream analyses for a typical multi-species RNA-Seq analysis. Created with BioRender.com

References

    1. Mortazavi A, Williams BA, McCue K, Schaeffer L, Wold B. Mapping and quantifying mammalian transcriptomes by RNA-Seq. Nat Methods. 2008;5(7):621–628. doi: 10.1038/nmeth.1226. - DOI - PubMed
    1. Nagalakshmi U, Wang Z, Waern K, Shou C, Raha D, Gerstein M, Snyder M. The transcriptional landscape of the yeast genome defined by RNA sequencing. Science. 2008;320(5881):1344–1349. doi: 10.1126/science.1158441. - DOI - PMC - PubMed
    1. Lister R, O'Malley RC, Tonti-Filippini J, Gregory BD, Berry CC, Millar AH, Ecker JR. Highly integrated single-base resolution maps of the epigenome in Arabidopsis. Cell. 2008;133(3):523–536. doi: 10.1016/j.cell.2008.03.029. - DOI - PMC - PubMed
    1. Saliba AE, SCS, Vogel J. New RNA-seq approaches for the study of bacterial pathogens. Curr Opin Microbiol. 2017;35:78–87. doi: 10.1016/j.mib.2017.01.001. - DOI - PubMed
    1. Elekwachi CO, Wang Z, Wu X, Rabee A, Forster RJ. Total rRNA-Seq analysis gives insight into bacterial, fungal, protozoal and archaeal communities in the rumen using an optimized RNA isolation method. Front Microbiol. 2017;8:1814. doi: 10.3389/fmicb.2017.01814. - DOI - PMC - PubMed

Publication types

LinkOut - more resources