. 2021 Sep;80(9):1227-1235.
doi: 10.1136/annrheumdis-2020-219624. Epub 2021 Apr 29.

Genome-wide association study identifies RNF123 locus as associated with chronic widespread musculoskeletal pain

Collaborators, Affiliations

Genome-wide association study identifies RNF123 locus as associated with chronic widespread musculoskeletal pain

Md Shafiqur Rahman et al. Ann Rheum Dis. 2021 Sep.

Abstract

Background and objectives: Chronic widespread musculoskeletal pain (CWP) is a symptom of fibromyalgia and a complex trait with poorly understood pathogenesis. CWP is heritable (48%-54%), but its genetic architecture is unknown and candidate gene studies have produced inconsistent results. We conducted a genome-wide association study to get insight into the genetic background of CWP.

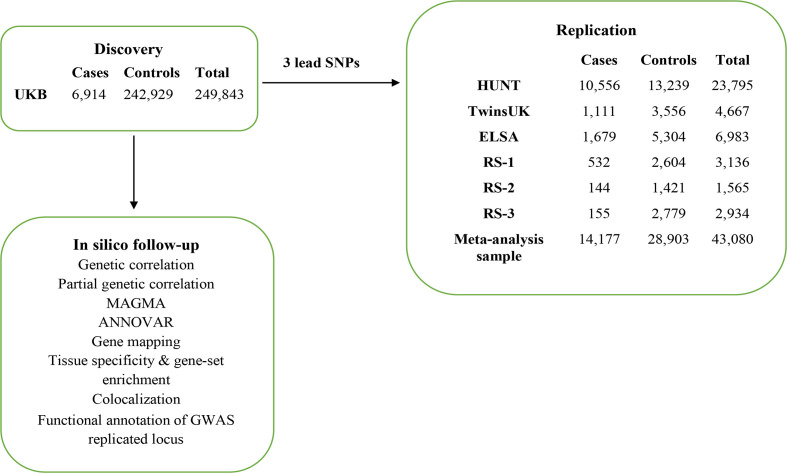
Methods: Northern Europeans from UK Biobank comprising 6914 cases reporting pain all over the body lasting >3 months and 242 929 controls were studied. Replication of three independent genome-wide significant single nucleotide polymorphisms was attempted in six independent European cohorts (n=43 080; cases=14 177). Genetic correlations with risk factors, tissue specificity and colocalisation were examined.

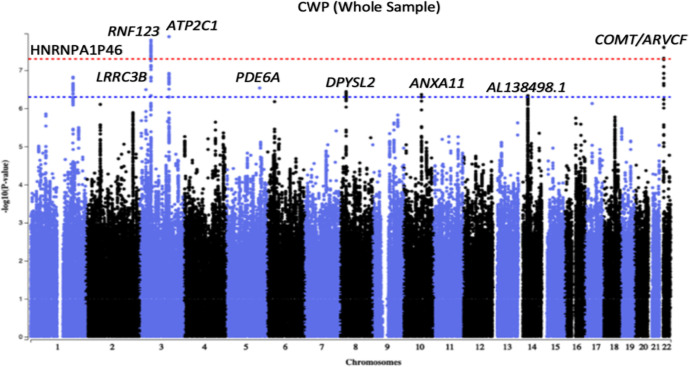
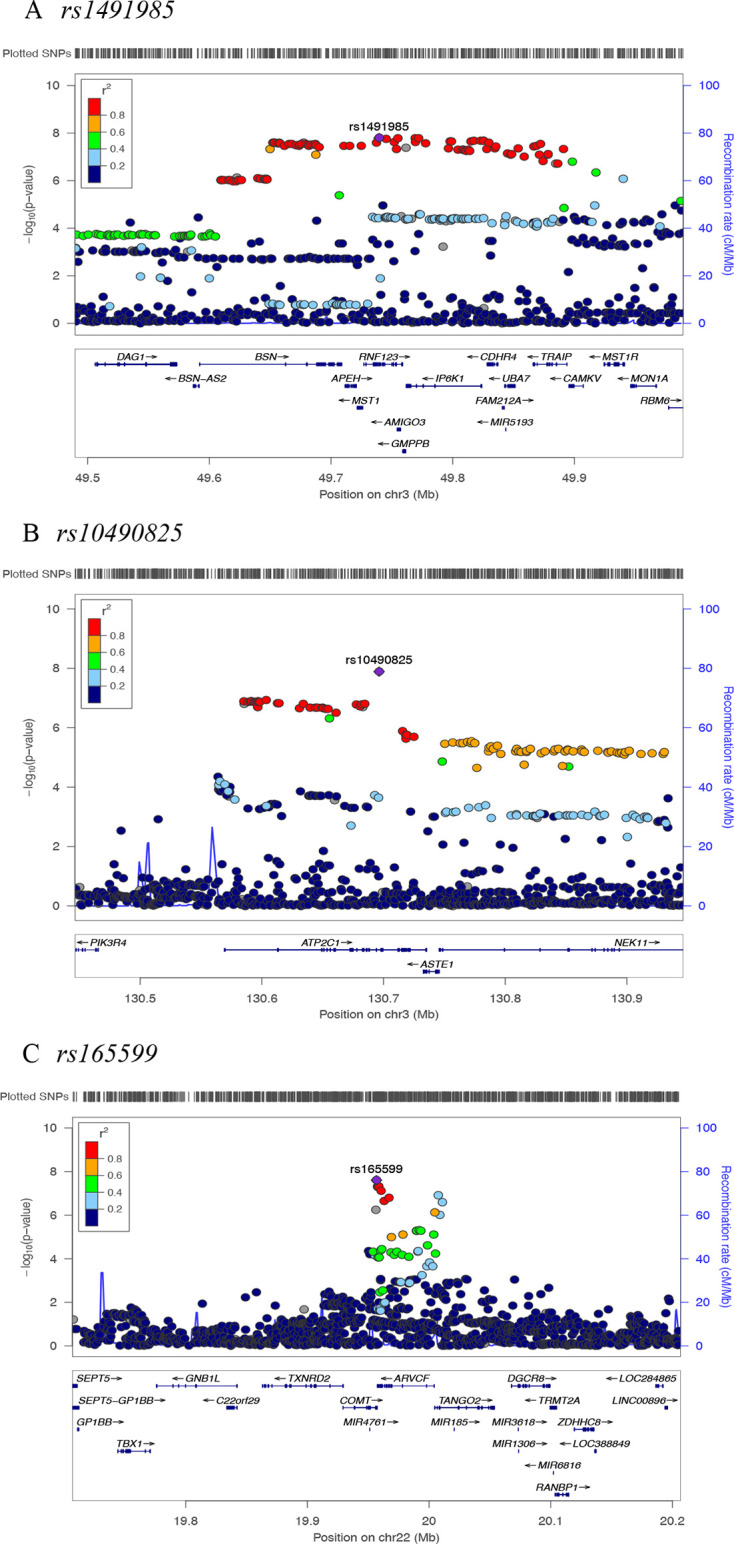
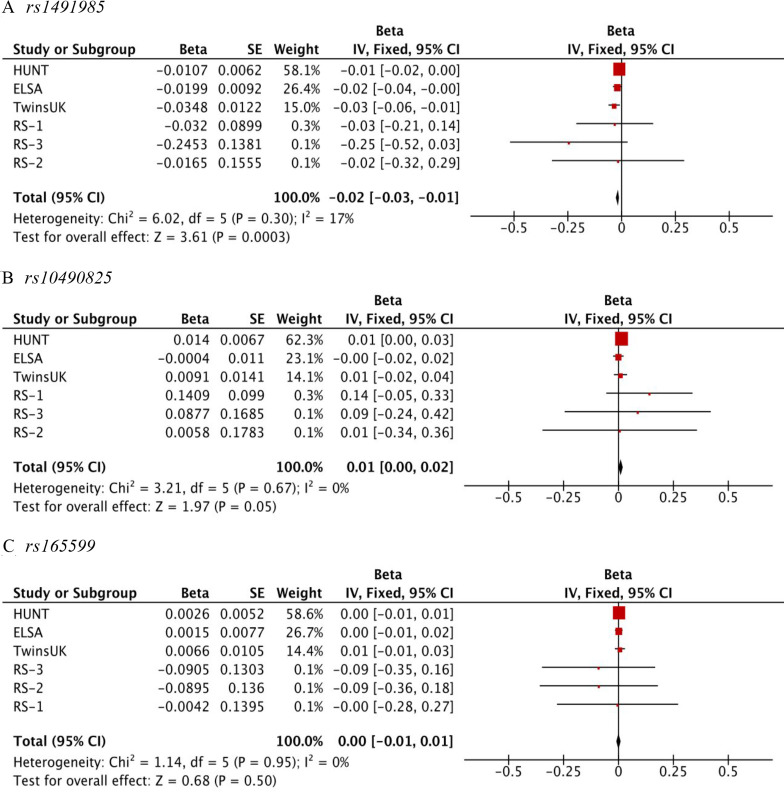
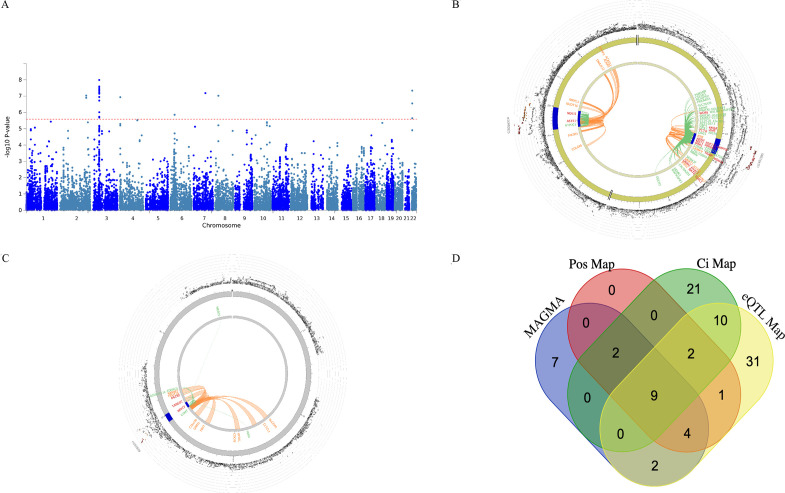
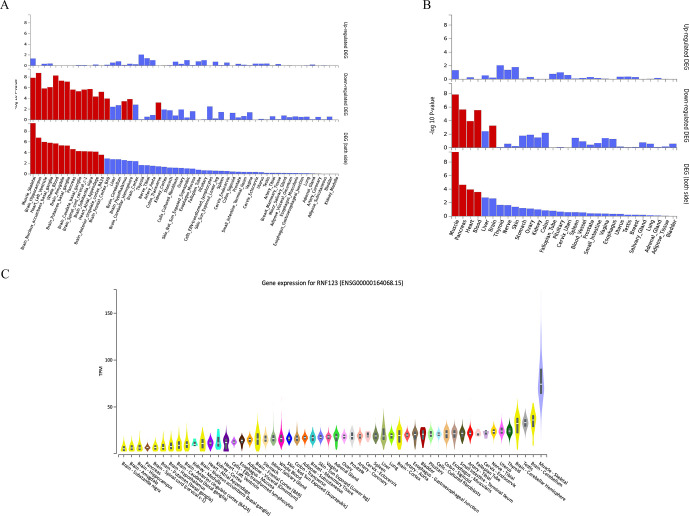
Results: Three genome-wide significant loci were identified (rs1491985, rs10490825, rs165599) residing within the genes Ring Finger Protein 123 (RNF123), ATPase secretory pathway Ca2+transporting 1 (ATP2C1) and catechol-O-methyltransferase (COMT). The RNF123 locus was replicated (meta-analysis p=0.0002), the ATP2C1 locus showed suggestive association (p=0.0227) and the COMT locus was not replicated. Partial genetic correlation between CWP and depressive symptoms, body mass index, age of first birth and years of schooling were identified. Tissue specificity and colocalisation analysis highlight the relevance of skeletal muscle in CWP.

Conclusions: We report a novel association of RNF123 locus and a suggestive association of ATP2C1 locus with CWP. Both loci are consistent with a role of calcium regulation in CWP. The association with COMT, one of the most studied genes in chronic pain field, was not confirmed in the replication analysis.

Keywords: epidemiology; fibromyalgia; genetic; polymorphism.


Conflict of interest statement

Competing interests: YSA is co-owner of Maatschap PolyOmica and PolyKnomics BV, private organisations, providing services, research and development in the field of computational and statistical, quantitative and computational (gen)omics.

Figures

Figure 1
Figure 1
Overview of study design.
Figure 2
Figure 2
Manhattan plot of a genome-wide association analysis of chronic widespread musculoskeletal pain (CWP). Each circle in the plot represents a single nucleotide polymorphism (SNP), which was positioned following genomic build GRCh37. The y-axis shows the corresponding –log10 p values and the x-axis shows chromosome position along with SNPs. The horizontal red dotted line indicates genome-wide significance threshold at p=5.0×10⁻⁸. The horizontal blue dotted line indicates suggestive genome-wide significance threshold at p=5.0×10⁻⁷. Gene labels represent nearest genes to independent SNPs located at loci associated with p<5.0×10⁻⁷.
Figure 3
Figure 3
Regional plots for three independent chronic widespread musculoskeletal pain associated single nucleotide polymorphisms (SNPs). Independent SNPs are coloured in purple. Other coloured circles indicate pairwise linkage disequilibrium (LD). The strength of LD (r2) presented in the upper left corner of each plot.
Figure 4
Figure 4
Forest plot for the association of (A) rs1491985, (B) rs10490825, and (C) rs165599 with chronic widespread musculoskeletal pain. X-axis shows effect size measures are presented as beta value. The red square with horizontal black line represents the cohort-specific effect with a corresponding CI for the single nucleotide polymorphism (SNP) of interest. Size of the square indicates the weight of the study and reflects sample size. The vertical black line indicates ‘line of no effect’. Overall effect is presented as a black diamond. Test statistics for each cohort, meta-analysis and heterogeneity are available on the left-hand side. The rs1491985 and rs10490825 were not present in The English Longitudinal Study of Ageing (ELSA); therefore rs9870858 and rs17329848 were used as proxy SNPs, respectively (online supplemental text).
Figure 5
Figure 5
(A) Manhattan plot of the genome-wide gene-based association analysis, (B) & (C) The circus plot displaying chromatin interactions (Ci) and expression quantitative trait loci (eQTLs) on chromosomes 3 and chromosomes 22, respectively, (D) Venn diagram showing overlap of genes implicated by genome-wide gene-based analysis implemented in MAGMA, positional mapping (Pos Map), chromatin interaction mapping (Ci Map), and expression quantitative trait locus mapping (eQTL Map). (A) The y-axis shows the ─log10 transformed two-tailed p-value of each gene from a linear model and the chromosomal position on the x-axis. The red dotted line indicates the Bonferroni-corrected threshold for genome-wide significance of the gene-based test. (B, C) The most outer layer of the circus plot displaying Manhattan plot with –log10 p-values for chronic widespread musculoskeletal pain associated independent single nucleotide polymorphisms (SNPs). Each SNP is presented with rsID. Linkage disequilibrium (LD) relationship between independent SNPs at the locus and their proxies are indicated with red (r2 > 0.8) and orange (r2 > 0.6). Grey SNPs indicate minimal LD with r2 ≤0.20. The outer circle represents chromosome with genomic risk loci are highlighted in blue. Either Ci- or eQTL mapped genes are displayed on the inner circle. Ci- and eQTL mapped genes are presented in orange or green color, respectively. Genes mapped with both approaches are colored red.
Figure 6
Figure 6
(A) Differentially expressed gene (DEG) plots for chronic widespread musculoskeletal pain (CWP) in 54 tissue types from GTEX v8, (B) DEG plots for CWP in 30 general tissue types from GTEX v8 and (C) Differential expression of RNF123 gene across tissue types from GTEX v8. (A, B) In both plots, the y-axis represents the ─log10 transformed two-tailed p value of the hypergeometric test. Significantly enriched DEG sets (Bonferroni-corrected p value <0.05) are highlighted in red. (C) Y-axis represents transcripts per million (TPM) and x-axis represents the GTEx (V.8) tissues. The figure was adapted from GTEx portal (https://www.gtexportal.org/home/gene/ENSG00000164068).

References

    1. Häuser W, Ablin J, Fitzcharles M-A, et al. . Fibromyalgia. Nat Rev Dis Primers 2015;1:15022. 10.1038/nrdp.2015.22 - DOI - PubMed
    1. Wolfe F, Clauw DJ, Fitzcharles M-A, et al. . 2016 revisions to the 2010/2011 fibromyalgia diagnostic criteria. Semin Arthritis Rheum 2016;46:319–29. 10.1016/j.semarthrit.2016.08.012 - DOI - PubMed
    1. Shipley M. Chronic widespread pain and fibromyalgia syndrome. Medicine 2018;46:252–5. 10.1016/j.mpmed.2018.01.009 - DOI
    1. Fayaz A, Croft P, Langford RM, et al. . Prevalence of chronic pain in the UK: a systematic review and meta-analysis of population studies. BMJ Open 2016;6:e010364. 10.1136/bmjopen-2015-010364 - DOI - PMC - PubMed
    1. Mansfield KE, Sim J, Jordan JL, et al. . A systematic review and meta-analysis of the prevalence of chronic widespread pain in the general population. Pain 2016;157:55–64. 10.1097/j.pain.0000000000000314 - DOI - PMC - PubMed

Publication types

MeSH terms