

HMGA1B/2 transcriptionally activated-POU1F1 facilitates gastric carcinoma metastasis via CXCL12/CXCR4 axis-mediated macrophage polarization
- PMID: 33927188
- PMCID: PMC8084942
- DOI: 10.1038/s41419-021-03703-x
HMGA1B/2 transcriptionally activated-POU1F1 facilitates gastric carcinoma metastasis via CXCL12/CXCR4 axis-mediated macrophage polarization
Abstract
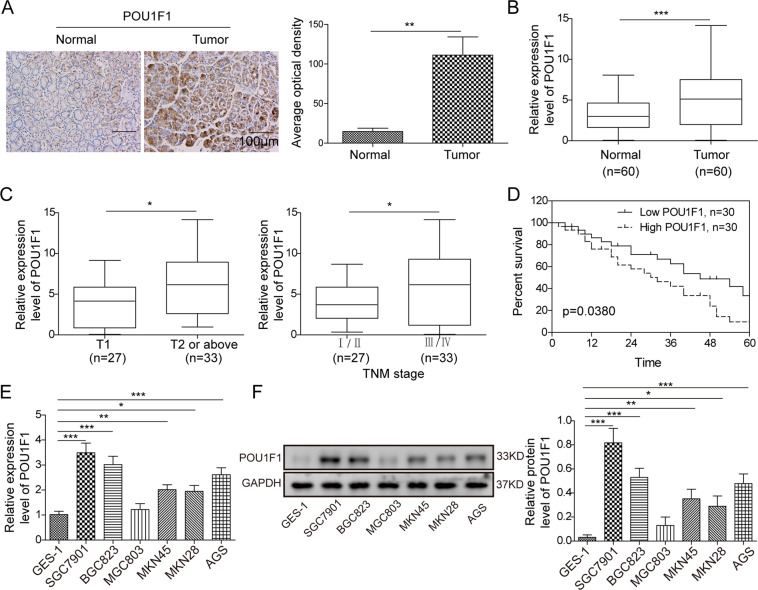
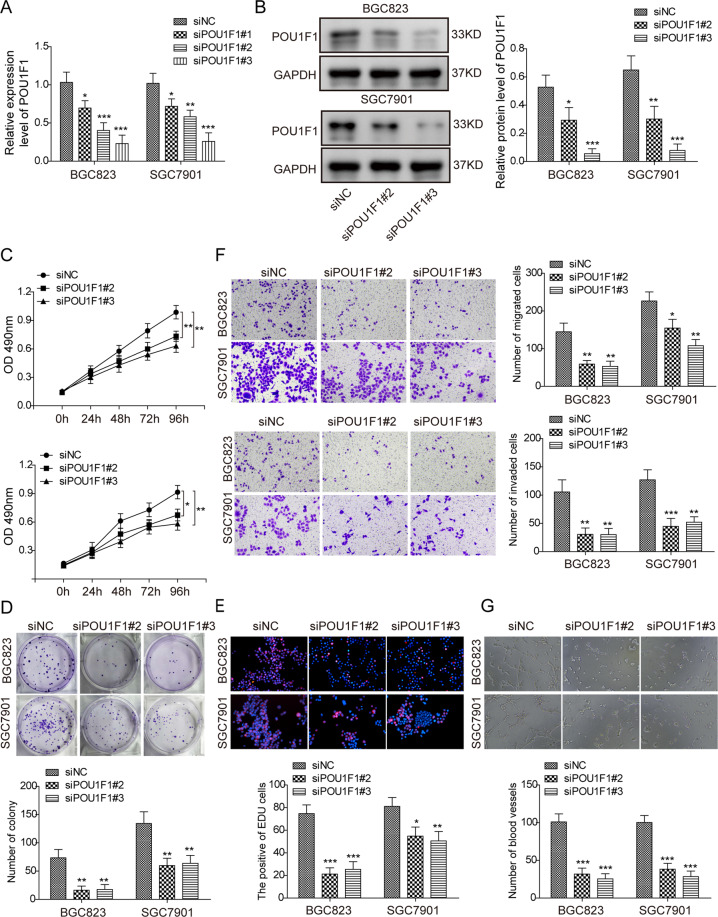
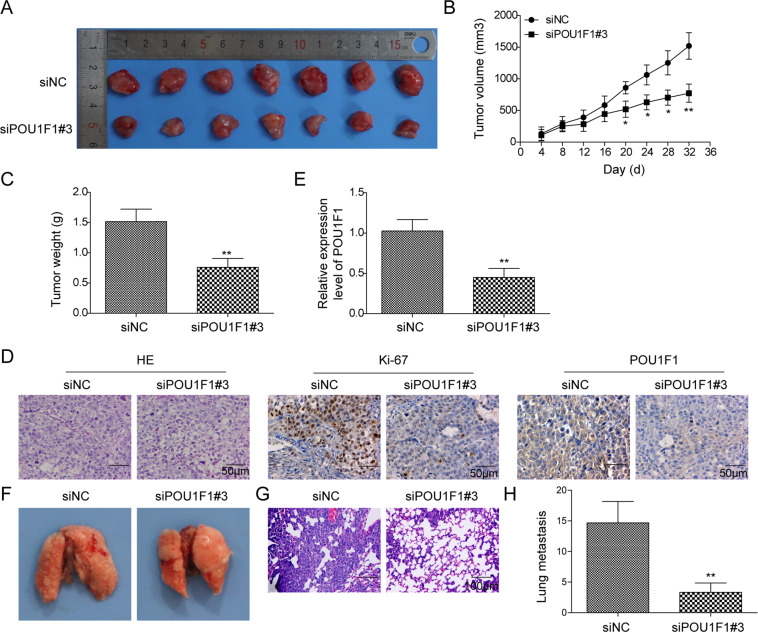
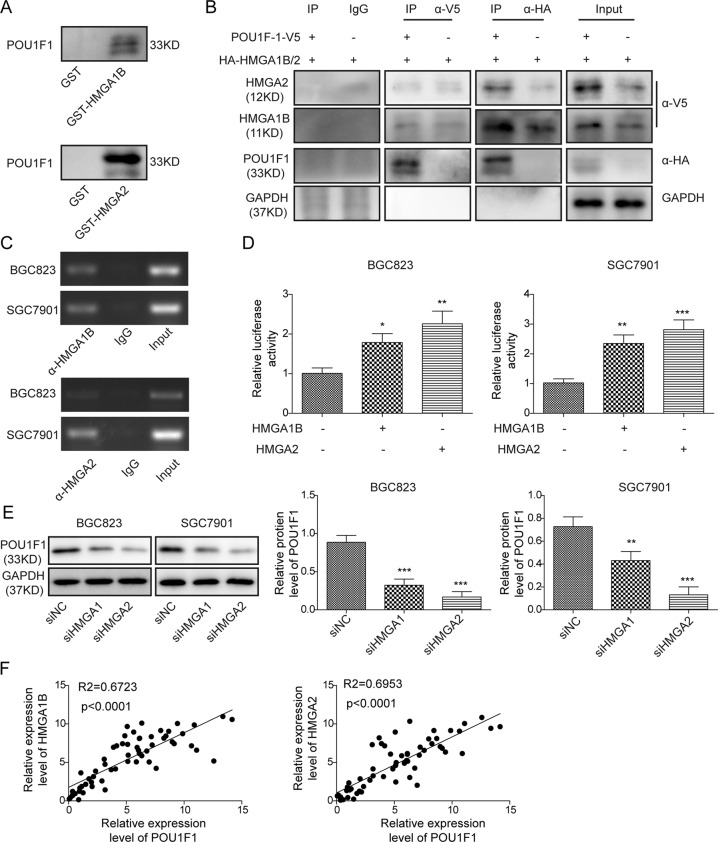
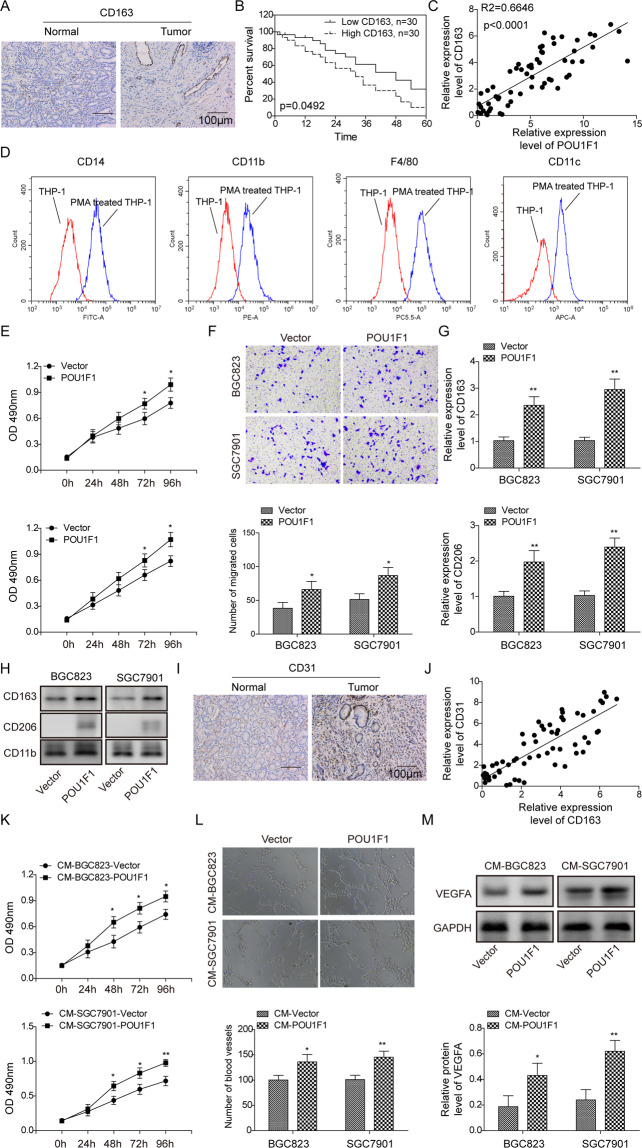
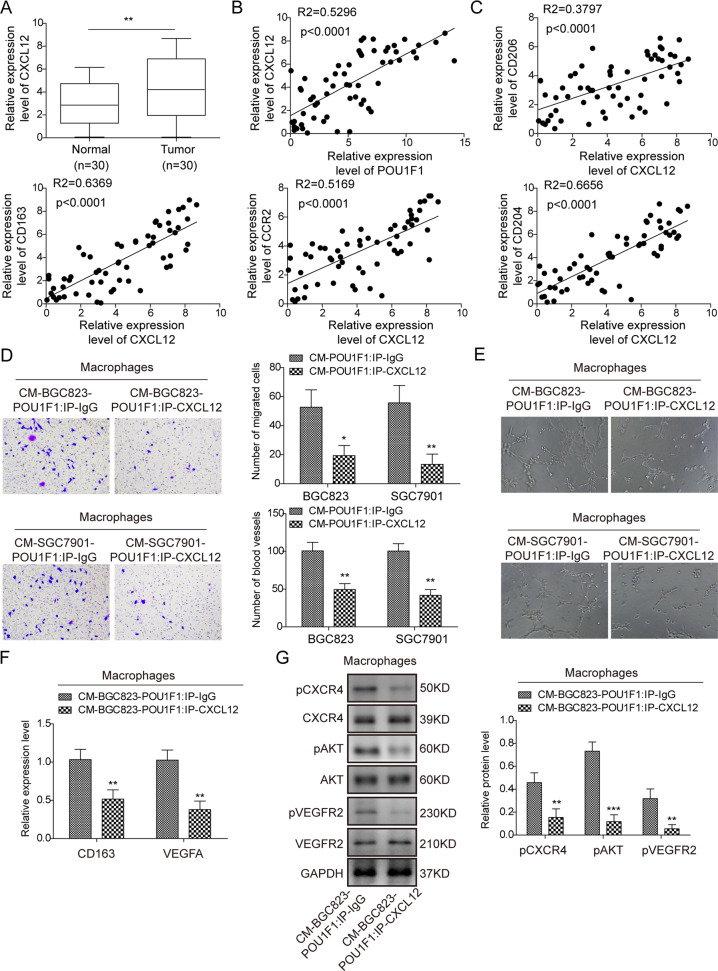
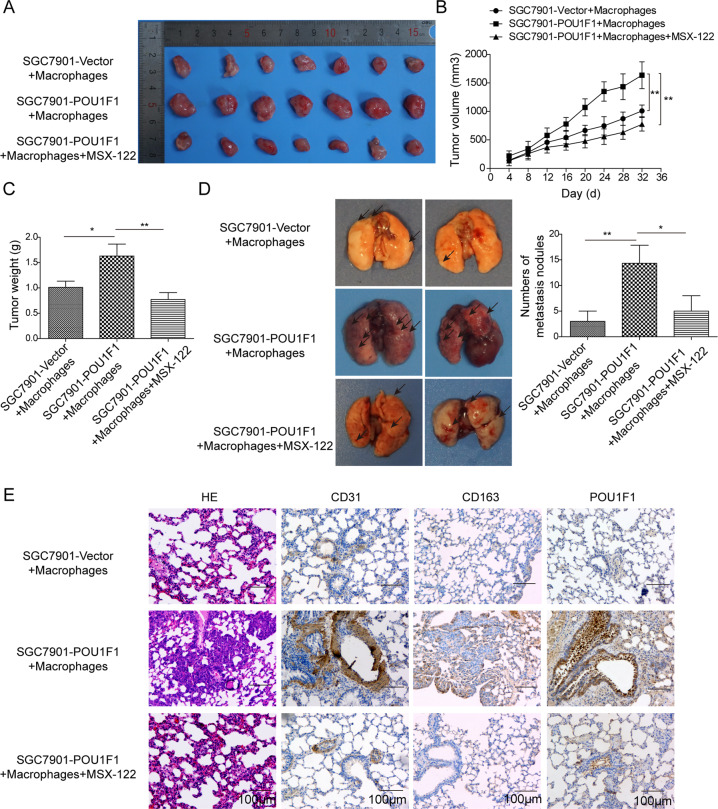
Tumor-associated macrophages (TAMs) in the tumor microenvironment contribute to poor prognosis in gastric cancer (GC). However, the underlying mechanism by which TAMs promote GC progression and metastasis remains elusive. Expression of POU1F1 was detected in 60 matched GC-normal tissue pairs using qRT-PCR and immunohistochemistry (IHC) analysis. The correlation between POU1F1 and the clinical-pathological factors of GC patients were further assessed. Cell proliferation was monitored by CCK-8, colony formation, and 5-Ethynyl-2'-deoxyuridine (EdU) incorporation assays. Cell migration and invasion were assessed by transwell assays. The impact on angiogenesis was evaluated by tube formation assay. Xenograft model was generated to investigate the role of POU1F1 on tumor growth and lung metastasis in vivo. GST pull-down and Co-immunoprecipitation (Co-IP) were used to study the interaction between HMGA1B/2 and POU1F1. Chromatin immunoprecipitation (ChIP) and dual luciferase reporter assays were performed to investigate the transcriptional regulation of POU1F1. Flow cytometry was performed to detect the surface expression of macrophage markers. Upregulated POU1F1 observed both in GC tissues and cell lines was positively correlated with poor prognosis. Knockdown of POU1F1 inhibited cell proliferation, migration, invasion, and angiogenesis in vitro, and suppressed tumor growth in vivo. HMGA1B/2 transcriptionally activated-POU1F1. POU1F1 promoted GC progression via regulating macrophage proliferation, migration, polarization, and angiogenesis in a CXCL12/CXCR4-dependent manner. POU1F1 also promoted GC metastasis in lung by modulating macrophage polarization through CXCL12/CXCR4 axis in vivo. HMGA1B/2-upregulated POU1F1 promoted GC metastasis via regulating macrophage polarization in a CXCL12/CXCR4-dependent manner.
Conflict of interest statement
The authors declare no competing interests.
Figures
Similar articles
-
POU1F1 transcription factor promotes breast cancer metastasis via recruitment and polarization of macrophages.J Pathol. 2019 Nov;249(3):381-394. doi: 10.1002/path.5324. Epub 2019 Aug 27. J Pathol. 2019. PMID: 31292963
-
NR2F1 contributes to cancer cell dormancy, invasion and metastasis of salivary adenoid cystic carcinoma by activating CXCL12/CXCR4 pathway.BMC Cancer. 2019 Jul 29;19(1):743. doi: 10.1186/s12885-019-5925-5. BMC Cancer. 2019. PMID: 31357956 Free PMC article.
-
LncRNA COL1A1-014 is involved in the progression of gastric cancer via regulating CXCL12-CXCR4 axis.Gastric Cancer. 2020 Mar;23(2):260-272. doi: 10.1007/s10120-019-01011-0. Epub 2019 Oct 24. Gastric Cancer. 2020. PMID: 31650323
-
Inhibition of CXCL12/CXCR4 axis as a potential targeted therapy of advanced gastric carcinoma.Cancer Med. 2017 Jun;6(6):1424-1436. doi: 10.1002/cam4.1085. Epub 2017 May 23. Cancer Med. 2017. PMID: 28544785 Free PMC article. Review.
-
The role of the CXCR4/CXCL12 axis and its clinical implications in gastric cancer.Histol Histopathol. 2012 Sep;27(9):1155-61. doi: 10.14670/HH-27.1155. Histol Histopathol. 2012. PMID: 22806902 Review.
Cited by
-
Deciphering the age-dependent changes of pulmonary fibroblasts in mice by single-cell transcriptomics.Front Cell Dev Biol. 2023 Nov 29;11:1287133. doi: 10.3389/fcell.2023.1287133. eCollection 2023. Front Cell Dev Biol. 2023. PMID: 38094618 Free PMC article.
-
Deciphering aging-associated prognosis and heterogeneity in gastric cancer through a machine learning-driven approach.iScience. 2025 Mar 28;28(5):112316. doi: 10.1016/j.isci.2025.112316. eCollection 2025 May 16. iScience. 2025. PMID: 40256325 Free PMC article.
-
Role of chemokines in the crosstalk between tumor and tumor-associated macrophages.Clin Exp Med. 2023 Sep;23(5):1359-1373. doi: 10.1007/s10238-022-00888-z. Epub 2022 Sep 29. Clin Exp Med. 2023. PMID: 36173487 Free PMC article. Review.
-
Clinical significance of the tumor microenvironment on immune tolerance in gastric cancer.Front Immunol. 2025 Feb 14;16:1532605. doi: 10.3389/fimmu.2025.1532605. eCollection 2025. Front Immunol. 2025. PMID: 40028336 Free PMC article. Review.
-
Prognostic significance and multivariate modeling of COL4A family genes and HMGA2 in glioma.Front Pharmacol. 2025 Apr 25;16:1591932. doi: 10.3389/fphar.2025.1591932. eCollection 2025. Front Pharmacol. 2025. PMID: 40351420 Free PMC article.
References
MeSH terms
Substances
LinkOut - more resources
Full Text Sources
Other Literature Sources
Medical
Research Materials
Miscellaneous
