. 2021 Apr 29;11(1):9246.
doi: 10.1038/s41598-021-88687-6.

Calcium carbonate nanoparticles stimulate cancer cell reprogramming to suppress tumor growth and invasion in an organ-on-a-chip system

Affiliations

Calcium carbonate nanoparticles stimulate cancer cell reprogramming to suppress tumor growth and invasion in an organ-on-a-chip system

Sandra F Lam et al. Sci Rep. .

Abstract

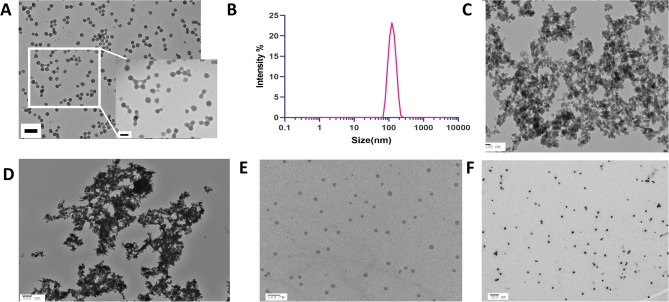
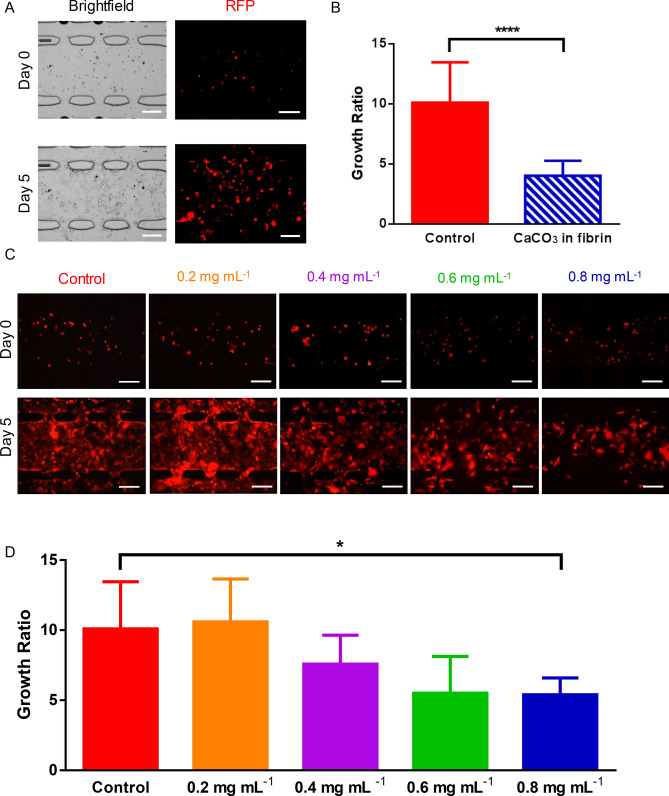
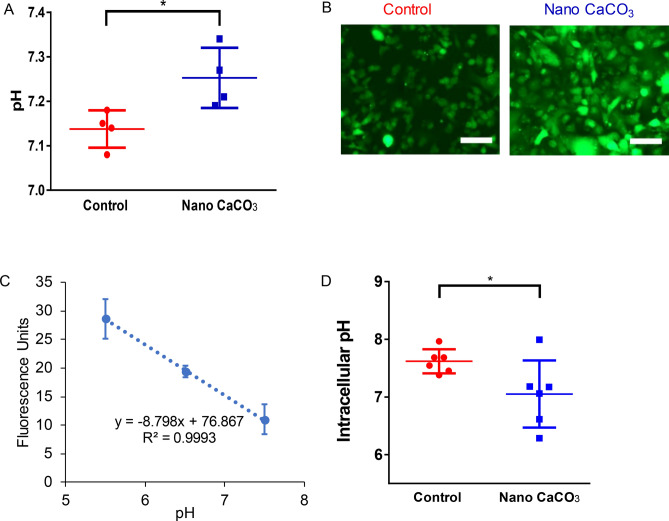
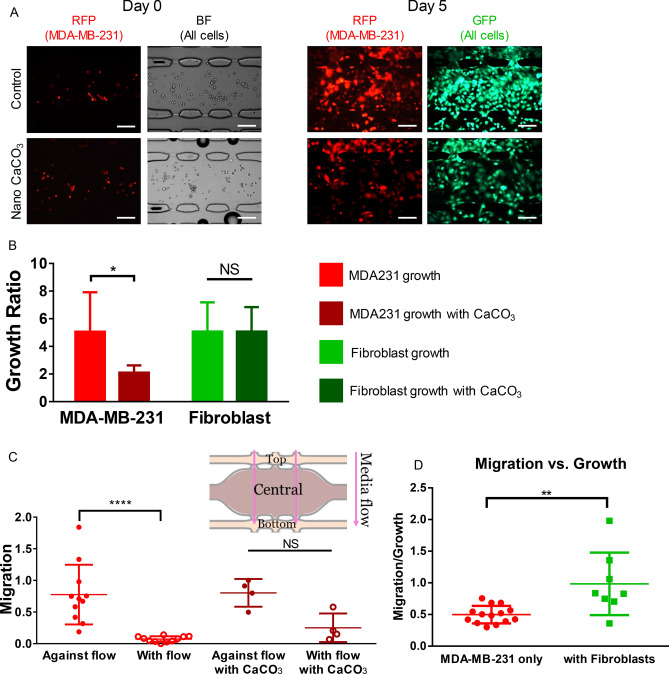
The acidic microenvironment of solid tumors induces the propagation of highly invasive and metastatic phenotypes. However, simulating these conditions in animal models present challenges that confound the effects of pH modulators on tumor progression. To recapitulate the tumor microenvironment and isolate the effect of pH on tumor viability, we developed a bifurcated microfluidic device that supports two different cell environments for direct comparison. RFP-expressing breast cancer cells (MDA-MB-231) were cultured in treatment and control chambers surrounded by fibrin, which received acid-neutralizing CaCO3 nanoparticles (nanoCaCO3) and cell culture media, respectively. Data analysis revealed that nanoCaCO3 buffered the pH within the normal physiological range and inhibited tumor cell proliferation compared to the untreated control (p < 0.05). Co-incubation of cancer cells and fibroblasts, followed by nanoCaCO3 treatment showed that the nanoparticles selectively inhibited the growth of the MDA-MB-231 cells and reduced cellular migration of these cells with no impact on the fibroblasts. Sustainable decrease in the intracellular pH of cancer cells treated with nanoCaCO3 indicates that the extracellular pH induced cellular metabolic reprogramming. These results suggest that the nanoCaCO3 can restrict the aggressiveness of tumor cells without affecting the growth and behavior of the surrounding stromal cells.


Conflict of interest statement

The authors declare no competing interests.

Figures

Figure 1
Figure 1
Device design and setup. (A) Design of the microfluidic device. Cells in fibrin are loaded into the brown chambers. Plain fibrin is loaded in the adjacent chambers to quantify cellular migration. Media is flown through the pink channels to feed the tissue. The flow patterns of the device are illustrated by the arrows. The two upper chambers will receive media with CaCO3 nanoparticles (blue arrows), while the two lower chambers will receive plain media (red arrows). The central chamber is connected to a microfluidic pump to serve as a “waste” stream so the upper and lower chambers can maintain independence from each other. (B) Experimental setup of the microfluidic device. Pipette tips are used to feed the tissue chambers on the outside of the device, while the middle media channel is connected to a microfluidic pump via tubing. (C) Fluid velocity (µm s−1) distributions are shown in the surface map (left). The streamlines of interstitial flow are illustrated with pink lines. Quantification of velocities along the black arrow are shown in the graph to the right. The boxed regions in the graph represent the fluid velocities within the tissue chambers. (D) FITC-dextran flow through the top media channel to show that the fluorescent signal is attenuated towards the lower chambers. This confirms that there is no crosstalk between the upper and lower chambers. Scale bar = 200 µm. (E) Visual confirmation of the presence of CaCO3 nanoparticles. The black punctate marks in the tissue chamber and media lines serve as a visual representation that the CaCO3 nanoparticles are reaching the tissue chamber through the media lines.
Figure 2
Figure 2
CaCO3 nanoparticle characterization. (A) Transmission electron microscope image of nanoCaCO3 dispersed in ethanol before drying the nanoparticles shows spherical particles with the size of 78.6 ± 7.6 nm. Scale bar = 200 nm (main panel); 100 nm (inset). (B) NanoCaCO3 were dispersed in ethanol for dynamic light scattering measurement, showing an average intensity-based size of 120.0 nm ± 29.3 nm. Average number of particles-based size measurement is 101.8 ± 24.7 nm (not shown). (CF) TEM images of nanoCaCO3 after dispersion in distilled water (C), PBS (D), serum (E), and DMEM (F); scale bars = 100 nm for (C) and 500 nm for (DF).
Figure 3
Figure 3
Nano CaCO3 effects on MDA-MB-231 cell growth. (A) Representative images of the MDA-MB-231 cells loaded in fibrin gels. Images of the start (top) and end (bottom) of the experiment with fibrin gels containing 1.6 mg mL−1 concentration of CaCO3 nanoparticles is shown. Scale bar = 200 µm. (B) Embedding CaCO3 nanoparticles inside fibrin. After embedding CaCO3 nanoparticles inside our fibrin gel, the quantification of tumor growth showed significantly more growth under the control conditions. **** p < 0.0001. (C) Representative images of MDA-MB-231 cells expressing RFP grown in varying concentrations of CaCO3 nanoparticles. Images of the tissue chambers right after loading are shown in the top row, and images at the end of the experiment are shown in the bottom row. Scale bar = 200 µm. (D) Quantification of the effects of CaCO3 nanoparticles at varying concentrations. At 0.8 mg mL−1, tumor growth was significantly inhibited compared to the control condition. * p < 0.05.
Figure 4
Figure 4
Nano CaCO3 effects on pH. (A) After the cells were seeded in 24 well plates and received media with or without CaCO3 nanoparticles, the media was collected and a pH probe was used to make measurements. The control group (red) had significantly lower pH than the experimental group (blue). (B) A pHrodo Green AM Intracellular pH Indicator dye was used compare the intracellular pH of the tumor cells with or without CaCO3 nanoparticles. (C) Higher fluorescent intensity indicates lower intracellular pH, and a Calibration Buffer Kit was used to correlate fluorescent intensity with intracellular pH. (D) The average intracellular pH of the MDA-MB-231 cells without nanoparticles was significantly higher than those grown with nanoparticles indicating a more alkaline intracellular pH. Scale bar = 100 µm, * p < 0.05.
Figure 5
Figure 5
CaCO3 nanoparticle effects on varying tissue types. (A) Fluorescent and brightfield microscopy images of the control chambers (top row) and experimental chambers (bottom row) fed with CaCO3 nanoparticles. The left two columns include images taken right after loading of MDA-MB-231 expressing RFP and brightfield images of both cancer and fibroblast cells. The right two columns are images of the MDA-MB-231 cells at the end of the experiment as well as a live stain shown in GFP. Scale bar = 200 µm. (B) Quantification of the growth of MDA-MB-231 and fibroblast cells with and without CaCO3 nanoparticles. The data shows that there was significant inhibition of tumor growth when the nanoparticles were introduced. On the other hand, there was no significant difference between the fibroblasts that were grown with or without nanoparticles. *, p < 0.05; NS, not significant. (C) Quantification of cellular migration with and against the flow of media. Without the presence of nanoparticles, the MDA-MB-231 cells migrate against flow, suggesting more aggressive behavior. In the presence of nanoparticles, there was not a significant difference between migration with or against flow. This suggest that CaCO3 nanoparticles can inhibit the invasive behavior of MDA-MB-231 cells without the nanoparticles. ****, p < 0.0001. (D) MDA-MB-231 cells in the presence of fibroblasts are more migratory than without fibroblasts. To compare migratory vs growth of the MDA-MB-231 cells, we calculated a parameter that divided the cell area in the top and bottom chambers (migration) by the cell area in the middle chamber (growth). Using this parameter, we can see that the MDA-MB-231 cells growth with fibroblasts (red) are significantly more migratory than the devices with only tumor cells (green).

References

    1. Hanahan D, Weinberg RA. Hallmarks of cancer: The next generation. Cell. 2011;144:646. doi: 10.1016/j.cell.2011.02.013. - DOI - PubMed
    1. Kallinowski F, Vaupel P. pH distributions in spontaneous and isotransplanted rat tumours. Br. J. Cancer. 1988;58:314. doi: 10.1038/bjc.1988.210. - DOI - PMC - PubMed
    1. Kato Y, Ozawa S, Miyamoto C, Maehata Y, Suzuki A, Maeda T, Baba Y. Acidic extracellular microenvironment and cancer. Cancer Cell Int. 2013;13:89. doi: 10.1186/1475-2867-13-89. - DOI - PMC - PubMed
    1. Stubbs M, McSheehy PM, Griffiths JR, Bashford CL. Causes and consequences of tumour acidity and implications for treatment. Mol. Med. Today. 2000;6:15. doi: 10.1016/S1357-4310(99)01615-9. - DOI - PubMed
    1. Vaupel P, Kallinowski F, Okunieff P. Blood flow, oxygen and nutrient supply, and metabolic microenvironment of human tumors: A review. Cancer Res. 1989;49:6449. - PubMed

Publication types