. 2021 Apr 29;4(1):470.
doi: 10.1038/s42003-021-01974-w.

Childhood socioeconomic status is associated with psychometric intelligence and microstructural brain development

Affiliations

Childhood socioeconomic status is associated with psychometric intelligence and microstructural brain development

Hikaru Takeuchi et al. Commun Biol. .

Abstract

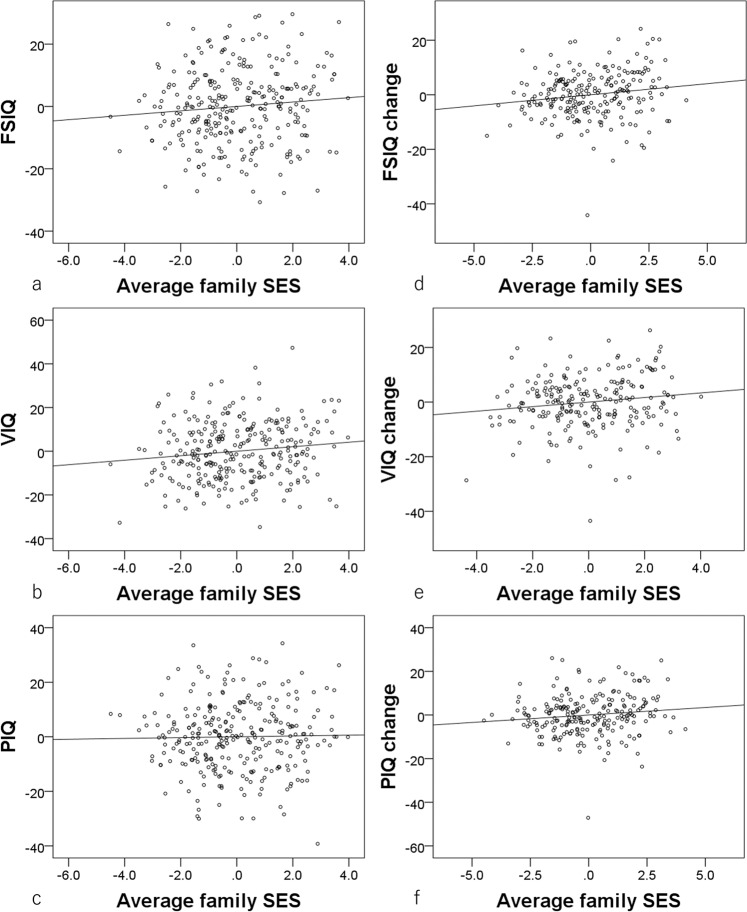
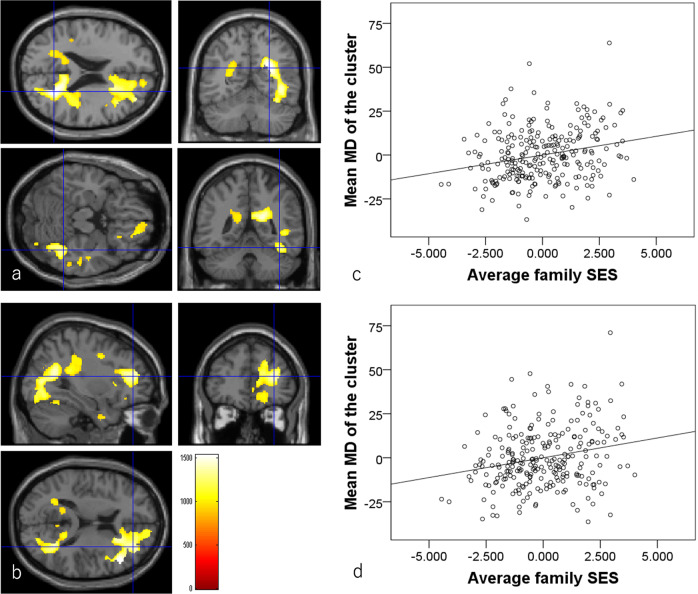
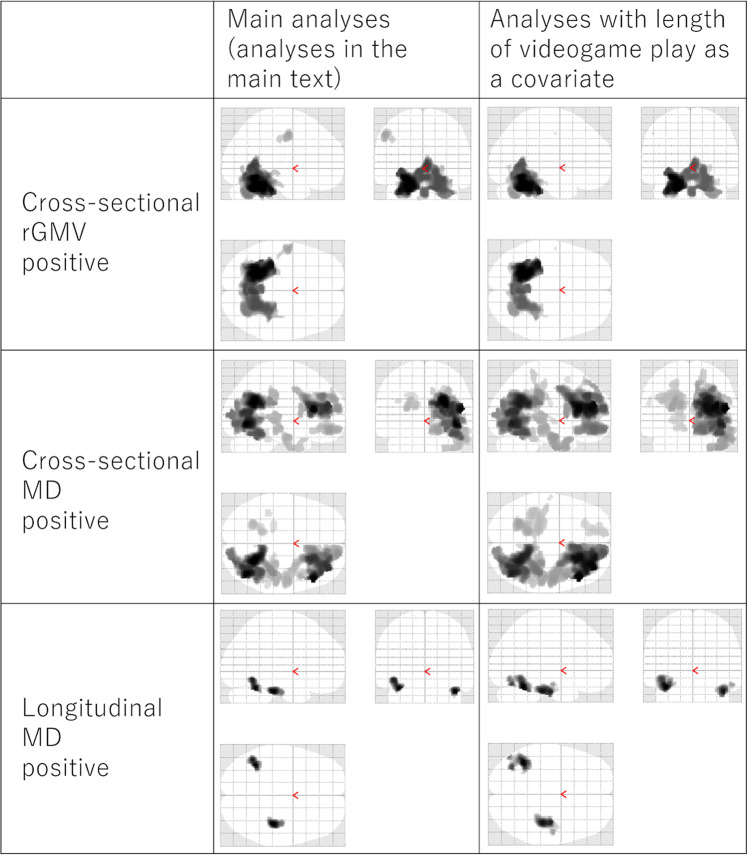
Childhood socioeconomic status is robustly associated with various children's cognitive factors and neural mechanisms. Here we show the association of childhood socioeconomic status with psychometric intelligence and mean diffusivity and fractional anisotropy using diffusion tensor imaging at the baseline experiment (N = 285) and longitudinal changes in these metrics after 3.0 ± 0.3 years (N = 223) in a large sample of normal Japanese children (mean age = 11.2 ± 3.1 years). After correcting for confounding factors, cross-sectional and longitudinal analyses show that higher childhood socioeconomic status is associated with greater baseline and baseline to follow-up increase of psychometric intelligence and mean diffusivity in areas around the bilateral fusiform gyrus. These results demonstrate that higher socioeconomic status is associated with higher psychometric intelligence measures and altered microstructural properties in the fusiform gyrus which plays a key role in reading and letter recognition and further augmentation of such tendencies during development. Definitive conclusions regarding the causality of these relationships requires intervention and physiological studies. However, the current findings should be considered when developing and revising policies regarding education.


Conflict of interest statement

The authors declare no competing interests.

Figures

Fig. 1
Fig. 1. Distributions of the key variables of the study.
Histograms showing (a) age, (b) FSIQ, (c) family income, (d) average parents’ education length, and (e) the composite childhood SES score of boys and girls in the sample.
Fig. 2
Fig. 2. Associations between childhood SES and IQ measures, as well as changes across time.
ac Residual plots with trend lines depicting the correlations between residuals in multiple regression analyses with (a) FSIQ (significant, N = 284), (b) VIQ (significant, N = 284), and (c) PIQ (insignificant, N = 285) at baseline as a dependent variable, and childhood SES at baseline and other confounding factors as independent variables. df Residual plots with trend lines depicting the correlations between residuals in multiple regression analyses with baseline to follow-up experiment changes in (d) FSIQ (significant, N = 225), (e) VIQ (significant, N = 225), and (f) PIQ (insignificant, N = 225) as the dependent variables and childhood SES at baseline and other confounding factors as independent variables.
Fig. 3
Fig. 3. Associations between greater higher childhood SES and rGMV in cross-sectional analyses (N = 285).
The results shown were obtained using a TFCE of P < 0.05 based on 5000 permutations. The results were corrected at the whole brain level. Significantly associated regions were overlaid on a “single subject” T1 image. The color represents the strength of the TFCE value. Positive associations between rGMV and childhood SES. Significant associations were observed in the anatomical cluster that primarily spread across the bilateral cerebellum, fusiform gyrus, lingual gyrus, precuneus, parahippocampal gyrus, and calcarine cortex (a) and in the anatomical cluster that primarily spread across the left pre- and post-central gyrus (b). c, d Partial residual plots with trend lines depicting associations between residuals in the multiple regression analyses. The mean rGMV from the significant clusters shown in (a) and (b) respectively were used as the dependent variables and childhood SES was the independent variable.
Fig. 4
Fig. 4. Associations between higher childhood SES and MD in cross-sectional analyses (N = 253). The results shown were obtained using a TFCE of P < 0.05 based on 5000 permutations.
The results were corrected at the whole-brain level. Significantly associated regions were overlaid on a “single subject” T1 image. The color represents the strength of the TFCE value. Positive associations between MD and childhood SES. Significant associations were observed in the anatomical cluster that primarily spread across the right fusiform gyrus and surrounding areas (a) and in the anatomical cluster among the prefrontal cortex, striatum, anterior cingulate gray and white matter areas, and related regions (b). c, d Partial residual plots with trend lines depicting associations between residuals in the multiple regression analyses. The mean MD from the significant clusters shown in (a) and (b) respectively were used as the dependent variables and childhood SES was the independent variable.
Fig. 5
Fig. 5. Associations between childhood SES measures and brain structures.
The figures in the left, middle, and right columns represent the associations of average z-scores for family income and parents’ education length (left), family income alone (middle), and parents’ education length alone (right), respectively. The figures in the upper, middle, and lower lines represent positive childhood SES associations with rGMV in the cross-sectional analyses (upper, N = 285), MD in cross-sectional analyses (middle, N = 253), and MD in longitudinal analyses (lower, N = 200). The results shown were obtained using an uncorrected threshold of P < 0.005. Associated regions are superimposed on a glass brain image from SPM. Associations shared by family income, parents’ education length, and the average z-scores were observed.
Fig. 6
Fig. 6. Associations between greater baseline to follow-up experimental MD changes and higher childhood SES in the longitudinal analysis (N = 200).
a, b Areas of significant associations between greater MD change and higher childhood SES. Results are shown using a threshold of P < 0.05 corrected for multiple comparisons in cluster size tests, with a voxel-level cluster determining threshold of P < 0.05 (corrected for FDR). Results were corrected at the whole-brain level. Regions with significant correlations were overlaid on a “single participant” T1 image. The color represents the strength of the T value. Significant associations were observed in the anatomical cluster that primarily spread around the bilateral fusiform gyrus. c, d Partial residual plots with trend lines depicting associations between residuals in the multiple regression analyses. The mean MD from the significant clusters shown in (a) and (b) respectively were used as the dependent variables and childhood SES was the independent variable. Note as described in Methods, when the baseline value is adjusted in the multiple regression analyses, whether baseline to follow-up experimental value changes are used or follow-up experimental values are used as dependent variables, the p and t values will be the same. And since in this analysis, baseline to follow-up experimental time interval are adjusted, the displayed plots are not affected by the time interval.
Fig. 7
Fig. 7. Associations between childhood SES and brain structures.
The figures in the left, middle, and right columns represent the average z-scores for associations between family income and parents’ education with MD (left), AD (middle), and RD (right), respectively. The figures in the upper, middle, and lower rows represent positive childhood SES associations with diffusivity measurements in cross-sectional analyses (upper, N = 253) and longitudinal analyses (lower, N = 200). The results shown were obtained using an uncorrected threshold of p < 0.005. Associated regions are superimposed on a glass brain image from SPM. Similar associations were obtained by analysis of MD, AD, and RD.
Fig. 8
Fig. 8. Comparisons of the results of imaging analyses in the main analyses and those that included length of videogame play as an additional covariate.
The figures in the left and right columns represent the results of imaging analyses in the main analyses and those that included the length of videogame play as an additional covariate, respectively. The figures in the upper, middle, and lower rows represent positive childhood SES associations with rGMV in cross-sectional analyses (upper, left: N = 285, right: N = 278), MD changes in cross-sectional analyses (middle: N = 253, right: N = 247), and MD changes in longitudinal analyses (lower middle: N = 200, right: N = 194). The results shown were obtained using a TFCE of p < 0.05 based on 5,000 permutations in cross-sectional analyses (upper and middle rows). Results are shown using a threshold of p < 0.05 corrected for multiple comparisons in cluster size tests, with a voxel-level cluster-determining threshold of p < 0.05 (corrected for FDR) in longitudinal analyses (lower row). Associated regions are superimposed on a glass brain image from SPM. Similar associations were obtained by two types of analyses.
Fig. 9
Fig. 9. Diffusion images.
A scheme of the preprocessing procedure of diffusion images.

References

    1. Noble KG, McCandliss BD, Farah MJ. Socioeconomic gradients predict individual differences in neurocognitive abilities. Dev. Sci. 2007;10:464–480. - PubMed
    1. Evans GW, Schamberg MA. Childhood poverty, chronic stress, and adult working memory. Proc. Natl Acad. Sci. 2009;106:6545–6549. - PMC - PubMed
    1. Kim P, et al. Effects of childhood poverty and chronic stress on emotion regulatory brain function in adulthood. Proc. Natl Acad. Sci. 2013;110:18442–18447. - PMC - PubMed
    1. Hanson JL, Chandra A, Wolfe BL, Pollak SD. Association between income and the hippocampus. PLoS ONE. 2011;6:e18712. - PMC - PubMed
    1. Ursache A, Noble KG. Neurocognitive development in socioeconomic context: Multiple mechanisms and implications for measuring socioeconomic status. Psychophysiology. 2016;53:71–82. - PMC - PubMed

Publication types

LinkOut - more resources