. 2021 Apr 29;11(1):9319.
doi: 10.1038/s41598-021-88895-0.

Inducible knockout of Clec16a in mice results in sensory neurodegeneration

Affiliations

Inducible knockout of Clec16a in mice results in sensory neurodegeneration

Heather S Hain et al. Sci Rep. .

Abstract

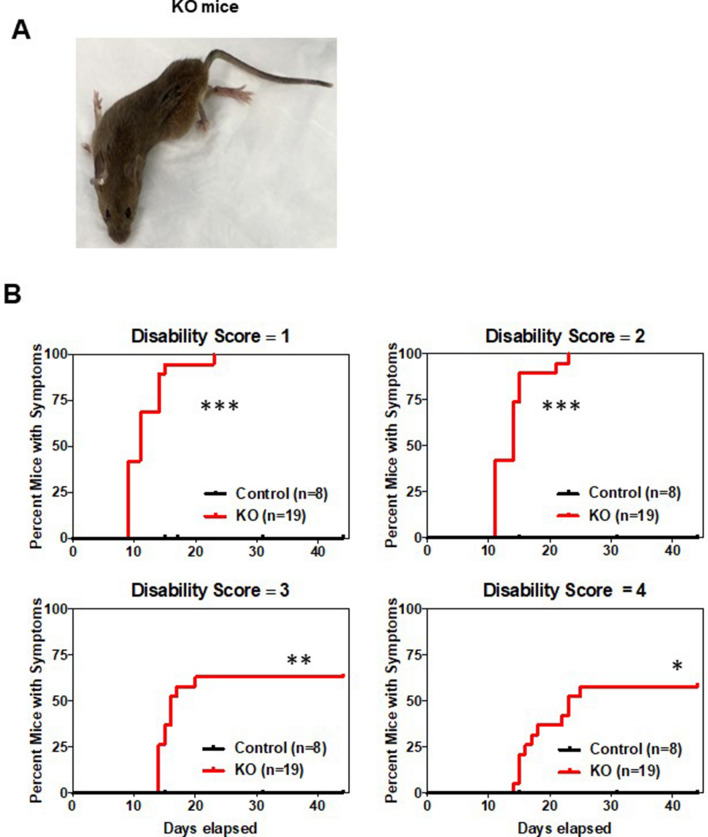
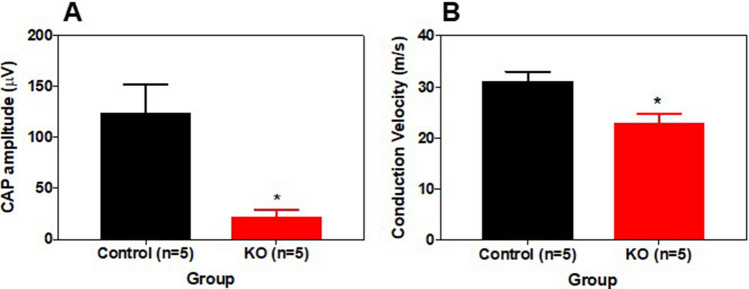
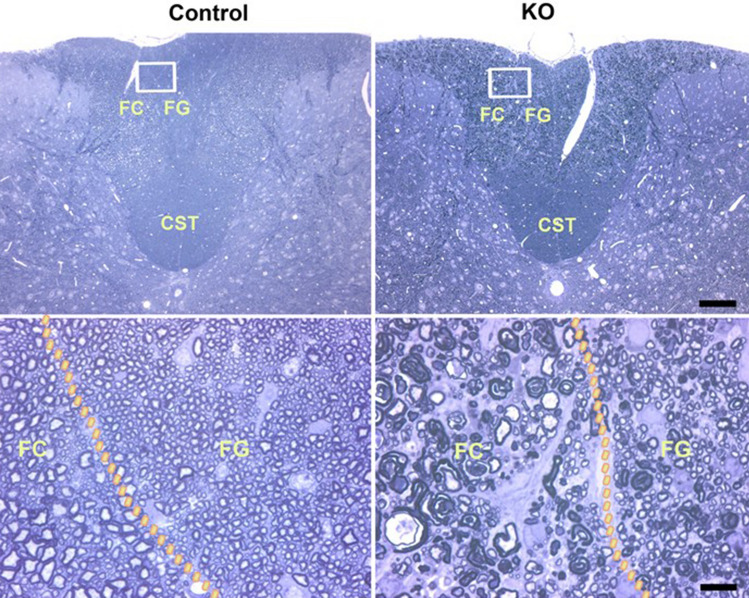
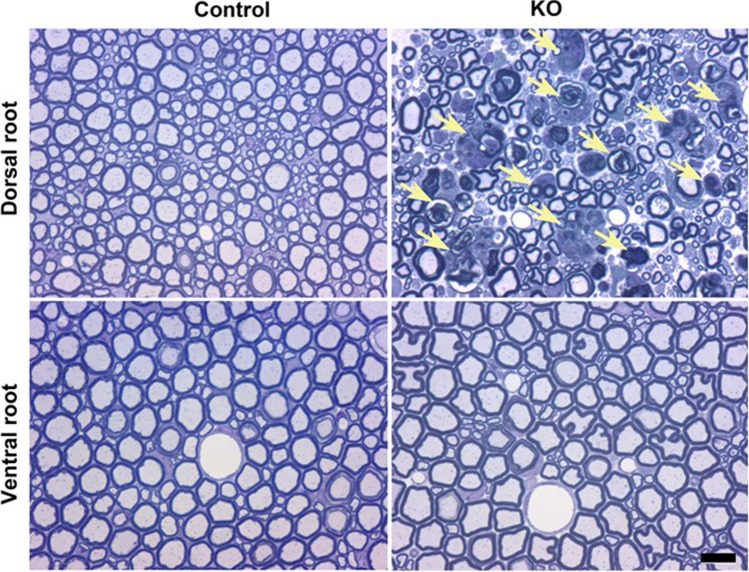
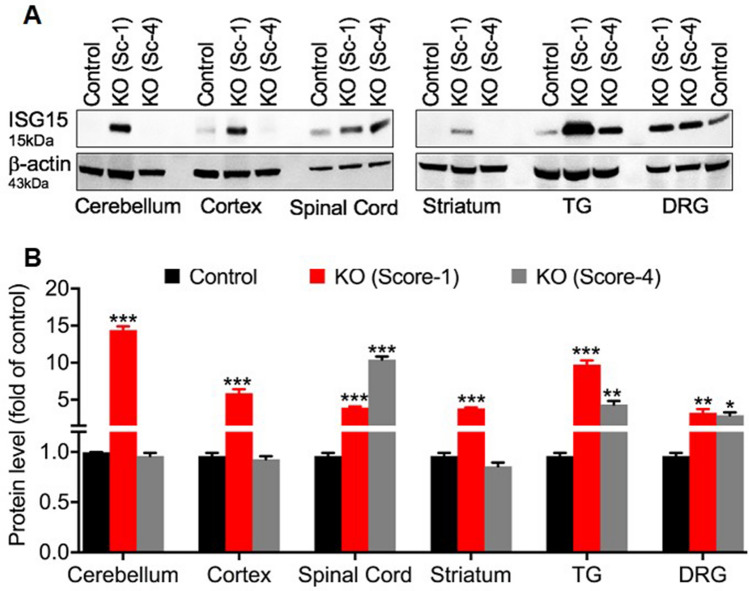
CLEC16A has been shown to play a role in autophagy/mitophagy processes. Additionally, genetic variants in CLEC16A have been implicated in multiple autoimmune diseases. We generated an inducible whole-body knockout, Clec16aΔUBC mice, to investigate the loss of function of CLEC16A. The mice exhibited a neuronal phenotype including tremors and impaired gait that rapidly progressed to dystonic postures. Nerve conduction studies and pathological analysis revealed loss of sensory axons that are associated with this phenotype. Activated microglia and astrocytes were found in regions of the CNS. Several mitochondrial-related proteins were up- or down-regulated. Upregulation of interferon stimulated gene 15 (IGS15) were observed in neuronal tissues. CLEC16A expression inversely related to IGS15 expression. ISG15 may be the link between CLEC16A and downstream autoimmune, inflammatory processes. Our results demonstrate that a whole-body, inducible knockout of Clec16a in mice results in an inflammatory neurodegenerative phenotype resembling spinocerebellar ataxia.


Conflict of interest statement

The authors declare no competing interests.

Figures

Figure 1
Figure 1
Clec16aΔUBC (whole-body, inducible knockout) mice exhibit neurological disability. (A) Image illustrating dystonic posturing in a representative ubiquitous, inducible KO (Clec16aΔUBC) mouse around 15 days post induction. (B) Timeline to onset of disability (scores 1–4) in a cohort of control/Clec16aloxP/loxP and KO/Clec16aΔUBC mice after treating P73–79 mice with tamoxifen for 4 successive days. Number of mice/group indicated on each graph; both sexes were used. *P < 0.05, **P < 0.01, ***P < 0.001 (Control vs. KO) for each disability score as analyzed by the Mantel–Cox test for survival curves.
Figure 2
Figure 2
Reduced caudal nerve amplitude and conduction velocity in Clec16aΔUBC mice. The graphs represent mean ± SEM of (A) compound action potential (CAP) and (B) conduction velocity in the caudal/tail nerves of a cohort of KO/Clec16aΔUBC mice that reached a disability scale of 4, 25 days after initiating tamoxifen treatment, and a cohort of control/Clec16aloxP/loxP mice. Number of mice/group indicated on each graph; both sexes were used. *P < 0.05, Student’s t test.
Figure 3
Figure 3
Activated microglia and astrogliosis in the spinal cords, particularly dorsal columns, of Clec16aΔUBC mice. (AC) Immunofluorescence images of the spinal cords from control/Clec16aloxP/loxP mice and KO/Clec16aΔUBC mice with severe disability and quantification of positive cell labelling. (A) Spinal cord sections were labeled with antibody to IBA1 (red), which labels microglia. (B) Spinal cord sections were labeled with antibody to CD68 (red) which labels activated microglia. (C) Spinal cord sections were labeled with antibody to GFAP (red), which labels astrocytes. For all, the number of positive labeled cells per spinal cord section was counted and divided by the area of the section in three sections from three mice per category and normalized to control. DAPI (blue) labels nuclei. Scale bars = 200 μm. *P < 0.05, ***P < 0.001, Student’s t test.
Figure 4
Figure 4
Degenerating sensory axons in the dorsal columns of Clec16aΔUBC mice. These are representative images of semi-thin sections of the lumbar spinal cord from control/Clec16aloxP/loxP and KO/Clec16aΔUBC mice with severe disability (score 4), as indicated. The upper panels show the locations of the corticospinal tract (CST), fasciculus gracilis (FG), and fasciculus cuneatus (FC). The lower panels correspond to the rectangular regions depicted in the upper panels, and show many degenerating myelin sheaths in the FG and FG (the boundaries of which are shown by the dotted curves) in the KO/Clec16aΔUBC sample. Scale bar = 100 μm upper panel, 10 μm lower panel.
Figure 5
Figure 5
Selective degeneration of sensory and not motor axons in Clec16aΔUBC mice. These are images of semi-thin sections from the dorsal and ventral roots from control/Clec16aloxP/loxP and KO/Clec16aΔUBC with severe disability (score 4) mice, as indicated. Degenerating myelinated axons in nerves are only found in the dorsal roots from KO/Clec16aΔUBC mice. Scale bar = 10 microns.
Figure 6
Figure 6
Abnormal vacuoles and mitochondria in Clec16aΔUBC neurons. These are electron micrographs of sensory (A-F) and motor (G&H) neurons from KO/Clec16aΔUBC with severe disability (score 4; AD, G) and control/Clec16aloxP/loxP (E,F,H) mice. In panel (A), there are five sensory neurons, three of which (1, 2, and 4) contain cytoplasmic clusters of clear vesicles; the area enclosed by the rectangle is enlarged in panel (B). The arrows in panel (B) mark two examples of a vesicle that protrudes into an adjacent vesicle; the arrowheads mark three examples in which the origin of the protrusion is not evident in the plane of section. Panel (C) shows another sensory neuron that contains abnormal mitochondria labeled in panel (D) (asterisks), which is an enlargement of the area shown in the rectangle. Panel (E) shows a sensory neuron from a control/Clec16aloxP/loxP mouse; the area enclosed by the rectangle is enlarged in panel (F), and shows a Golgi apparatus (g) and normal appearing mitochondria (asterisks). Panels (G) and (H) show portions of cervical motor neurons from a KO/Clec16aΔUBC and a control/Clec16aloxP/loxP mouse, respectively. Note the clusters of clear vesicles in the KO/Clec16aΔUBC motor neuron, and the normal appearing Golgi apparatus (g) in the control/Clec16aloxP/loxP neuron. Scale bars, 2 μm (A,C,E) and 600 nm (B,D,H).
Figure 7
Figure 7
ISG15 expression in neuronal tissues of Clec16aloxP/loxP and Clec16aΔUBC mice. (A) Representative western blot from cerebellum, cortex, spinal cord, striatum, TG and DRG lysates of control/Clec16aloxP/loxP and KO/Clec16aΔUBC mice depicting expression levels of ISG15. Membranes were striped and re-probed for β-actin as a loading control. Image is cropped from the full membrane image; the full membrane image can be found in the Supplemental Figure 12. (B) Quantitation graph depicting expression levels of ISG15. Data expressed as mean ± SE of three independent repeats of two mice each. *P < 0.05, ***P < 0.001 (Control vs. KO-Score 1), ##P < 0.01 (Control vs. KO-Score 4), Student’s t test.

Similar articles

Cited by

References

    1. Redmann V, et al. Clec16a is critical for autolysosome function and Purkinje cell survival. Sci. Rep. 2016;6:23326. doi: 10.1038/srep23326. - DOI - PMC - PubMed
    1. Schuster C, et al. The autoimmunity-associated gene CLEC16A modulates thymic epithelial cell autophagy and alters T cell selection. Immunity. 2015;42:942–952. doi: 10.1016/j.immuni.2015.04.011. - DOI - PMC - PubMed
    1. Tam RC, et al. Human CLEC16A regulates autophagy through modulating mTOR activity. Exp. Cell Res. 2017;352:304–312. doi: 10.1016/j.yexcr.2017.02.017. - DOI - PubMed
    1. Kim S, Naylor SA, DiAntonio A. Drosophila Golgi membrane protein Ema promotes autophagosomal growth and function. Proc. Natl. Acad. Sci. U.S.A. 2012;109:E1072–E1081. doi: 10.1073/pnas.1120320109. - DOI - PMC - PubMed
    1. Pearson G, et al. Clec16a, Nrdp1, and USP8 form a ubiquitin-dependent tripartite complex that regulates beta-cell mitophagy. Diabetes. 2018;67:265–277. doi: 10.2337/db17-0321. - DOI - PMC - PubMed

Publication types