. 2021 Aug;17(8):856-864.
doi: 10.1038/s41589-021-00785-8. Epub 2021 Apr 29.

ABHD17 regulation of plasma membrane palmitoylation and N-Ras-dependent cancer growth

Affiliations

ABHD17 regulation of plasma membrane palmitoylation and N-Ras-dependent cancer growth

Jarrett R Remsberg et al. Nat Chem Biol. 2021 Aug.

Abstract

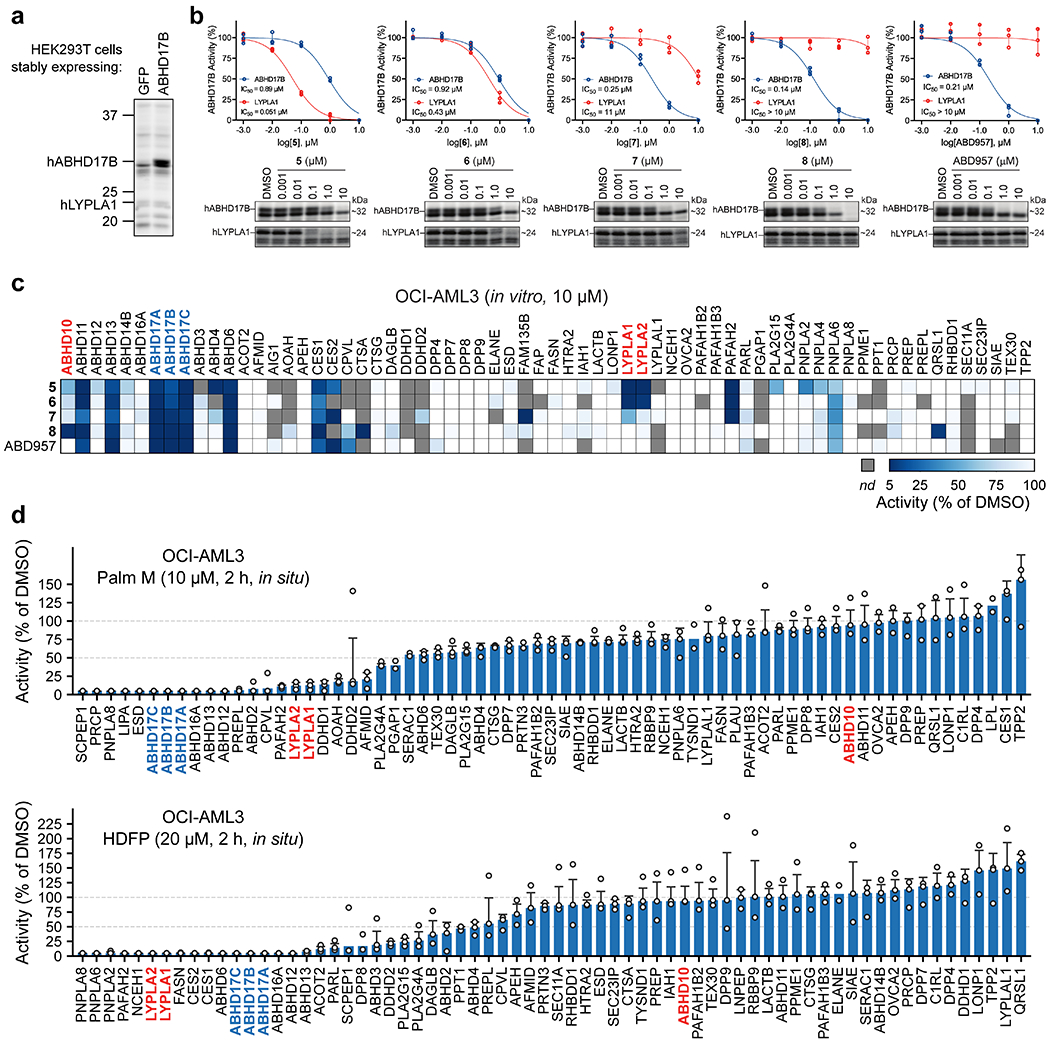
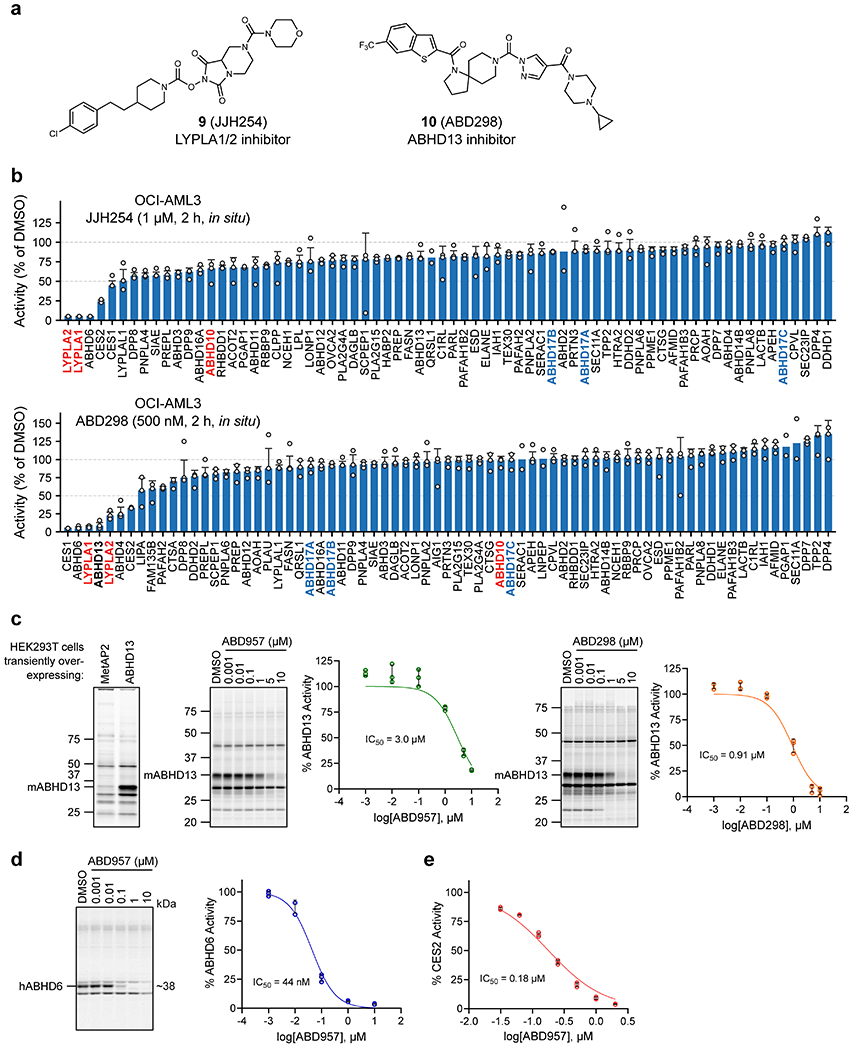
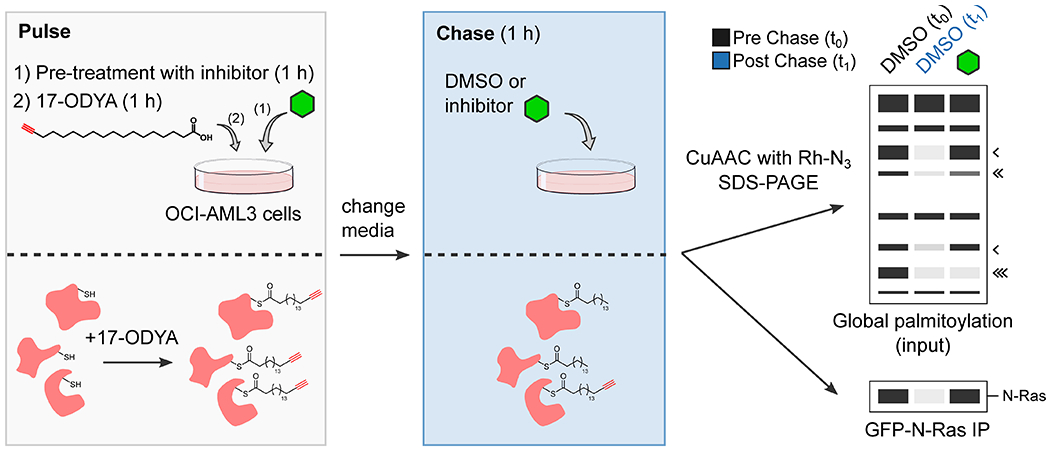
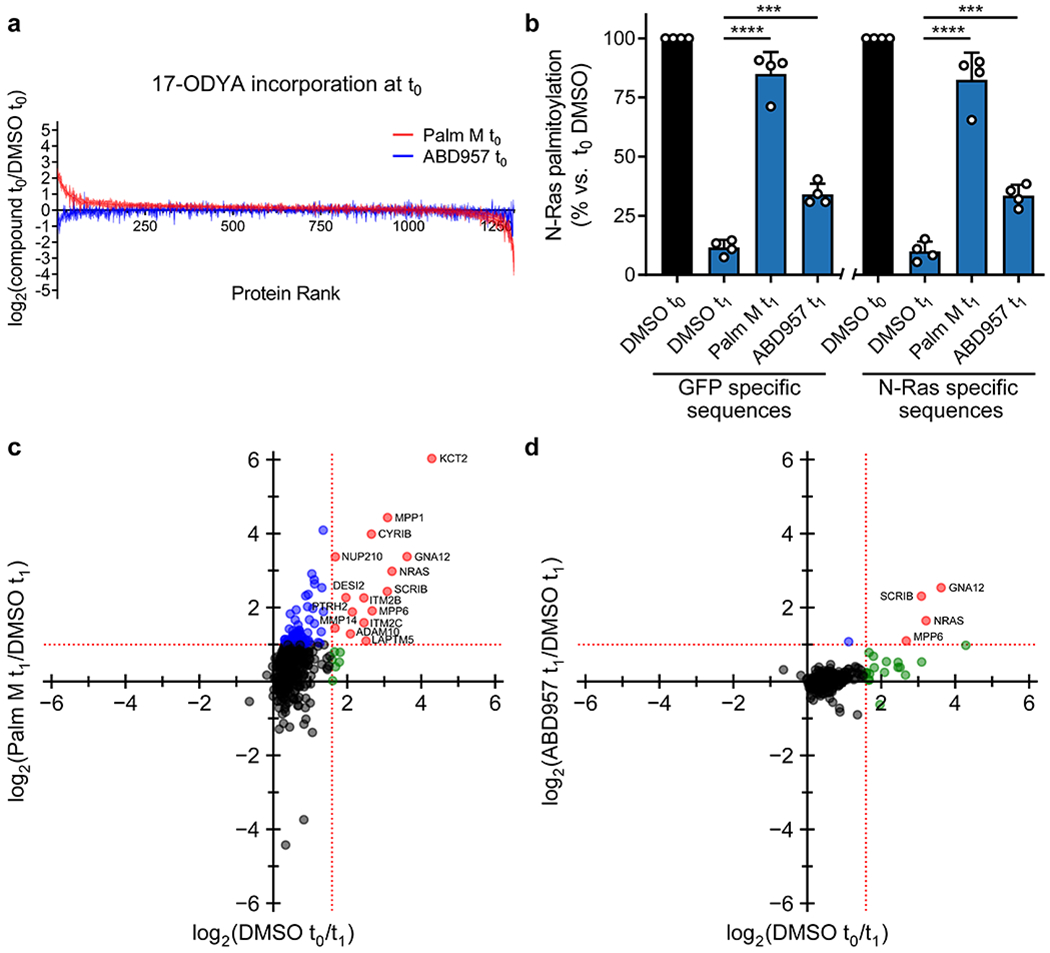
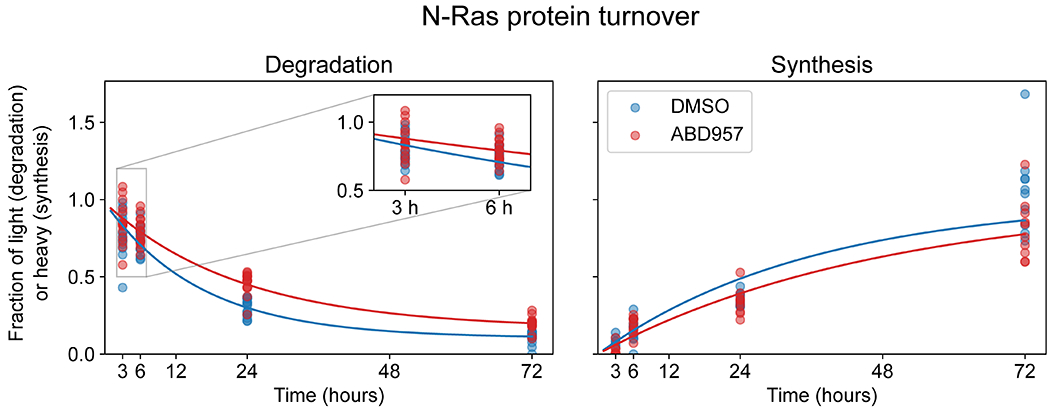
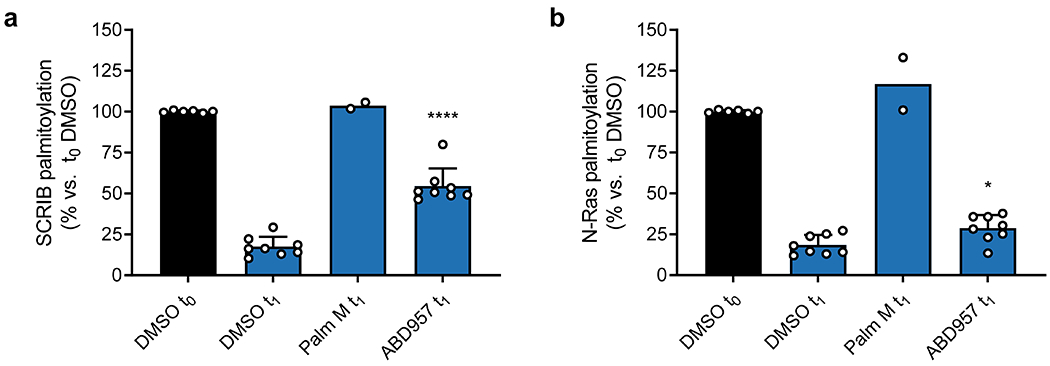
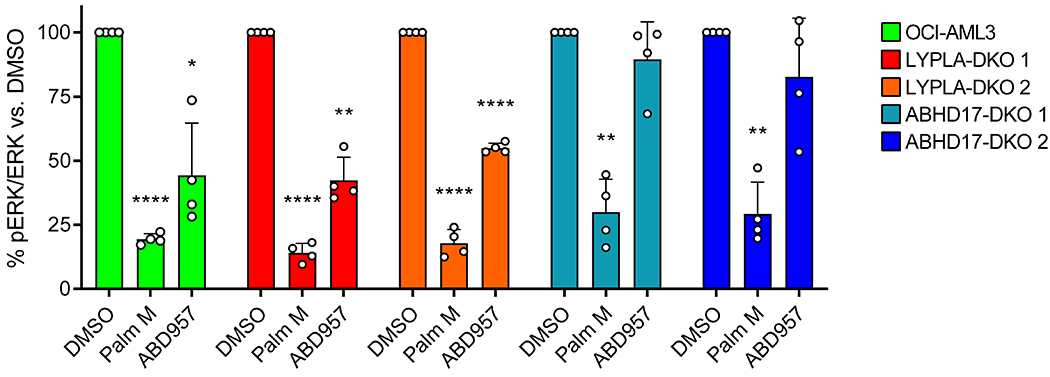
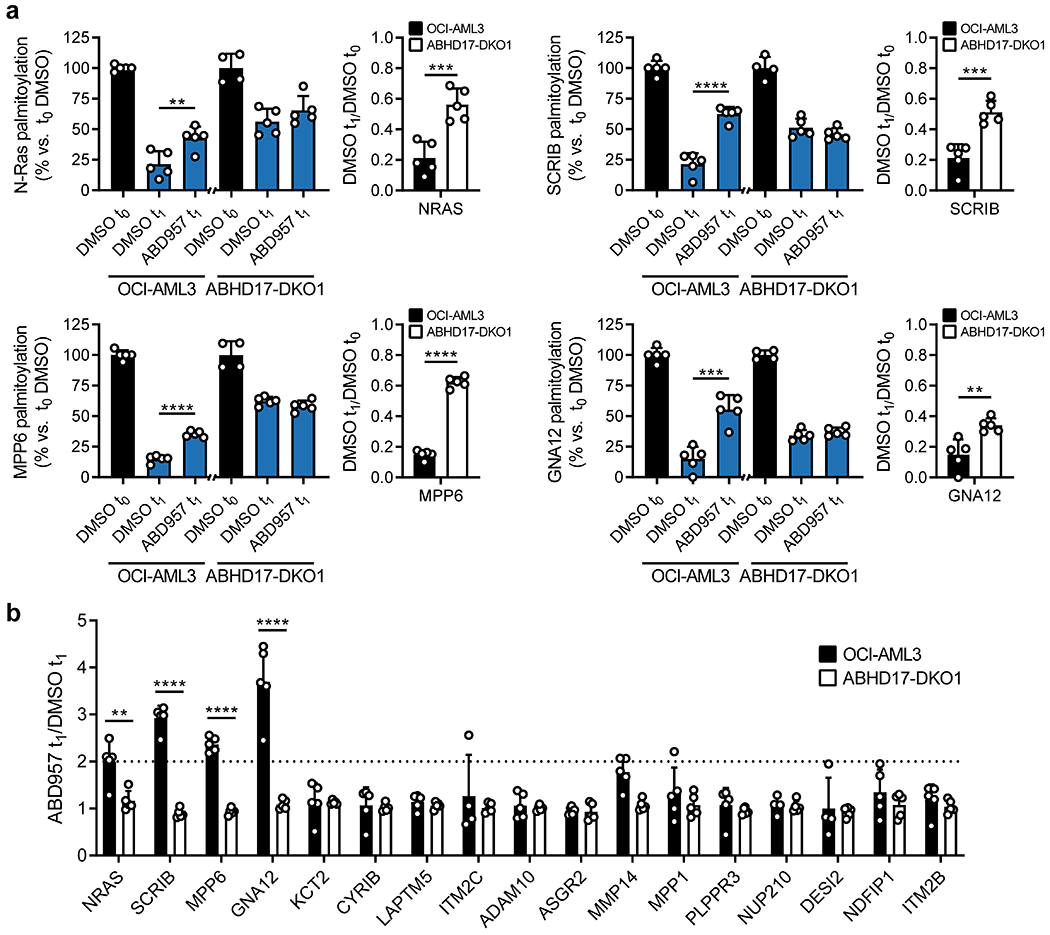
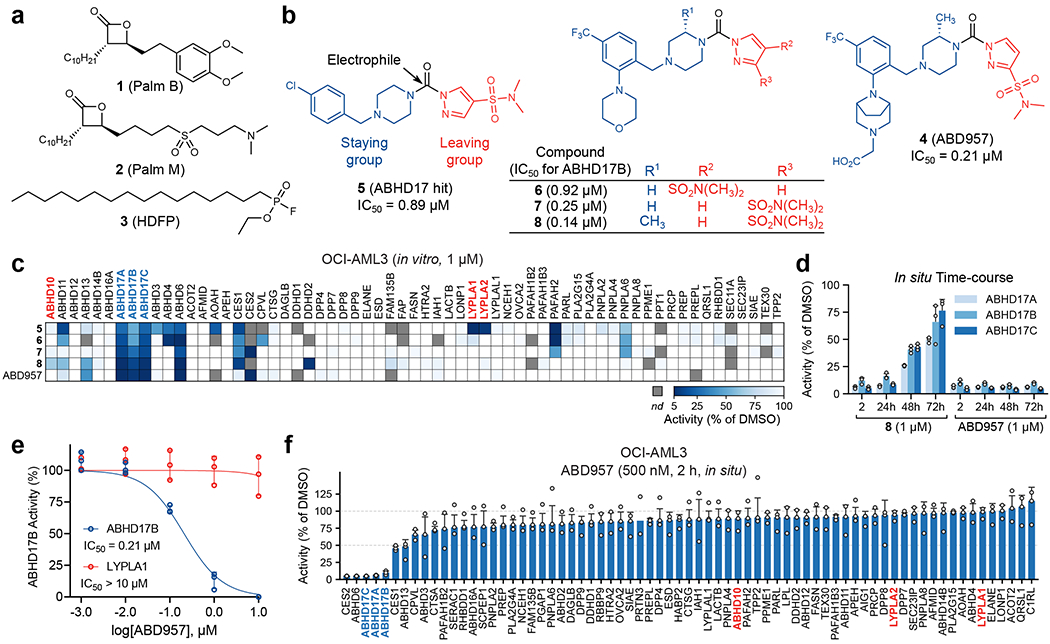
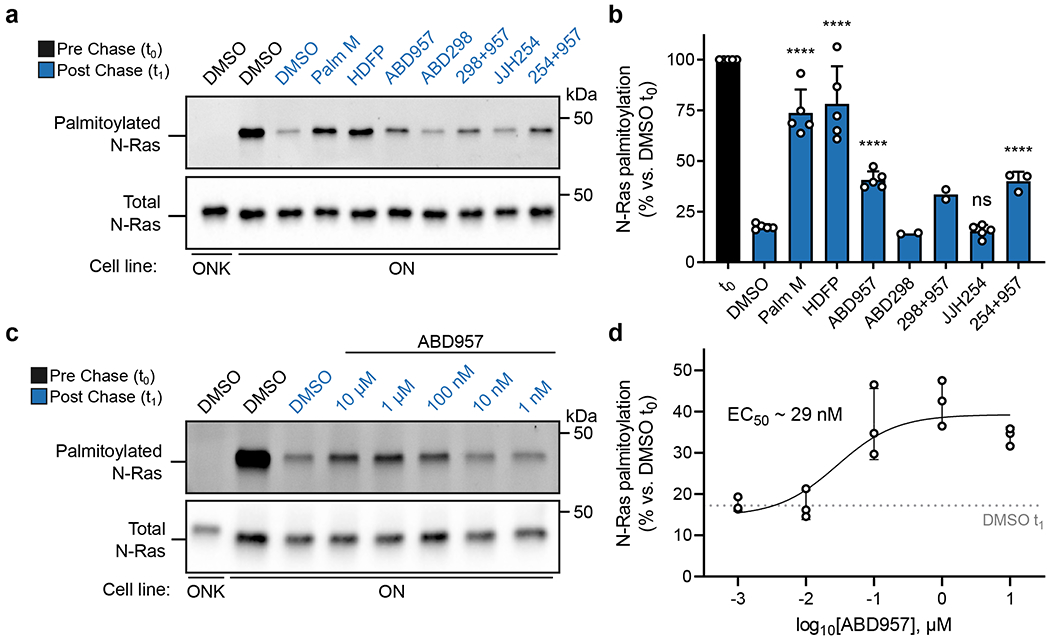
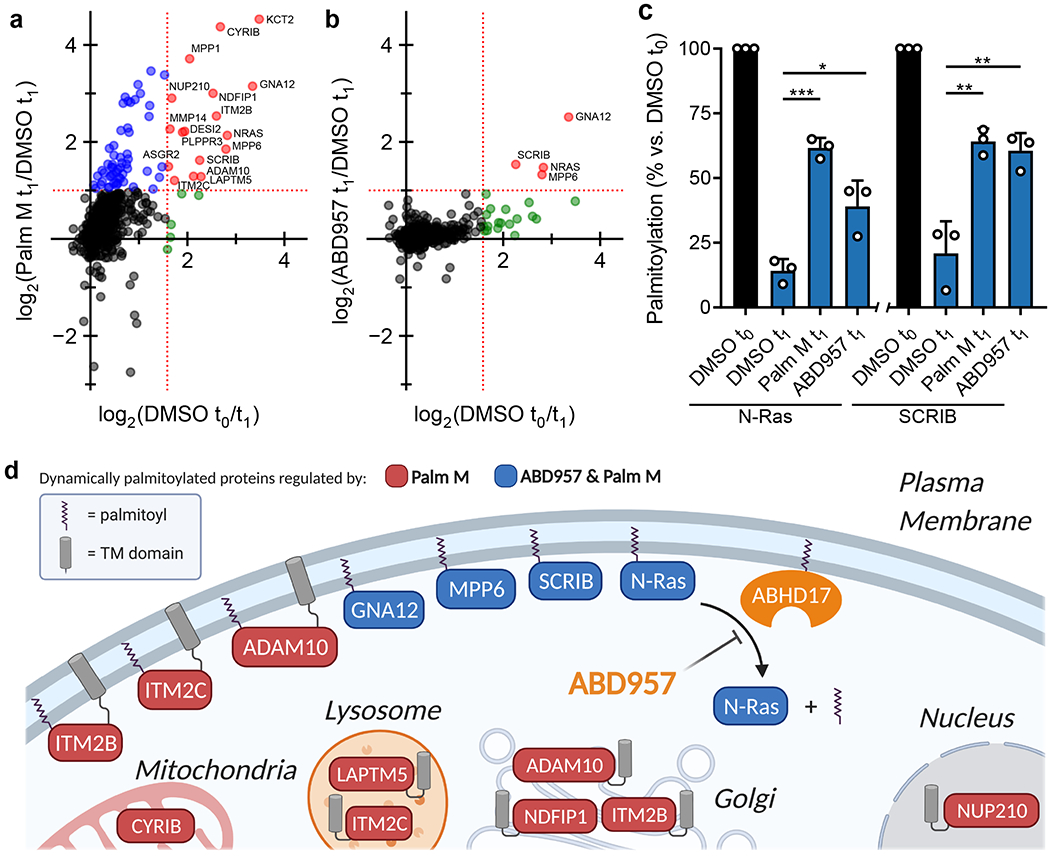
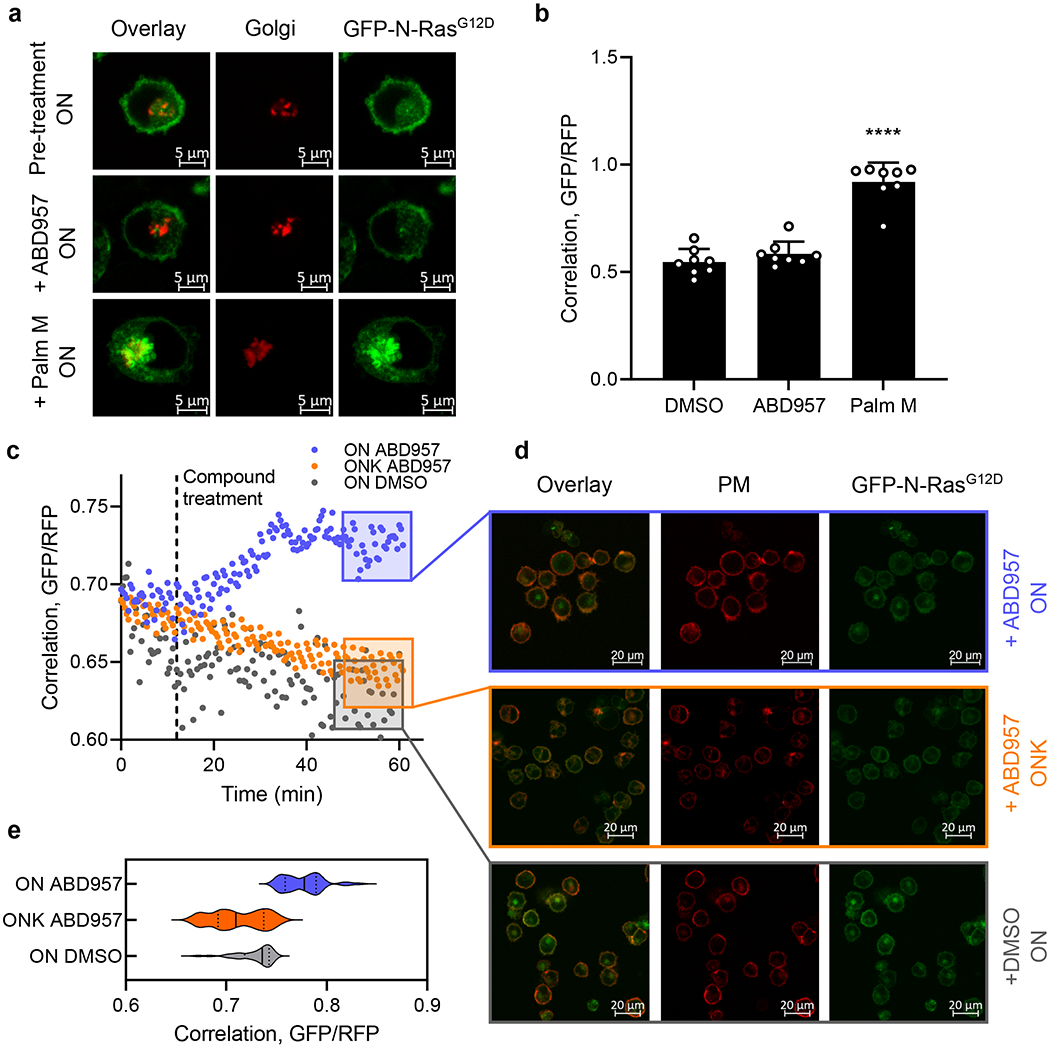
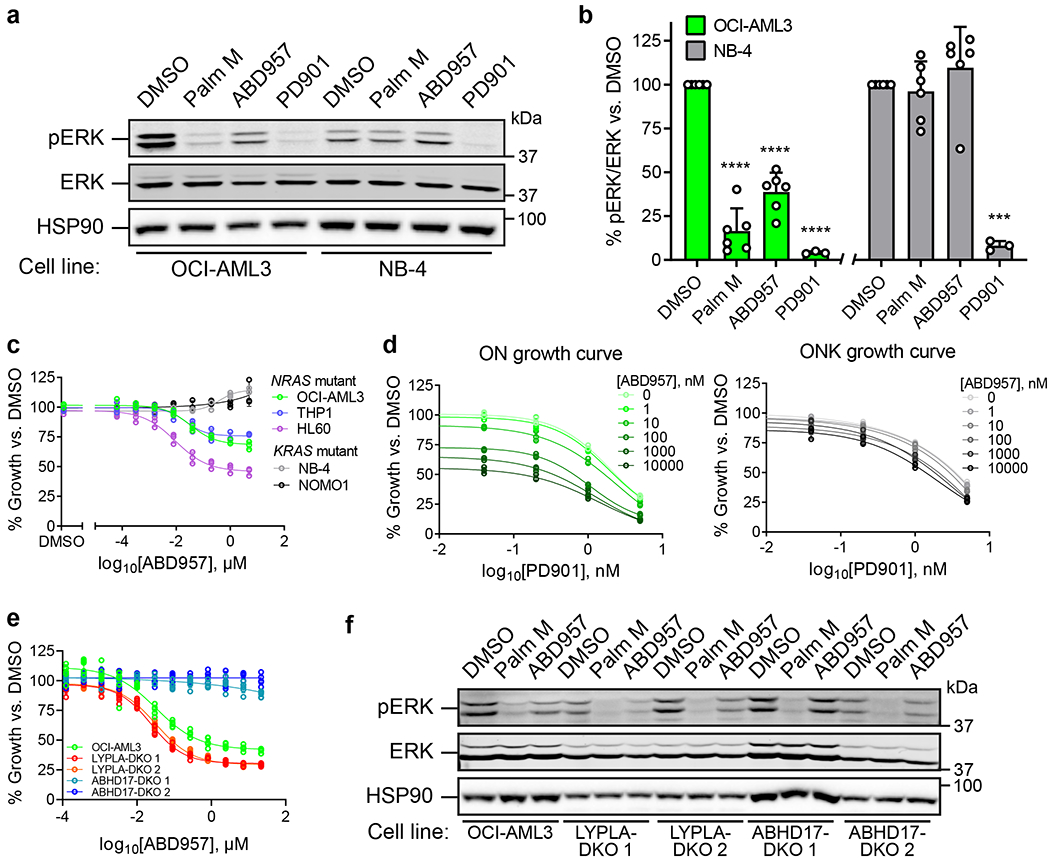
Multiple Ras proteins, including N-Ras, depend on a palmitoylation/depalmitoylation cycle to regulate their subcellular trafficking and oncogenicity. General lipase inhibitors such as Palmostatin M (Palm M) block N-Ras depalmitoylation, but lack specificity and target several enzymes displaying depalmitoylase activity. Here, we describe ABD957, a potent and selective covalent inhibitor of the ABHD17 family of depalmitoylases, and show that this compound impairs N-Ras depalmitoylation in human acute myeloid leukemia (AML) cells. ABD957 produced partial effects on N-Ras palmitoylation compared with Palm M, but was much more selective across the proteome, reflecting a plasma membrane-delineated action on dynamically palmitoylated proteins. Finally, ABD957 impaired N-Ras signaling and the growth of NRAS-mutant AML cells in a manner that synergizes with MAP kinase kinase (MEK) inhibition. Our findings uncover a surprisingly restricted role for ABHD17 enzymes as regulators of the N-Ras palmitoylation cycle and suggest that ABHD17 inhibitors may have value as targeted therapies for NRAS-mutant cancers.


Conflict of interest statement

Competing interests. The authors declare no competing interests.

Figures

Extended Data Fig. 1
Extended Data Fig. 1. Characterization of ABHD17 inhibitors
a, Representative gel-ABPP image showing FP-rhodamine labeling of recombinant human ABHD17B (hABHD17B) in proteomic lysates of stably transfected HEK293T cells. b, IC50 curves and representative gel-ABPP images of human ABHD17B and LYPLA1 activity in HEK293T cell lysate treated with compounds 5-8 and ABD957 for 30 min. Data represent average values ± s.d. (n = 3 independent experiments). c, MS-ABPP data of serine hydrolase activities in the particulate fraction of OCI-AML3 proteomes treated with compounds 5-8 and ABD957 for 30 min (10 μM). Data are from single experiments performed at the indicated concentrations for each compound. d, MS-ABPP data of serine hydrolase activities in OCI-AML3 cells treated in situ with Palm M (10 μM) or HDFP (20 μM) for 2 h. Data represent the median from three experiments corresponding to independent treatments of cells with compound (Palm M or HDFP) and error bars represent s.d.
Extended Data Fig. 2
Extended Data Fig. 2. Analysis of off-targets of ABD957 and control probes accounting for these serine hydrolases
a, Structures of ABD298, an ABHD13 inhibitor, and JJH254, a previously reported LYPLA1/2 inhibitor. b, MS-ABPP data of serine hydrolase activities in OCI-AML3 cells treated in situ with JJH254 (1 μM) or ABD298 (500 nM) for 2 h. Data represent the median from three experiments corresponding to independent treatments of cells with each compound (JJH254 or ABD298) and error bars represent standard deviation. c, IC50 curves and representative gel-ABPP images for ABD957 and ABD298 determined in proteomes of HEK293T cells expressing recombinant mouse ABHD13. Lysates were treated in vitro with inhibitor for 30 minutes at 37 °C, followed by incubation with FP-Rh for 30 minutes, RT. Experiments were performed in triplicate. Error bars represent s.d. and center around the mean. d, IC50 curve and representative gel-ABPP image for ABD957 determined for endogenous human ABHD6 in PC3 cell proteomes following a 30 min inhibitor treatment. Experiments were performed in triplicate. Error bars represent s.d. and center around the mean. e, IC50 curve for ABD957 derived by measuring the CES2-dependent rate of hydrolysis (background substracted) of the substrate 4-nitrophenyl acetate (pNPA) in proteomes of HEK293T cells expressing recombinant human CES2 following a 30 min inhibitor treatment. The mean reaction velocity (Vmean, ΔAbs / min•μg protein) in mock- versus CES2- transfected proteomes was 8.7 ± 1.9 min−1•μg−1 and 31 ± 1.2 min−1•μg−1, respectively. Data presented for all IC50 determinations represent average values ± s.d. (n = 3 independent experiments).
Extended Data Fig. 3
Extended Data Fig. 3. Schematic of a dynamic palmitoylation assay using metabolic labeling with 17-ODYA
Black arrowheads next to mock gel mark proteins that show dynamic palmitoylation fully (one arrowhead), partially (two arrowheads), or not (three arrowheads) preserved by serine hydrolase inhibition.
Extended Data Fig. 4
Extended Data Fig. 4. Global palmitoylation effects of Palm M and ABD957 in leukemia cells
a, MS-based proteomics in OCI-AML3 cells showing the 17- ODYA labeling at t0. The results indicate that Palm M increases the apparent palmitoylation state of several proteins prior to the chase period and, as shown in Fig. 3a, some of these proteins are not dynamically palmitoylated (blue proteins in Fig. 3a). b, Bar graph quantifiying different categories of N-Ras peptides from MS-based proteomics experiments in ON cells. Data represent average values relative to DMSO t0 ± s.d. (n = 4 from two biological replicates). Statistical significance was calculated with unpaired two-tailed Student’s t-test with equal variance, ***P<0.001, ****P<0.0001 represent significant increase compared to DMSO t1 (also see Supplementary Dataset 3). P values were 5.5×10⁻⁵ (Palm M GFP specific), 1.8×10⁻⁴ (ABD957 GFP specific), 2.1×10⁻⁵ (Palm M N-Ras specific), 2.7×10⁻⁴ (ABD957 N-Ras specific). c, d, Scatter plots as described in Fig. 3a in ON cells.
Extended Data Fig. 5
Extended Data Fig. 5. Effects of ABD957 treatment on N-Ras turnover in OCI-AML3 cells
a, Degradation and synthesis curves for N-Ras in OCI-AML3 cells treated with DMSO or ABD957 (500 nM). Each dot represents a peptide spectrum match (PSM) from one of three biological replicates. OCI-AML3 cells grown in light SILAC media were pelleted and resuspended in heavy SILAC media containing DMSO or ABD957 and harvested at the indicated times. Also see Supplementary Dataset 4.
Extended Data Fig. 6
Extended Data Fig. 6. Global palmitoylation effects of Palm M and ABD957 in NB-4 cells
a, b, Bar graphs quantifying SCRIB and N-Ras palmitoylation from MS-based proteomic experiments in NB-4 cells. Data represent average values relative to DMSO t0 ± s.d. (biological replicates; n=2 for Palm M t1, n=8 for all other conditions). Statistical significance was calculated with unpaired two-tailed Student’s t-test with equal variance, *P<0.05, ****P<0.0001 represent significant increase compared to DMSO t1 (also see Supplementary Dataset 2 and 3). P values were 6.5×10⁻⁷ (SCRIB), 0.013 (N-Ras).
Extended Data Fig. 7
Extended Data Fig. 7. Quantification of data shown in Figure 5f; average values ± s.d. (n = 4 independent experiments)
Statistical significance was calculated with unpaired two-tailed Student’s t-test with unequal variance compared to DMSO control, *P<0.05, **P<0.01, ****P<0.0001. P values were 4.8×10⁻⁶ (Palm M OCI-AML3), 0.012 (ABD957 OCI-AML3), 0.0016 (Palm M ABHD17-DKO 1), 0.0014 (Palm M ABHD17-DKO 2), 2.2×10⁻⁵ (Palm M LYPLA-DKO 1), 0.0010 (ABD957 LYPLA-DKO 1), 7.4×10⁻⁵ (Palm M LYPLA-DKO 2), 2.1×10⁻⁵ (ABD957 LYPLA-DKO 2).
Extended Data Fig. 8
Extended Data Fig. 8. MS-based proteomic analysis of dynamic palmitoylation in parental and ABHD17-DKO cells
a, Profiles for ABD957-regulated palmitoylated proteins from mass spectrometry (MS)-based experiments of OCI-AML3 and ABHD17-DKO 1 cells performed as described in Extended Data Fig. 3. Cells were preincubated with ABD957 (500 nM) or DMSO for 1 h, metabolically labeled with 20 μM 17-ODYA for 1 h (t0) and chased with media lacking 17-ODYA for 1 h (t1) containing ABD957 (500 nM) or DMSO control. Data represent average values relative to each cell lines corresponding DMSO t0 control ± s.d. (biological replicates, n = 4 for DMSO t0 values, n=5 for all others). Statistical significance was calculated with unpaired two-tailed Student’s t-test with equal variance, *P<0.05, **P<0.01, ***P<0.001, ****P<0.0001, compared to DMSO t1 for left panels or compared to DMSO t1/t0 ratio between OCI-AML3 and ABHD17-DKO1 cells for right panels. P values were 0.0096 (OCI-AML3 ABD957 N-Ras), 7.8×10⁻⁴ (OCI-AML3 DMSO t1/t0 N-Ras), 2.4×10⁻⁵ (OCI-AML3 ABD957 SCRIB), 4.4×10⁻⁴ (OCI-AML3 DMSO t1/t0 SCRIB), 1.9×10⁻⁶ (OCI-AML3 ABD957 MPP6), 1.2×10⁻⁸ (OCI-AML3 DMSO t1/t0 MPP6), 3.9×10⁻⁴ (OCI-AML3 ABD957 GNA12), 0.0044 (OCI-AML3 DMSO t1/t0 GNA12). b, Effect of ABD957 on dynamically palmitoylated proteins in OCI-AML3 and ABHD17-DKO1 cells. Data represent average values ± s.d. (n = 5 biological replicates). Statistical significance was calculated for proteins with >2-fold increases in ABD957-treated OCI-AML3 cells with unpaired two-tailed Student’s t-test with equal variance, **P<0.01, ****P<0.0001 compared to ABHD17-DKO1 cells. P values were 0.0049 (N-Ras), 2.3×10⁻⁷ (SCRIB), 7.6×10⁻⁸ (MPP6), 8.1×10⁻⁵ (GNA12).
Figure 1.
Figure 1.. Discovery and characterization of ABD957 - a potent and selective inhibitor of the ABHD17 enzymes.
a, Structures of broad-spectrum serine hydrolase inhibitors Palm B, Palm M and HDFP. b, Structures of pyrazole urea class of ABHD17 inhibitors discovered herein, highlighting proposed site of covalent reactivity with the active-site serine residue of ABHD17 enzymes. c, MS-ABPP data of serine hydrolase activities in the particulate fraction of OCI-AML3 proteomes treated with compounds 5-8 and ABD957 (1 μM, 30 min). See Extended Data Fig. 1c for MS-ABPP data of compounds tested at 10 μM and Supplementary Dataset 1 for detailed proteomic data. MS-ABPP data are from single experiments performed at the indicated concentrations for each compound. d, Targeted MS-ABPP data for an in situ time-course of ABHD17A/B/C inhibition by compounds 8 and ABD957 (1 μM) in ONK cells, revealing persistent inhibition of ABHD17A/B/C over 72 h in cells treated with ABD957, but not with compound 8. Data are plotted from biological replicates, and error bars represent s.d. and center around the average (n = 3 independent experiments). e, IC50 curves for ABD957 inhibition of human ABHD17B (recombinantly expressed) and LYPLA1 (endogenous) activity in lysates of HEK293T cells (in vitro) measured by gel-ABPP. Data represent average values ± s.d. (n = 3 independent experiments). f, In situ MS-ABPP data for ABD957 (500 nM, 2 h) in OCI-AML3 cells confirming ABHD17A/B/C inhibition and selectivity across the majority of quantified serine hydrolases, including LYPLA1, LYPLA2, and ABHD10. Data plotted represent the median from biological replicates, and error bars represent s.d. (n = 3 independent experiments).
Figure 2.
Figure 2.. Effects of inhibitor treatment on the dynamic palmitoylation state of N-Ras.
a, Representative gel measuring N-Ras palmitoylation by 17-ODYA comparing effect of treatment with Palm M (10 μM), HDFP (20 μM), ABD957 (500 nM), ABD298 (500 nM), and JJH254 (1 μM) in OCI-AML3 cells stably expressing GFP-N-RasG12D (ON) with GFP-N-RasG12D-KRAS-HVR (ONK) as a control (upper panel). Samples co-treated with ABD957 and ABD298 or JJH254 are abbreviated as 298+957 and 254+957 respectively. Gel is representative of 5 independent experiments (only one including ABD298, three including JJH254, and 5 for all other conditions). N-Ras was immunoprecipitated via GFP and the degree of palmitoylation visualized by rhodamine attached via CuAAC to the alkyne of 17-ODYA. Total N-Ras content was measured by Western blotting of GFP enrichments (lower panel). b, Quantification of inhibitor effects on dynamic palmitoylation. Data represent average values ± s.d. (biological replicates; n = 2 for ABD298 and ABD298 + ABD957 samples, n = 3 for JJH254 + ABD957 samples, and n = 5 for all others). Statistical significance was calculated using unpaired two-tailed Student’s t-test with equal variance, ****P<0.0001 represents significant increase compared to DMSO t1. P values were 4.9×10⁻⁶ (Palm M), 8.3×10⁻⁵ (HDFP), 2.5×10⁻⁶ (ABD957), 0.19 (JJH254), 3.9×10⁻⁵ (JJH254 + ABD957). c, Representative gel (from 3 independent experiments) measuring N-Ras palmitoylation by 17-ODYA in the presence of varying concentrations of ABD957 (upper panel). Dotted line represents mean of residual post-chase DMSO (t1) signal. N-Ras was enriched and visualized as described in a. Total N-Ras content was measured by Western blotting of GFP enrichments (lower panel). d, Quantification of concentration-dependent effects of ABD957 on N-Ras palmitoylation. Data are plotted from biological replicates, and error bars represent s.d. and center around the mean (n = 3 independent experiments).
Figure 3.
Figure 3.. Global palmitoylation effects of Palm M and ABD957 in leukemia cells.
a, b, Mass spectrometry (MS)-based profiling of OCI-AML3 cells as described in Extended Data Fig. 3. Cells were preincubated with Palm M (10 μM) or ABD957 (500 nM) for 1 h, metabolically labeled with 20 μM 17-ODYA for 1 h (t0) and chased with media lacking 17-ODYA for 1 h (t1) containing Palm M (10 μM, a), ABD957 (500 nM, b), or DMSO control. Scatter plots compare log2 ratios of palmitoylated proteins in experiments measuring dynamic palmitoyation (DMSO to/t1; x-axis) versus the effect of inhibitor treatment (inhibitor t1/DMSO t1; y-axis). Proteins shown were designated as palmitoylated based on their sensitivity to hydroxylamine (≥75% reduction in enrichment following hydroxylamine treatment) as reported in Supplementary Dataset 2. Proteins in red are both dynamically palmitoylated (DMSO t0/DMSO t1 ≥ 3 fold) and preserved in their palmitoylation state by inhibitor treatment (inhibitor t1/DMSO t1 ≥ 2 fold), green are dynamically palmitoylated, but not preserved by inhibitor treatment (inhibitor t1/DMSO t1 < 2 fold), and blue are proteins that did not display evidence of dynamic palmitoylation (DMSO t0/DMSO t1 < 3 fold), but showed higher palmitoylation signals following inhibitor treatment (inhibitor t1/DMSO t1 ≥ 2 fold). Red dotted lines represent 2-fold and 3-fold ratio values for y and x-axes respectively. Data represent average values (n = 3 biological replicates). HLA proteins not shown. c, Bar graphs quantifying N-Ras (left) and SCRIB (right) palmitoylation from MS-based proteomic experiments. Data represent average values relative to DMSO t0 ± s.d. (n = 3 biological replicates). Statistical significance was calculated with unpaired two-tailed Student’s t-test with equal variance, *P<0.05, **P<0.01, ***P<0.001 represent significant increase compared to DMSO t1. P values were 1.6×10⁻⁴ (Palm M N-Ras), 0.0173 (ABD957 N-Ras), 0.0050 (Palm M SCRIB), 0.0084 (ABD957 SCRIB). d, Cartoon diagram depicting the subcellular localization of selected proteins showing dynamic palmitoylation that was inhibited by Palm M (red) or both Palm M and ABD957 (blue) (created with BioRender.com). Transmembrane domains (TM) are annotated by PSORT II.
Figure 4.
Figure 4.. Effect of inhibitor treatment on GFP-N-Ras localization in ON and ONK cells.
a, Representative images from eight biological replicates of cells co-stained with the Golgi marker RFP-N-acetylgalactosaminyltransferase (RFP-GALNT2) before and after treatment with Palm M (10 μM) or ABD957 (500 nM). Red channel shows Golgi marker (middle), green channel shows GFP-N-Ras (right), and overlay of the two markers (left). Scale bar, 5 μm. b, Change in N-Ras colocalization to the Golgi, as a representative endomembrane compartment, measured by co-staining with RFP-GALNT2 after 10-minute compound treatment. Colocalization is quantified using the Mander’s correlation coefficient between GFP-N-Ras and RFP-GALNT2 signal. Data represent average values ± s.d. (n = 8 individual cells per group). Statistical significance was calculated with unpaired two-tailed Student’s t-test with equal variance, ****P<0.0001 represents significant increase compared to DMSO. P value 1.4×10⁻⁷. c, Real-time quantification of colocalization of GFP-N-Ras signal intensity and the plasma membrane marker Alexa-647-conjugated wheat germ agglutinin (WGA) in ON (purple) and ONK cells (orange) treated with ABD957 (1 μM at t = 10 minutes), in comparison to ON cells treated with DMSO (grey). Colocalization between GFP and RFP was quantified as in b and the correlation coefficient is shown on the y-axis. Images were acquired every 2 minutes for 10 minutes, then medium was infused with ABD957 and images collected for an additional 50 minutes (see Methods for details). Data shown are representative of three biological replicates. d, Representative images taken from c at t = 60 minutes (purple, yellow and grey boxes). Red channel shows plasma membrane staining with Alexa-647-conjugated WGA (middle), green channel shows GFP-N-Ras (right) and the overlay of the two markers is also shown (left). Treatment with ABD957 in ON (top) and ONK (middle) or DMSO in ON cells (bottom). Scale bar, 20 μm. e, Violin plot of cumulative colocalization between GFP-N-Ras and Alexa-647-conjugated WGA at t = 60 minutes after treatment with ABD957 or DMSO in ON or ONK cells is shown across three biological replicates of time-course experiments as shown in c. Median values represented by solid lines, lower and upper quartiles indicated by dotted lines. Also see Supplementary Video 1a–c.
Figure 5.
Figure 5.. ABHD17 inhibition selectively impairs the signaling and proliferation of NRAS mutant leukemia cells.
a, Representative Western blot for phosphorylated ERK (pERK) following exposure to Palm M (10 μM), ABD957 (500 nM), or PD901 (10 nM) for 4 h in NRAS mutant OCI-AML3 cells or KRAS mutant NB-4 cells. b, Quantification of data shown in a; average values ± s.d. (n = 6 independent experiments except for PD901, where n = 3 independent experiments). Statistical significance was calculated with unpaired two-tailed Student’s t-test with unequal variance compared to DMSO control, ***P<0.001, ****P<0.0001. P values were 1.9×10⁻⁵ (Palm M OCI-AML3), 3.9×10⁻⁵ (ABD957 OCI-AML3), 2.2×10⁻⁵ (PD901 OCI-AML3), 0.00028 (PD901 NB-4). c, d, Growth of the indicated human AML cell lines (c) and of isogenic ON and ONK cells (d) treated with varying concentrations of ABD957 for 72 h. Cell growth was measured by CellTiter Glo. Data represent average values ± s.d. (n = 3 biological replicates). e, Growth of the indicated OCI-AML3 parental and KO cell lines treated with varying concentrations of ABD957 for 72 h. Data represent average values ± s.d. (n = 6 biological replicates). f, Representative Western blot measuring pERK effects of compounds in the indicated OCI-AML3 parental and KO cell lines, performed as described in a.

Comment in

  • A stop sign for RAS trafficking.
    Qiu T, Dickinson BC. Qiu T, et al. Nat Chem Biol. 2021 Aug;17(8):840-841. doi: 10.1038/s41589-021-00789-4. Nat Chem Biol. 2021. PMID: 33927410 No abstract available.

Similar articles

Cited by

References

    1. Schubbert S, Shannon K & Bollag G Hyperactive Ras in developmental disorders and cancer. Nat Rev Cancer 7, 295–308 (2007). - PubMed
    1. Ostrem JM, Peters U, Sos ML, Wells JA & Shokat KM K-Ras(G12C) inhibitors allosterically control GTP affinity and effector interactions. Nature 503, 548–51 (2013). - PMC - PubMed
    1. Canon J et al. The clinical KRAS(G12C) inhibitor AMG 510 drives anti-tumour immunity. Nature 575, 217–223 (2019). - PubMed
    1. Omerovic J, Laude AJ & Prior IA Ras proteins: paradigms for compartmentalised and isoform-specific signalling. Cellular and molecular life sciences : CMLS 64, 2575–89 (2007). - PMC - PubMed
    1. Hancock JF, Paterson H & Marshall CJ A polybasic domain or palmitoylation is required in addition to the CAAX motif to localize p21ras to the plasma membrane. Cell 63, 133–139 (1990). - PubMed

Publication types

MeSH terms