

Individualized learning potential in stressful times: How to leverage intensive longitudinal data to inform online learning
- PMID: 33927470
- PMCID: PMC8078857
- DOI: 10.1016/j.chb.2021.106772
Individualized learning potential in stressful times: How to leverage intensive longitudinal data to inform online learning
Abstract
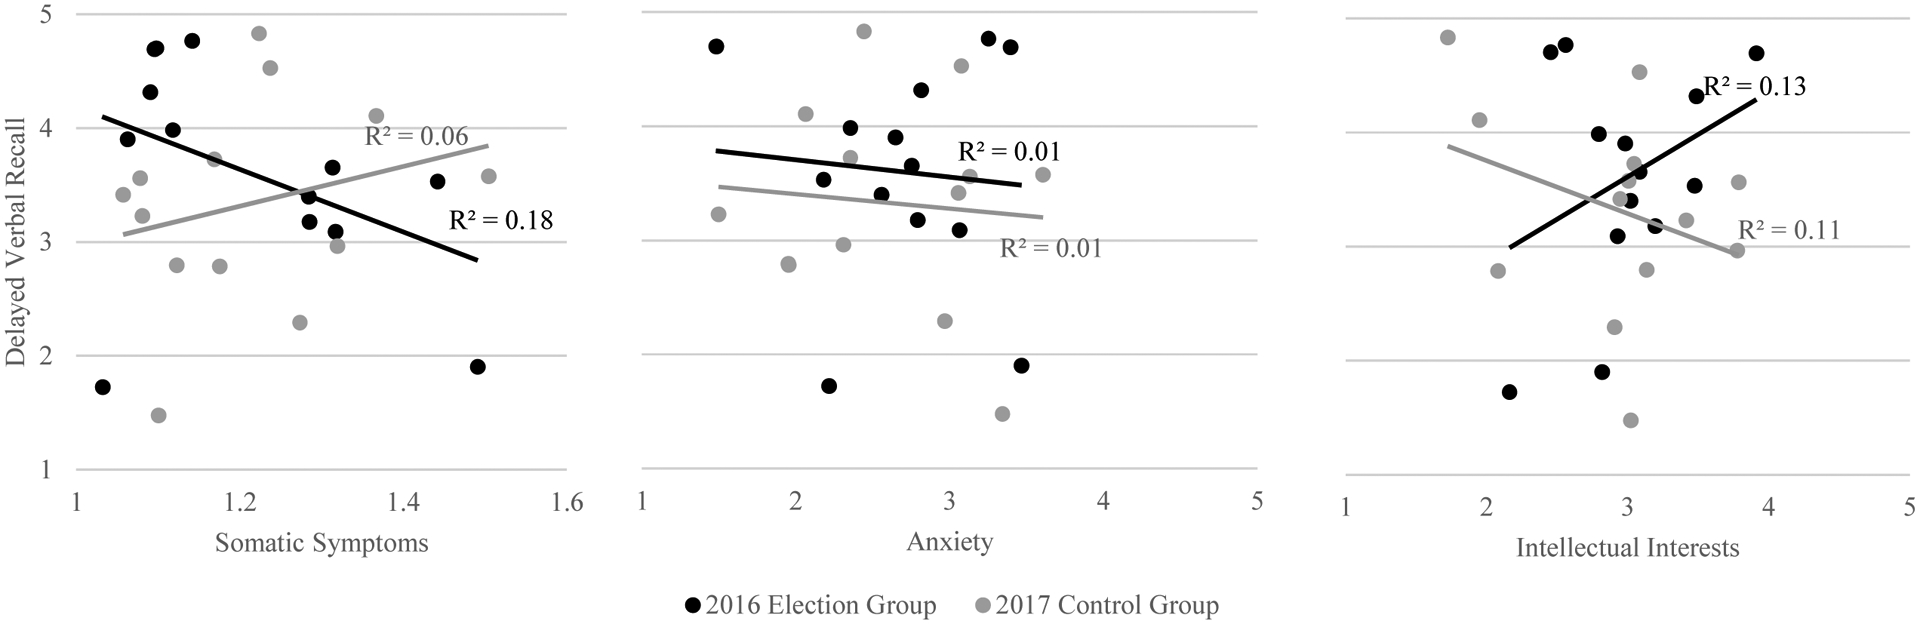
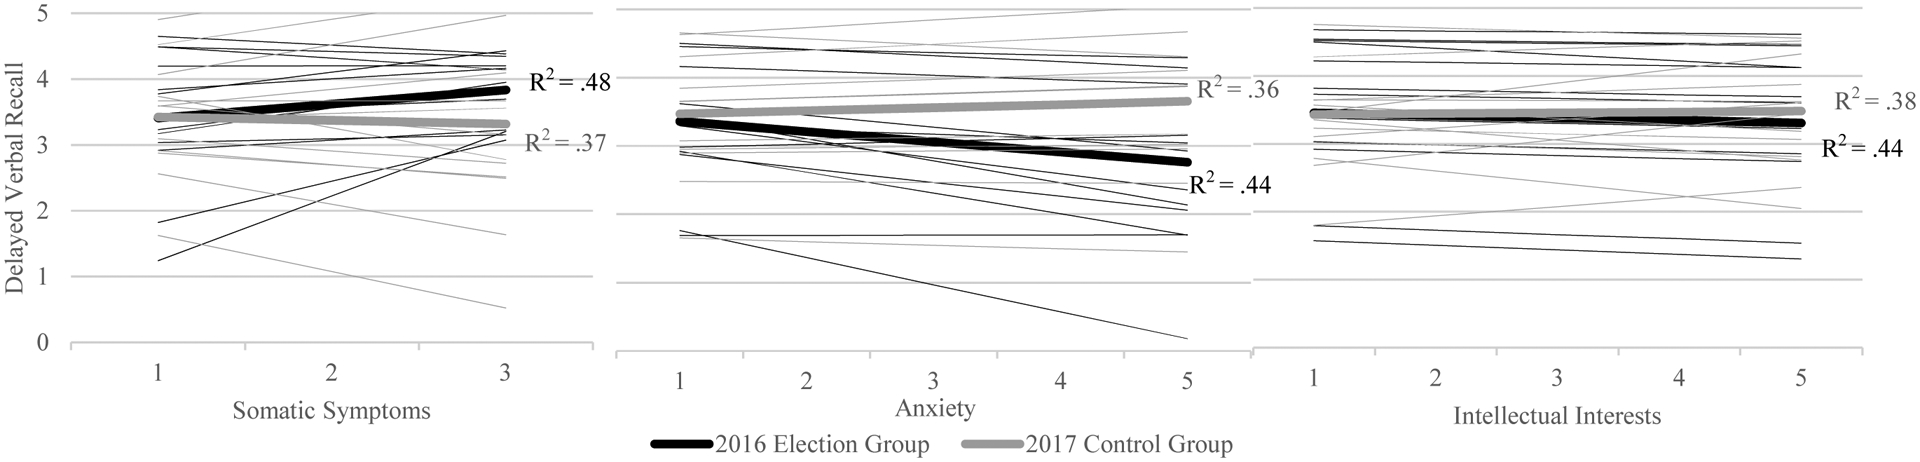
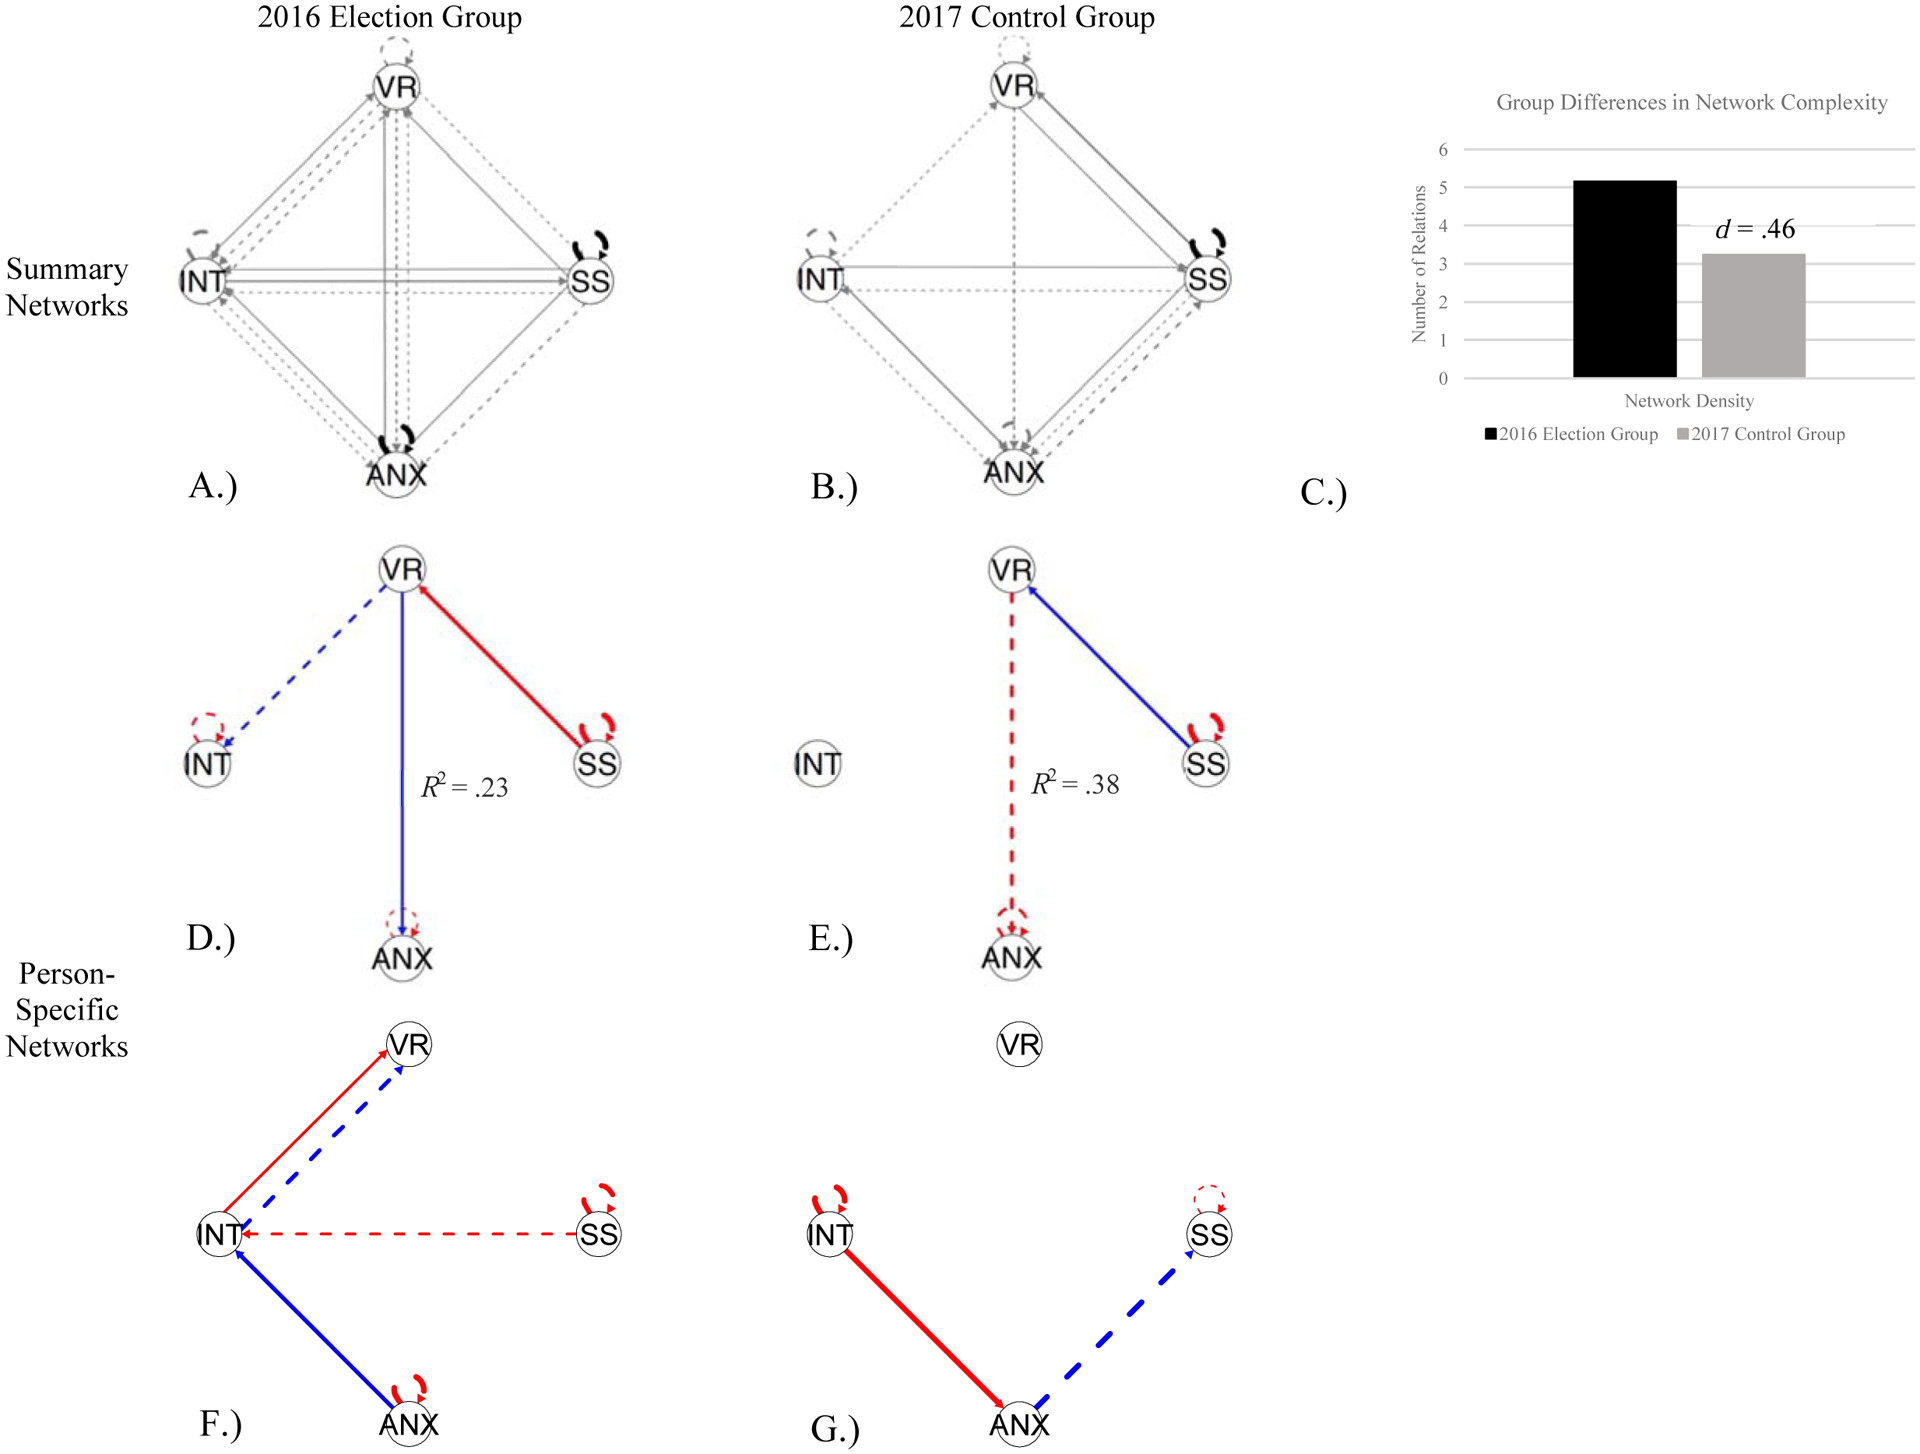
Societal events - such as natural disasters, political shifts, or economic downturns - are time-varying and impact the learning potential of students in unique ways. These impacts are likely accentuated during the COVID-19 pandemic, which precipitated an abrupt and wholesale transition to online education. Unfortunately, the individual-level consequences of these events are difficult to determine because the extant literature focuses on single-occasion surveys that produce only group-level inferences. To better understand individual-level variability in stress and learning, intensive longitudinal data can be leveraged. The goal of this paper is to illustrate this by discussing three different techniques for the analysis of intensive longitudinal data: (1) regression analyses; (2) multilevel models; and (3) person-specific network models, (e.g., group iterative multiple model estimation; GIMME). For each technique, a brief background in the context of education research is provided, an illustrative analysis is presented using data from college students who completed a 75-day intensive longitudinal study of cognition, somatic symptoms, anxiety, and intellectual interests during the 2016 U.S. Presidential election - a period of heightened sociopolitical stress - and strengths and limitations are considered. The paper ends with recommendations for future research, especially for intensive longitudinal studies of online education during COVID-19.
Keywords: GIMME; Macro-level stressors; Multilevel models; Regression analyses; Verbal recall.
Figures
Similar articles
-
Using temporal network methods to reveal the idiographic nature of development.Adv Child Dev Behav. 2022;62:159-190. doi: 10.1016/bs.acdb.2021.11.003. Epub 2021 Dec 28. Adv Child Dev Behav. 2022. PMID: 35249681
-
Toward a Developmental Science of Politics.Monogr Soc Res Child Dev. 2019 Sep;84(3):7-185. doi: 10.1111/mono.12410. Monogr Soc Res Child Dev. 2019. PMID: 31503346
-
The need for holistic, longitudinal and comparable, real-time assessment of the emotional, behavioral and societal impact of the COVID-19 pandemic across nations.Psychiatriki. 2021 Apr 19;32(1):15-18. doi: 10.22365/jpsych.2021.010. Epub 2021 Mar 8. Psychiatriki. 2021. PMID: 33759804 English, Greek, Modern.
-
Advancing statistical analysis of ambulatory assessment data in the study of addictive behavior: A primer on three person-oriented techniques.Addict Behav. 2018 Aug;83:25-34. doi: 10.1016/j.addbeh.2017.12.018. Epub 2017 Dec 15. Addict Behav. 2018. PMID: 29548570 Free PMC article. Review.
-
A social network analysis of college students' online learning during the epidemic era: A triadic reciprocal determinism perspective.Heliyon. 2024 Mar 16;10(6):e28107. doi: 10.1016/j.heliyon.2024.e28107. eCollection 2024 Mar 30. Heliyon. 2024. PMID: 38524571 Free PMC article. Review.
Cited by
-
A cross-sectional study of online learning during the COVID-19 pandemic: Student perceptions.Health Sci Rep. 2024 Mar 13;7(3):e1946. doi: 10.1002/hsr2.1946. eCollection 2024 Mar. Health Sci Rep. 2024. PMID: 38482135 Free PMC article.
-
Averting the Next Credibility Crisis in Psychological Science: Within-Person Methods for Personalized Diagnostics and Intervention.J Pers Oriented Res. 2022 Jan 7;7(2):53-77. doi: 10.17505/jpor.2021.23795. eCollection 2021. J Pers Oriented Res. 2022. PMID: 35462628 Free PMC article.
References
-
- Allen IE, & Seaman J (2017). Digital Compass Learning: Distance Education Enrollment Report 2017. Babson survey research group.
-
- Almeida DM, & Kessler RC (1998). Everyday stressors and gender differences in daily distress. Journal of Personality and Social Psychology, 75(3), 670. - PubMed
-
- Barrett LF, & Barrett DJ (2001). An introduction to computerized experience sampling in psychology. Social Science Computer Review, 19(2), 175–185.
Grants and funding
LinkOut - more resources
Full Text Sources
Other Literature Sources