. 2021 Apr 13:9:665089.
doi: 10.3389/fcell.2021.665089. eCollection 2021.

BMI1 Drives Steroidogenesis Through Epigenetically Repressing the p38 MAPK Pathway

Affiliations

BMI1 Drives Steroidogenesis Through Epigenetically Repressing the p38 MAPK Pathway

Jun Yu et al. Front Cell Dev Biol. .

Abstract

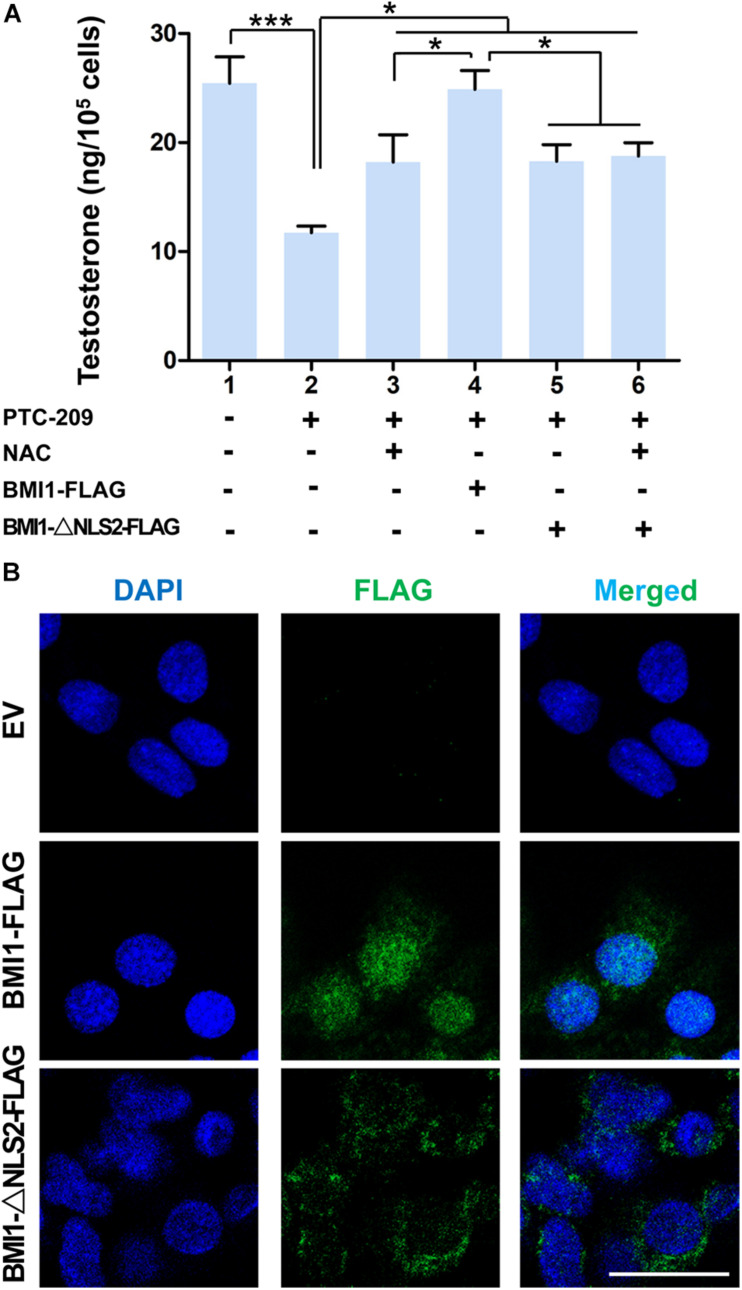
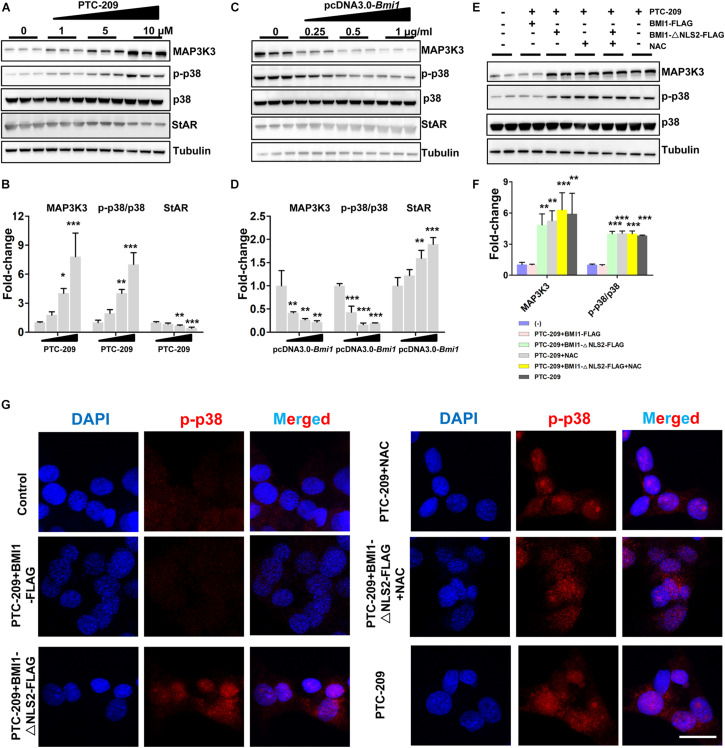
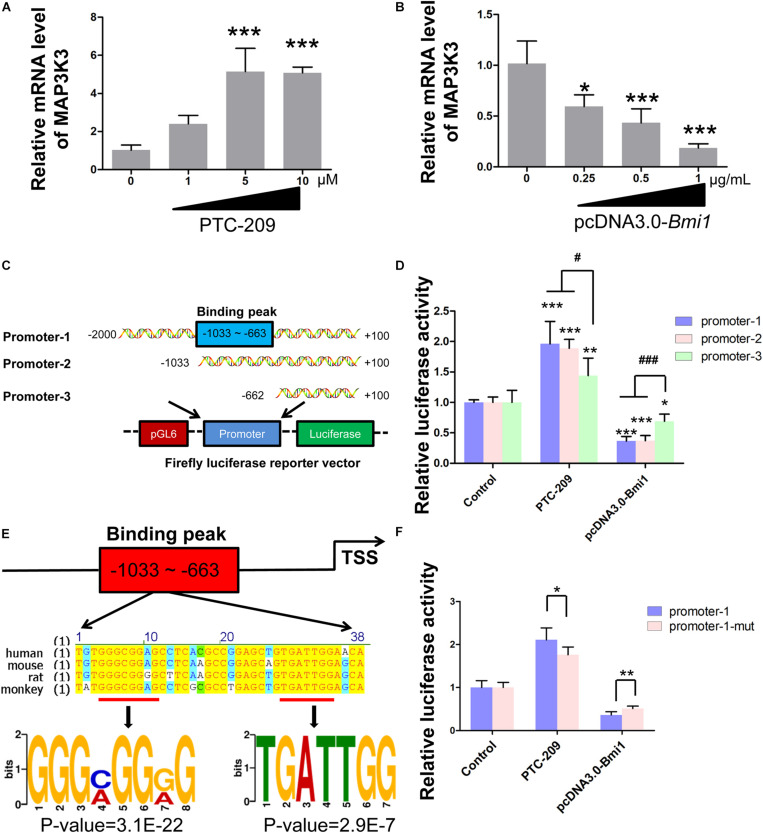
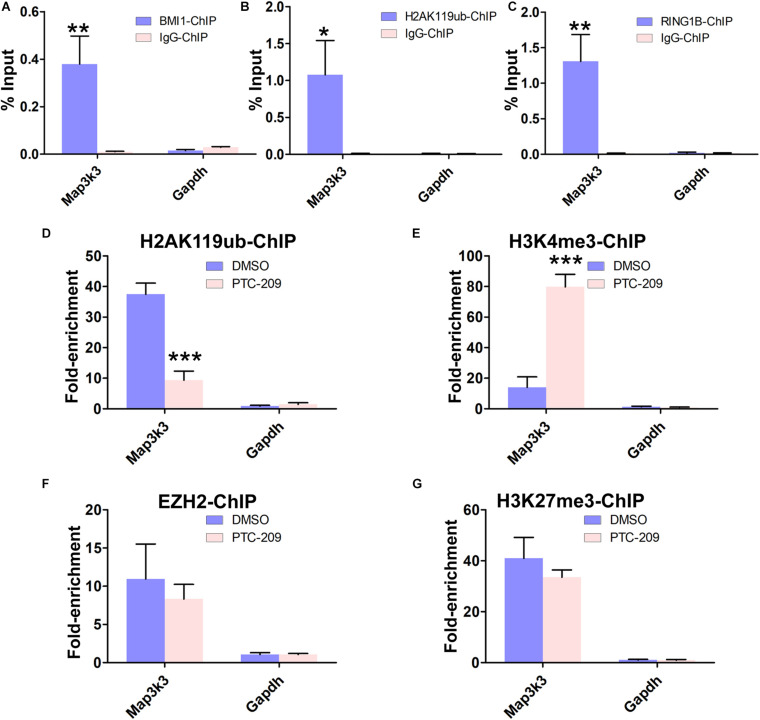
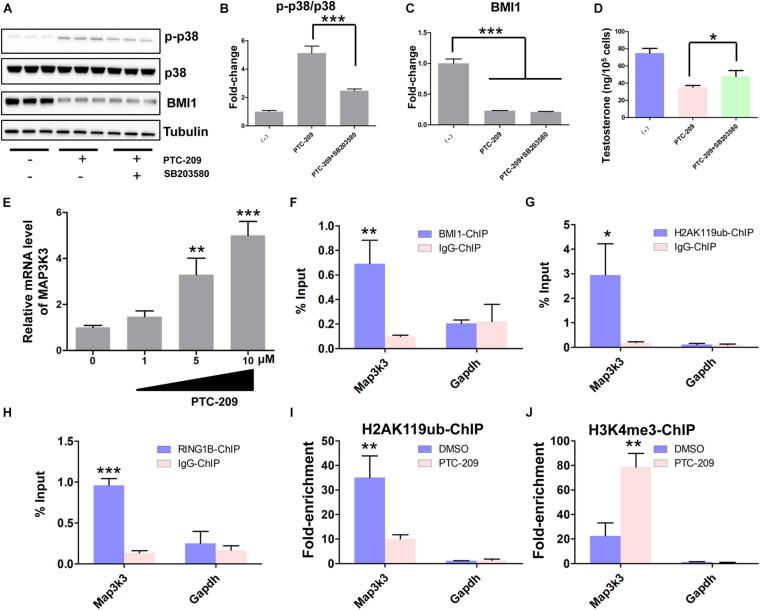
Testosterone biosynthesis progressively decreases in aging males primarily as a result of functional changes to Leydig cells. Despite this, the mechanisms underlying steroidogenesis remain largely unclear. Using gene knock-out approaches, we and others have recently identified Bmi1 as an anti-aging gene. Herein, we investigate the role of BMI1 in steroidogenesis using mouse MLTC-1 and primary Leydig cells. We show that BMI1 can positively regulate testosterone production. Mechanistically, in addition to its known role in antioxidant activity, we also report that p38 mitogen-activated protein kinase (MAPK) signaling is activated, and testosterone levels reduced, in BMI1-deficient cells; however, the silencing of the p38 MAPK pathway restores testosterone production. Furthermore, we reveal that BMI1 directly binds to the promoter region of Map3k3, an upstream activator of p38, thereby modulating its chromatin status and repressing its expression. Consequently, this results in the inhibition of the p38 MAPK pathway and the promotion of steroidogenesis. Our study uncovered a novel epigenetic mechanism in steroidogenesis involving BMI1-mediated gene silencing and provides potential therapeutic targets for the treatment of hypogonadism.

Keywords: Bmi1; epigenetic mechanism; p38 mitogen-activated protein kinase (MAPK) signaling; steroidogenesis; testosterone.


Conflict of interest statement

The authors declare that the research was conducted in the absence of any commercial or financial relationships that could be construed as a potential conflict of interest.

Figures

FIGURE 1
FIGURE 1
BMI1 promotes steroidogenesis in a dose-dependent manner. (A) MLTC-1 cells were treated with the indicated doses of PTC-209 for 48 h, followed by western blot analysis. (B) Quantification of (A). (C) Assessment of testosterone levels in MLTC-1 cells treated with the indicated doses of PTC-209 after treatment with 1 IU/mL human chorionic gonadotropin (hCG) for 6 h. (D) MLTC-1 cells were transfected with the indicated concentrations of the pcDNA3.0-Bmi1 plasmid for 48 h, followed by western blot analysis. (E) Quantification of (D). (F) The assessment of testosterone levels in MLTC-1 cells transfected with the indicated concentrations of the pcDNA3.0-Bmi1 plasmid after treatment with 1 IU/mL hCG for 6 h. **p < 0.01, ***p < 0.001.
FIGURE 2
FIGURE 2
Both cytoplasmic and nuclear BMI1 are required for steroidogenesis. (A) The assessment of testosterone levels in MLTC-1 cells treated as indicated for 48 h. PTC-209, N-acetylcysteine (NAC), pcDNA3.0-Bmi1-flag, and pcDNA3.0-Bmi1-△NLS2-flag were used at the concentrations of 5 μM, 500 μM, 1 μg/mL, and 1 μg/mL, respectively. Testosterone levels were determined by ELISA after treatment with 1 IU/mL human chorionic gonadotropin (hCG) for 6 h. (B) Immunofluorescence staining for FLAG in MLTC-1 cells transfected with the pcDNA3.0-flag empty vector (EV), pcDNA3.0-Bmi1-flag, and pcDNA3.0-Bmi1-△NLS2-flag for 48 h. All constructs were used at the concentration of 1 μg/mL. Scale bar, 20 μm. *p < 0.05, ***p < 0.001.
FIGURE 3
FIGURE 3
BMI1 inhibits the p38 MAPK pathway. (A) MLTC-1 cells were treated with the indicated concentrations of PTC-209 for 48 h, followed by western blot analysis of p38 MAPK expression. (B) Quantification of (A). (C) MLTC-1 cells were transfected with the indicated concentrations of the pcDNA3.0-Bmi1 plasmid for 48 h, followed by western blot analysis of p38 MAPK expression. (D) Quantification of (C). (E) Western blot analysis of p38 MAPK expression in MLTC-1 cells treated as indicated for 48 h. PTC-209, pcDNA3.0-Bmi1-flag, pcDNA3.0-Bmi1-△NLS2-flag, and N-acetylcysteine (NAC) were used at the concentrations of 5 μM, 1 μg/mL, 1 μg/mL, and 500 μM, respectively. (F) Quantification of (E). (G) Immunofluorescence staining for phospho-p38 in MLTC-1 cells treated as indicated for 48 h. PTC-209, pcDNA3.0-Bmi1-flag, pcDNA3.0-Bmi1-△NLS2-flag, and NAC were used at the concentrations of 5 μM, 1 μg/mL, 1 μg/mL, and 500 μM, respectively. DMSO combined with empty vector (EV) was used as the control. Scale bar, 20 μm. *p < 0.05, **p < 0.01, ***p < 0.001.
FIGURE 4
FIGURE 4
BMI1 inhibits Map3k3 transcription. (A) MLTC-1 cells were treated with the indicated concentrations of PTC-209 for 48 h, followed by quantitative real-time reverse transcription-PCR (RT-qPCR) analysis of Map3k3. (B) MLTC-1 cells were transfected with the indicated concentrations of the pcDNA3.0-Bmi1 plasmid for 48 h, followed by RT-qPCR analysis of Map3k3. (C) Schematic illustration of the firefly luciferase reporter constructs. (D) Luciferase activity assays in MLTC-1 cells transfected with luciferase reporter constructs and treated with PTC-209 (5 μM) or the pcDNA3.0-Bmi1 (1 μg/mL) plasmid for 48 h. DMSO combined with empty vector (EV) was used as the control. *, compared with control; #, compared with promoter-1 and -2. (E) Sequence analysis of the putative BMI1 binding region. (F) Luciferase activity assays in MLTC-1 cells transfected with luciferase reporter constructs containing promoter-1 and mutated promoter-1, PTC-209 (5 μM), or the pcDNA3.0-Bmi1 (1 μg/mL) plasmid for 48 h. DMSO combined with empty vector (EV) was used as the control. *p < 0.05, **p < 0.01, ***p < 0.001; #p < 0.05, ###p < 0.001.
FIGURE 5
FIGURE 5
BMI1 inhibition alters the chromatin status at the BMI1 binding peak region in the Map3k3 promoter. (A–C) ChIP-qPCR of BMI1-associated (A), H2AK119ub-associated (B), and RING1B-associated (C) DNA sequences from the putative BMI1-binding region of the Map3k3 promoter in MLTC-1 cells. The Gapdh gene was used as a negative control. (D–G) ChIP-qPCR of H2AK119ub-associated (D), H3K4me3-associated (E), EZH2-associated (F), and H3K27me3-associated (G) DNA sequences in the putative BMI1-binding region of the Map3k3 promoter in DMSO-treated or PTC-209-treated MLTC-1 cells. The y-axis represents enrichment relative to IgG controls. *p < 0.05, **p < 0.01, ***p < 0.001.
FIGURE 6
FIGURE 6
Inhibition of the p38 MAPK pathway rescued disrupted steroidogenesis. (A) Western blot analysis of phospho-p38 (p-p38) and BMI1 in MLTC-1 cells treated with PTC-209 (5 μM), SB203580 (10 μM), or siRNA targeting Map3k3 (50 nM) for 48 h. (B) Quantification of (A). (C) Quantification of (A). (D) Immunofluorescence staining for p-p38 in MLTC-1 cells treated as indicated for 48 h. PTC-209, SB203580, and Map3k3 siRNA were used at the concentrations of 5 μM, 10 μM, and 50 nM, respectively. (E) The assessment of testosterone levels in MLTC-1 cells treated as indicated for 48 h. PTC-209, SB203580, and Map3k3 siRNA were used at the concentrations of 5 μM, 10 μM, and 50 nM, respectively. Testosterone levels were determined by ELISA after treatment with 1 IU/mL human chorionic gonadotropin (hCG) for 6 h. Scale bar, 20 μm. *p < 0.05.
FIGURE 7
FIGURE 7
BMI1 epigenetically represses Map3k3 in primary mouse Leydig cells. (A) Western blot analysis of phospho-p38 and BMI1 in Leydig cells treated with PTC-209 (5 μM) or SB203580 (10 μM) for 48 h. (B) Quantification of (A). (C) Quantification of (A). (D) The assessment of testosterone levels in Leydig cells treated with PTC-209 (5 μM) or SB203580 (10 μM) for 48 h. (E) Leydig cells were treated with the indicated concentrations of PTC-209 for 48 h, followed by quantitative real-time reverse transcription-PCR analysis of Map3k3. (F–H) ChIP-qPCR of BMI1-associated (F), H2AK119ub-associated (G), and RING1B-associated (H) DNA sequences in the putative BMI1-binding region of the Map3k3 promoter in Leydig cells. The Gapdh gene was used as a negative control. (I, J) ChIP-qPCR of H2AK119ub- (I) and H3K4me3-associated (J) DNA sequences in the putative BMI1-binding region of the Map3k3 promoter in DMSO-treated or PTC-209-treated Leydig cells. The y-axis represents enrichment relative to IgG controls. *p < 0.05, **p < 0.01, ***p < 0.001.
FIGURE 8
FIGURE 8
Schematic illustration of the working model for the role of BMI1 in steroidogenesis. In the nucleus, BMI1 is indispensable for PRC1 assembly. Together with RING1B, BMI1 facilitates the monoubiquitination of histone H2A at K119 to repress Map3k3 expression, thereby promoting steroidogenesis. In the absence of BMI1, PRC1 function is disrupted and Map3k3 is transcriptionally activated, thereby blocking steroidogenesis.

References

    1. Abdou H. S., Bergeron F., Tremblay J. J. (2014). A cell-autonomous molecular cascade initiated by AMP-activated protein kinase represses steroidogenesis. Mol. Cell. Biol. 34 4257–4271. 10.1128/MCB.00734-14 - DOI - PMC - PubMed
    1. Abidi P., Leers-Sucheta S., Cortez Y., Han J., Azhar S. (2008a). Evidence that age-related changes in p38 MAP kinase contribute to the decreased steroid production by the adrenocortical cells from old rats. Aging Cell 7 168–178. 10.1111/j.1474-9726.2007.00364.x - DOI - PubMed
    1. Abidi P., Zhang H., Zaidi S. M., Shen W. J., Leers-Sucheta S., Cortez Y., et al. (2008b). Oxidative stress-induced inhibition of adrenal steroidogenesis requires participation of p38 mitogen-activated protein kinase signaling pathway. J. Endocrinol. 198 193–207. 10.1677/JOE-07-0570 - DOI - PubMed
    1. Arthur J. S., Ley S. C. (2013). Mitogen-activated protein kinases in innate immunity. Nat. Rev. Immunol. 13 679–692. 10.1038/nri3495 - DOI - PubMed
    1. Ayoub M. A., Yvinec R., Jegot G., Dias J. A., Poli S. M., Poupon A., et al. (2016). Profiling of FSHR negative allosteric modulators on LH/CGR reveals biased antagonism with implications in steroidogenesis. Mol. Cell. Endocrinol. 436 10–22. 10.1016/j.mce.2016.07.013 - DOI - PubMed

LinkOut - more resources