

Mammary tumors in Sprague Dawley rats induced by N-ethyl-N-nitrosourea for evaluating terahertz imaging of breast cancer
- PMID: 33928181
- PMCID: PMC8071784
- DOI: 10.1117/1.JMI.8.2.023504
Mammary tumors in Sprague Dawley rats induced by N-ethyl-N-nitrosourea for evaluating terahertz imaging of breast cancer
Abstract
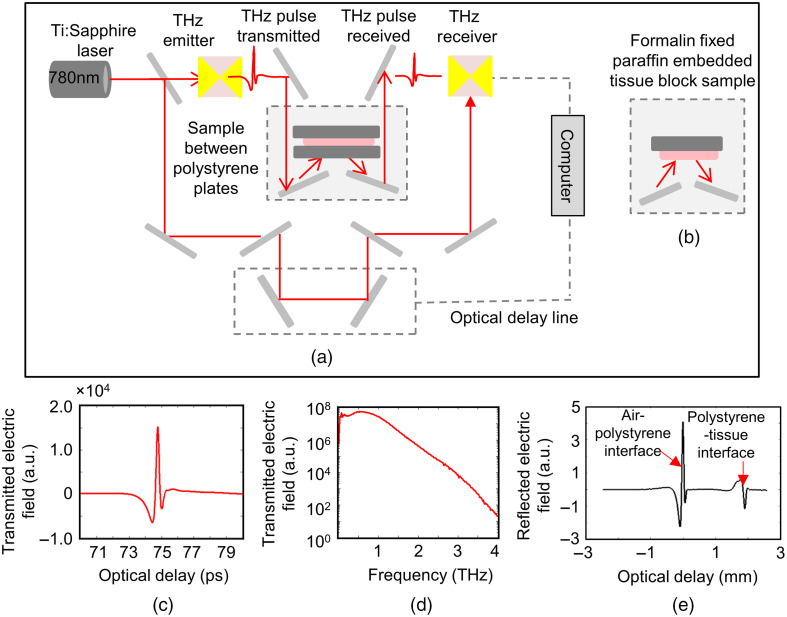
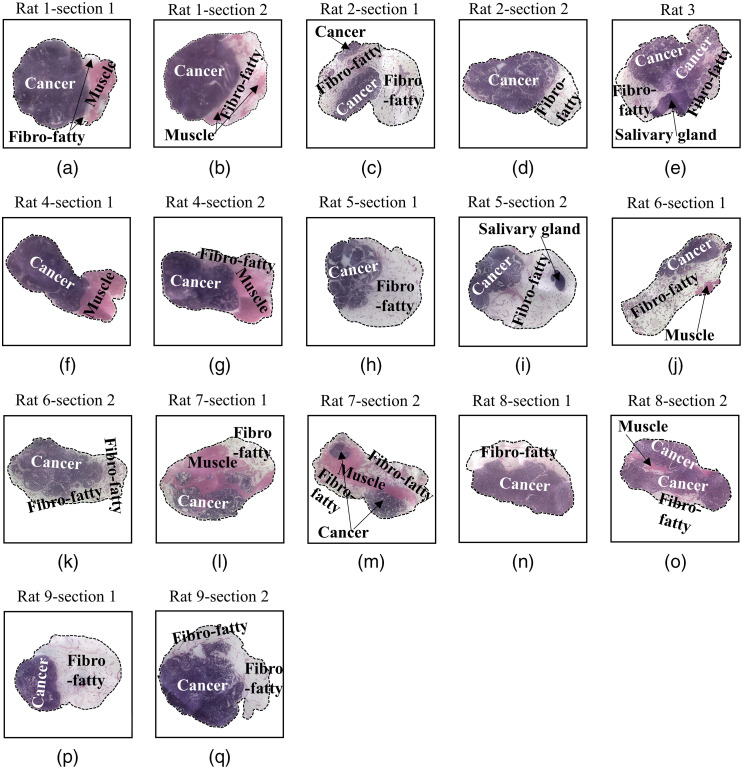
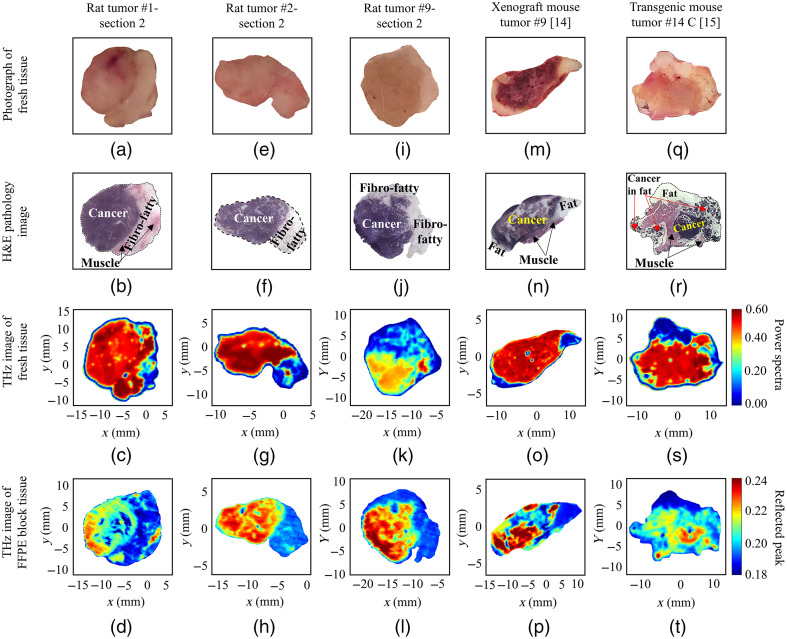
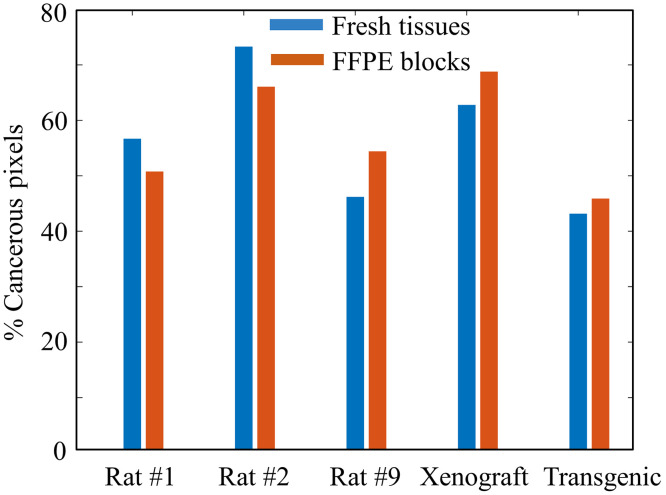
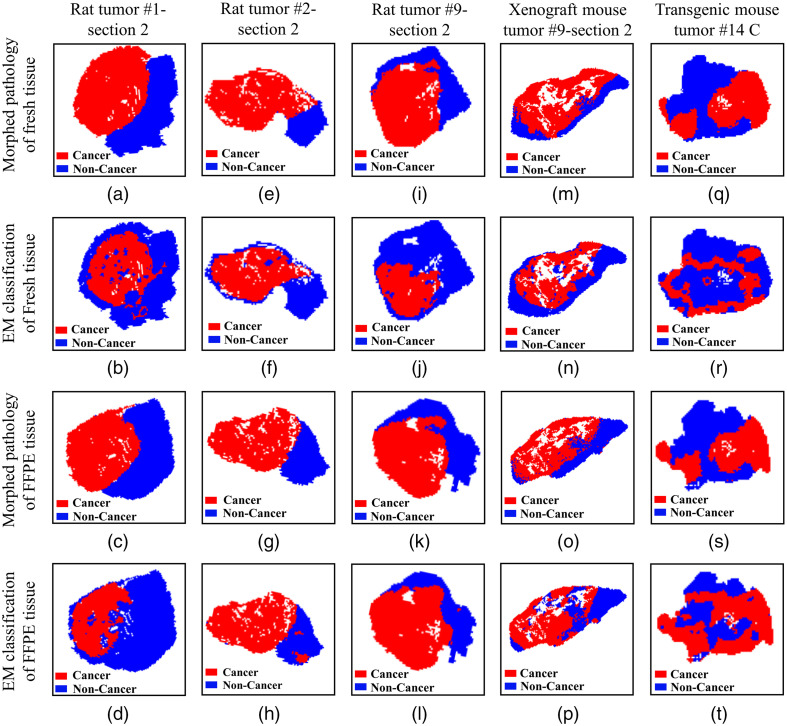
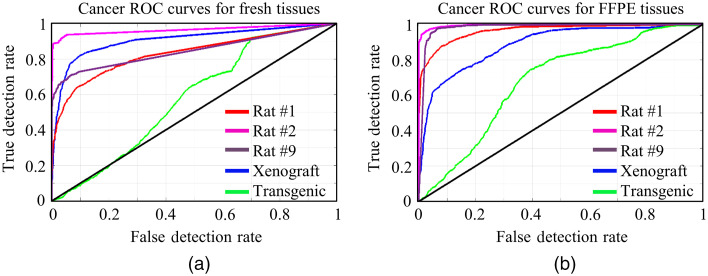
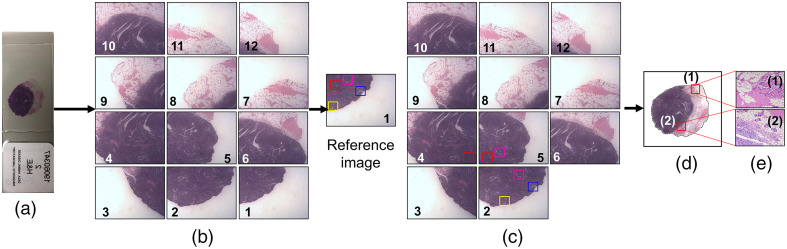
Purpose: The objective of this study is to quantitatively evaluate terahertz (THz) imaging for differentiating cancerous from non-cancerous tissues in mammary tumors developed in response to injection of N-ethyl-N-nitrosourea (ENU) in Sprague Dawley rats. Approach: While previous studies have investigated the biology of mammary tumors of this model, the current work is the first study to employ an imaging modality to visualize these tumors. A pulsed THz imaging system is utilized to experimentally collect the time-domain reflection signals from each pixel of the rat's excised tumor. A statistical segmentation algorithm based on the expectation-maximization (EM) classification method is implemented to quantitatively assess the obtained THz images. The model classification of cancer is reported in terms of the receiver operating characteristic (ROC) curves and the areas under the curves. Results: The obtained low-power microscopic images of 17 ENU-rat tumor sections exhibited the presence of healthy connective tissue adjacent to cancerous tissue. The results also demonstrated that high reflection THz signals were received from cancerous compared with non-cancerous tissues. Decent tumor classification was achieved using the EM method with values ranging from 83% to 96% in fresh tissues and 89% to 96% in formalin-fixed paraffin-embedded tissues. Conclusions: The proposed ENU breast tumor model of Sprague Dawley rats showed a potential to obtain cancerous tissues, such as human breast tumors, adjacent to healthy tissues. The implemented EM classification algorithm quantitatively demonstrated the ability of THz imaging in differentiating cancerous from non-cancerous tissues.
Keywords: ENU-rat tumor induction; Sprague Dawley rats; Terahertz imaging; breast cancer; expectation-maximization classification method; microscopic imaging; reflection mode.
© 2021 Society of Photo-Optical Instrumentation Engineers (SPIE).
Figures
Similar articles
-
Hyperspectral terahertz imaging and optical clearance for cancer classification in breast tumor surgical specimen.J Med Imaging (Bellingham). 2022 Jan;9(1):014002. doi: 10.1117/1.JMI.9.1.014002. Epub 2022 Jan 12. J Med Imaging (Bellingham). 2022. PMID: 35036473 Free PMC article.
-
Pulsed Terahertz Reflection Imaging of tumors in a spontaneous model of breast cancer.Biomed Phys Eng Express. 2018 Nov;4(6):065025. doi: 10.1088/2057-1976/aae699. Epub 2018 Oct 23. Biomed Phys Eng Express. 2018. PMID: 31275612 Free PMC article.
-
Pulsed terahertz imaging of breast cancer in freshly excised murine tumors.J Biomed Opt. 2018 Feb;23(2):1-13. doi: 10.1117/1.JBO.23.2.026004. J Biomed Opt. 2018. PMID: 29446263 Free PMC article.
-
Cancer detection in excised breast tumors using terahertz imaging and spectroscopy.Biomed Spectrosc Imaging. 2019;8(1-2):1-9. doi: 10.3233/bsi-190187. Epub 2019 Jul 9. Biomed Spectrosc Imaging. 2019. PMID: 32566474 Free PMC article.
-
Assessment of Terahertz Imaging for Excised Breast Cancer Tumors with Image Morphing.J Infrared Millim Terahertz Waves. 2018 Dec;39(12):1283-1302. doi: 10.1007/s10762-018-0529-8. Epub 2018 Aug 9. J Infrared Millim Terahertz Waves. 2018. PMID: 30984302 Free PMC article.
Cited by
-
Polarimetry terahertz imaging of human breast cancer surgical specimens.J Med Imaging (Bellingham). 2024 Nov;11(6):065503. doi: 10.1117/1.JMI.11.6.065503. Epub 2024 Dec 5. J Med Imaging (Bellingham). 2024. PMID: 39649775
-
N-Ethyl-N-Nitrosourea Induced Leukaemia in a Mouse Model: Protective Effect of Icaritin via Inhibition of IL-6/JAK2/STAT3 Pathway Causes Apoptosis.J Inflamm Res. 2024 Feb 7;17:777-790. doi: 10.2147/JIR.S441755. eCollection 2024. J Inflamm Res. 2024. PMID: 38344310 Free PMC article.
-
Hyperspectral terahertz imaging and optical clearance for cancer classification in breast tumor surgical specimen.J Med Imaging (Bellingham). 2022 Jan;9(1):014002. doi: 10.1117/1.JMI.9.1.014002. Epub 2022 Jan 12. J Med Imaging (Bellingham). 2022. PMID: 35036473 Free PMC article.
References
-
- Okada K., et al. , “Terahertz near-field microscopy of ductal carcinoma in situ (DCIS) of the breast,” J. Phys.: Photonics 2(4), 044008 (2020).10.1088/2515-7647/abbcda - DOI
