. 2020 Jul 22;2(4):e200079.
doi: 10.1148/ryai.2020200079. eCollection 2020 Jul.

Automated Assessment and Tracking of COVID-19 Pulmonary Disease Severity on Chest Radiographs using Convolutional Siamese Neural Networks

Affiliations

Automated Assessment and Tracking of COVID-19 Pulmonary Disease Severity on Chest Radiographs using Convolutional Siamese Neural Networks

Matthew D Li et al. Radiol Artif Intell. .

Abstract

Purpose: To develop an automated measure of COVID-19 pulmonary disease severity on chest radiographs (CXRs), for longitudinal disease tracking and outcome prediction.

Materials and methods: A convolutional Siamese neural network-based algorithm was trained to output a measure of pulmonary disease severity on CXRs (pulmonary x-ray severity (PXS) score), using weakly-supervised pretraining on ∼160,000 anterior-posterior images from CheXpert and transfer learning on 314 frontal CXRs from COVID-19 patients. The algorithm was evaluated on internal and external test sets from different hospitals (154 and 113 CXRs respectively). PXS scores were correlated with radiographic severity scores independently assigned by two thoracic radiologists and one in-training radiologist (Pearson r). For 92 internal test set patients with follow-up CXRs, PXS score change was compared to radiologist assessments of change (Spearman ρ). The association between PXS score and subsequent intubation or death was assessed. Bootstrap 95% confidence intervals (CI) were calculated.

Results: PXS scores correlated with radiographic pulmonary disease severity scores assigned to CXRs in the internal and external test sets (r=0.86 (95%CI 0.80-0.90) and r=0.86 (95%CI 0.79-0.90) respectively). The direction of change in PXS score in follow-up CXRs agreed with radiologist assessment (ρ=0.74 (95%CI 0.63-0.81)). In patients not intubated on the admission CXR, the PXS score predicted subsequent intubation or death within three days of hospital admission (area under the receiver operating characteristic curve=0.80 (95%CI 0.75-0.85)).

Conclusion: A Siamese neural network-based severity score automatically measures radiographic COVID-19 pulmonary disease severity, which can be used to track disease change and predict subsequent intubation or death.


Figures

A, Schematic for training the convolutional Siamese neural network-based algorithm used to calculate the Pulmonary X-Ray Severity (PXS) score, a continuous measure of radiographic pulmonary disease severity in COVID-19 patients. The network is pre-trained with chest radiographs (CXRs) from CheXpert (10) using binary lung disease presence labels and then trained on CXRs from a COVID-19 training set using annotations for modified Radiographic Assessment of Lung Edema (mRALE) scores. B, Schematic for calculating the PXS score, which is calculated by comparing the image-of-interest pairwise with a pool of normal CXRs from CheXpert. Dw = Euclidean distance; MSE loss = mean square error.
Figure 1:
A, Schematic for training the convolutional Siamese neural network-based algorithm used to calculate the Pulmonary X-Ray Severity (PXS) score, a continuous measure of radiographic pulmonary disease severity in COVID-19 patients. The network is pre-trained with chest radiographs (CXRs) from CheXpert (10) using binary lung disease presence labels and then trained on CXRs from a COVID-19 training set using annotations for modified Radiographic Assessment of Lung Edema (mRALE) scores. B, Schematic for calculating the PXS score, which is calculated by comparing the image-of-interest pairwise with a pool of normal CXRs from CheXpert. Dw = Euclidean distance; MSE loss = mean square error.
Siamese neural network-based Pulmonary X-Ray Severity (PXS) score is a measure of radiographic pulmonary disease severity in patients with COVID-19. A and B, Scatterplots show, in a 154-patient internal test set (A) and 113-patient external hospital test set (B), the PXS score correlates with the modified Radiographic Assessment of Lung Edema (mRALE) score, a measure of pulmonary disease severity on chest radiographs (p=0.86, P<0.001 and p=0.86, P<0.001, respectively) (linear regression 95% confidence interval shown in the scatterplots). C, Occlusion sensitivity map-based approach shows that the Siamese neural network is focusing on pulmonary opacities. Yellow areas indicate parts of the image important to the neural network.
Figure 2:
Siamese neural network-based Pulmonary X-Ray Severity (PXS) score is a measure of radiographic pulmonary disease severity in patients with COVID-19. A and B, Scatterplots show, in a 154-patient internal test set (A) and 113-patient external hospital test set (B), the PXS score correlates with the modified Radiographic Assessment of Lung Edema (mRALE) score, a measure of pulmonary disease severity on chest radiographs (p=0.86, P<0.001 and p=0.86, P<0.001, respectively) (linear regression 95% confidence interval shown in the scatterplots). C, Occlusion sensitivity map-based approach shows that the Siamese neural network is focusing on pulmonary opacities. Yellow areas indicate parts of the image important to the neural network.
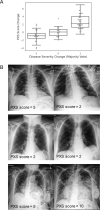
Siamese neural network-based Pulmonary X-Ray Severity (PXS) score can be used to assess longitudinal change in radiographic disease severity over time in COVID-19 patients. A, Boxplot shows the PXS score correlates with majority vote change in pulmonary disease severity (ρ=0.74, P<0.001), where -1, 0, and 1 indicate decreased, unchanged, and increased severity in longitudinal chest radiograph pairs, assigned by three independent raters (2 thoracic radiologists, 1 in-training radiologist). The boxplot boxes indicate the median and interquartile range (IQR), with whiskers extending to points within 1.5 IQRs of the IQR boundaries. B, Examples of PXS score evaluation of longitudinal change in three patients with COVID-19.
Figure 3:
Siamese neural network-based Pulmonary X-Ray Severity (PXS) score can be used to assess longitudinal change in radiographic disease severity over time in COVID-19 patients. A, Boxplot shows the PXS score correlates with majority vote change in pulmonary disease severity (ρ=0.74, P<0.001), where -1, 0, and 1 indicate decreased, unchanged, and increased severity in longitudinal chest radiograph pairs, assigned by three independent raters (2 thoracic radiologists, 1 in-training radiologist). The boxplot boxes indicate the median and interquartile range (IQR), with whiskers extending to points within 1.5 IQRs of the IQR boundaries. B, Examples of PXS score evaluation of longitudinal change in three patients with COVID-19.
Siamese neural network-based Pulmonary X-Ray Severity (PXS) score is associated with intubation in patients hospitalized with COVID-19. A, Boxplot shows the PXS score is significantly higher in patients intubated within three days of hospital admission (P<0.001). B, Boxplot shows that a higher PXS score is associated with a shorter time interval before intubation (ρ=0.25, P=0.004), C, Receiver operating characteristic and precision recall curves show the performance of the PXS score for predicting subsequent intubation within three days of hospital admission, in patients without an endotracheal tube on their admission chest radiograph (AUC, area under the curve; dashed lines indicate bootstrap 95% confidence intervals).
Figure 4:
Siamese neural network-based Pulmonary X-Ray Severity (PXS) score is associated with intubation in patients hospitalized with COVID-19. A, Boxplot shows the PXS score is significantly higher in patients intubated within three days of hospital admission (P<0.001). B, Boxplot shows that a higher PXS score is associated with a shorter time interval before intubation (ρ=0.25, P=0.004), C, Receiver operating characteristic and precision recall curves show the performance of the PXS score for predicting subsequent intubation within three days of hospital admission, in patients without an endotracheal tube on their admission chest radiograph (AUC, area under the curve; dashed lines indicate bootstrap 95% confidence intervals).

Update of

References

    1. ACR Recommendations for the use of Chest Radiography and Computed Tomography (CT) for Suspected COVID-19 Infection | American College of Radiology. https://www.acr.org/Advocacy-and-Economics/ACR-Position-Statements/Recom.... Accessed March 27, 2020.
    1. Rubin GD, Haramati LB, Kanne JP, et al. The Role of Chest Imaging in Patient Management during the COVID-19 Pandemic: A Multinational Consensus Statement from the Fleischner Society. Radiology. 2020;201365. - PMC - PubMed
    1. Wong HYF, Lam HYS, Fong AH-T, et al. Frequency and Distribution of Chest Radiographic Findings in COVID-19 Positive Patients. Radiology. 2019;201160. - PMC - PubMed
    1. Albaum MN, Hill LC, Murphy M, et al. Interobserver reliability of the chest radiograph in community-acquired pneumonia. Chest. 1996;110(2):343–350. - PubMed
    1. Loeb MB, Carusone SBC, Marrie TJ, et al. Interobserver Reliability of Radiologists’ Interpretations of Mobile Chest Radiographs for Nursing Home-Acquired Pneumonia. J Am Med Dir Assoc. 2006;7(7):416–419. - PubMed

LinkOut - more resources