. 2021 Apr;26(4):046004.
doi: 10.1117/1.JBO.26.4.046004.

Detection and monitoring of early dental caries and erosion using three-dimensional enhanced truncated-correlation photothermal coherence tomography imaging

Affiliations

Detection and monitoring of early dental caries and erosion using three-dimensional enhanced truncated-correlation photothermal coherence tomography imaging

Sohrab Roointan et al. J Biomed Opt. 2021 Apr.

Abstract

Significance: Dental caries is the most common oral disease, with significant effects on healthcare systems and quality of life. Developing diagnostic methods for early caries detection is key to reducing this burden and enabling non-invasive treatment as opposed to the drill-and-fill approach.

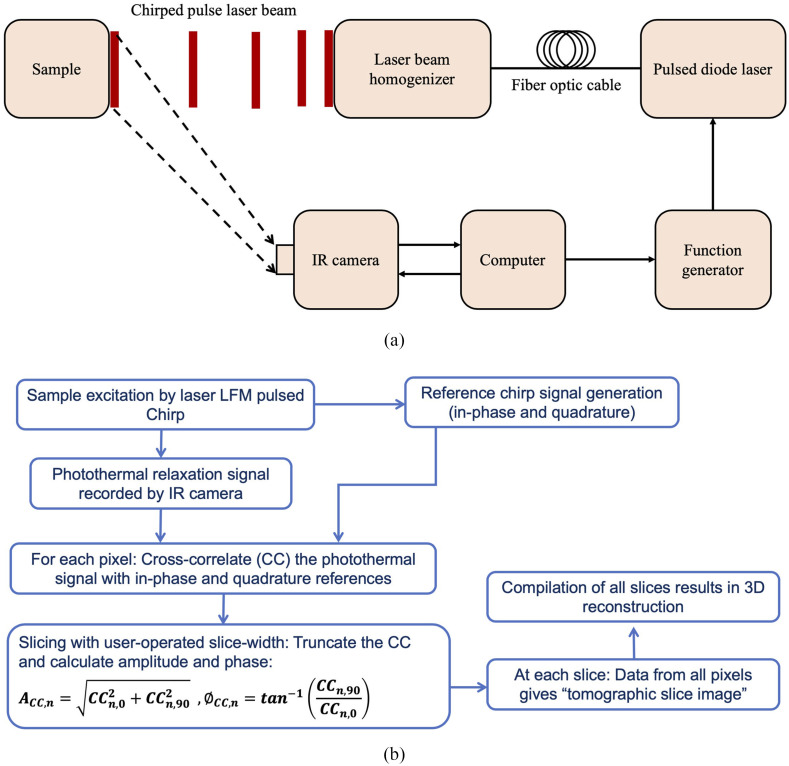
Aim: The application of a thermophotonic-based 3D imaging modality [enhanced truncated-correlation photothermal coherence tomography (eTC-PCT)] to early dental caries is investigated. To this end, the detection threshold, sensitivity, and 3D lesion reconstruction capability of eTC-PCT in imaging artificially generated caries and surface erosion are evaluated.

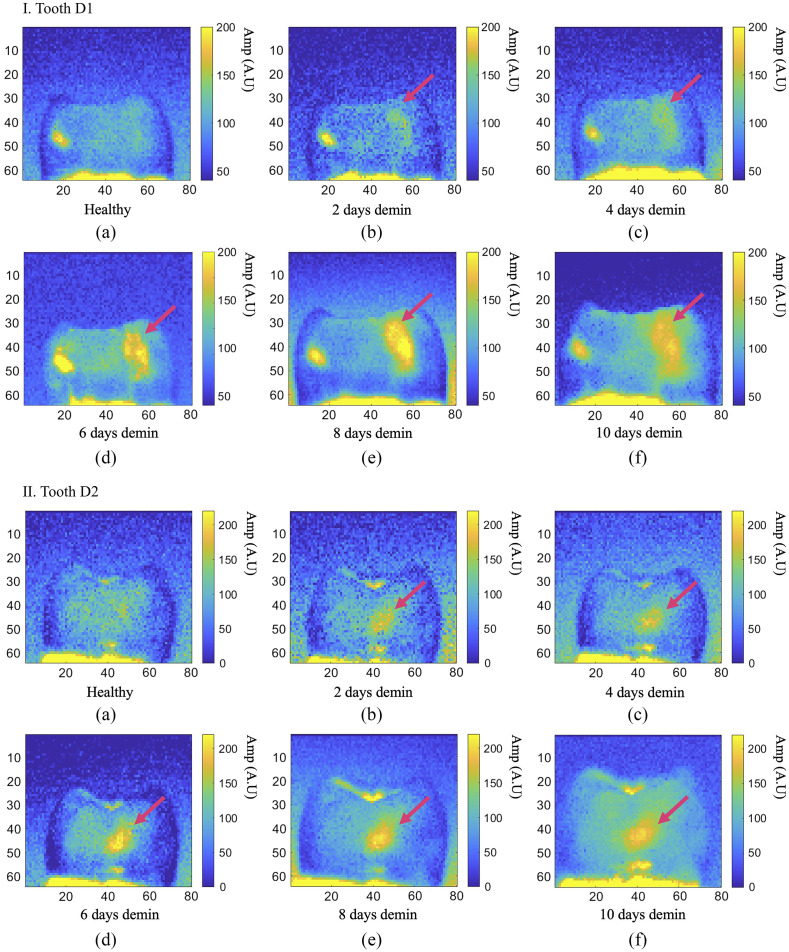
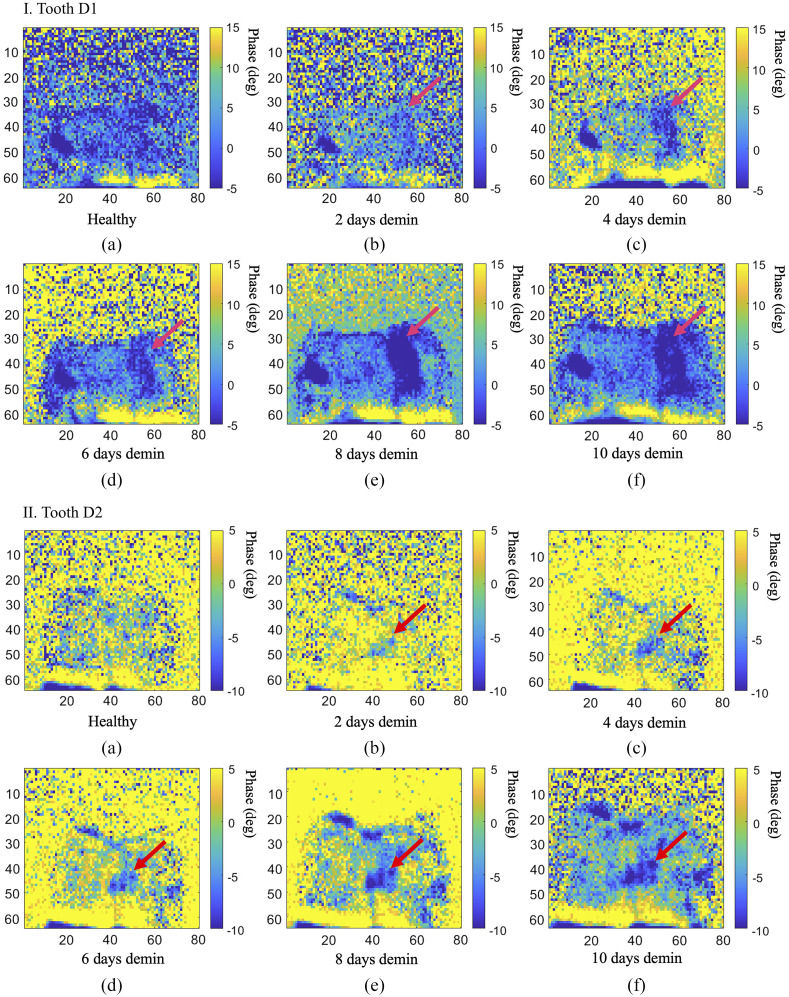
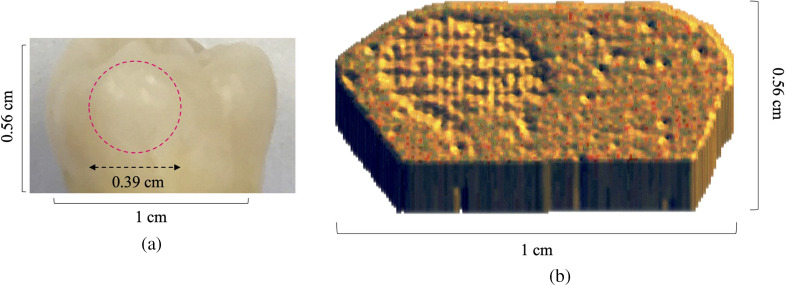
Approach: eTC-PCT employs a diode laser with pulsed excitation, a mid-IR camera, and an in-house developed image reconstruction algorithm to produce depth-resolved 2D images and 3D reconstructions. Starting with healthy teeth, dental caries and surface erosion are simulated in vitro through application of specific demineralizing/eroding acidic solutions.

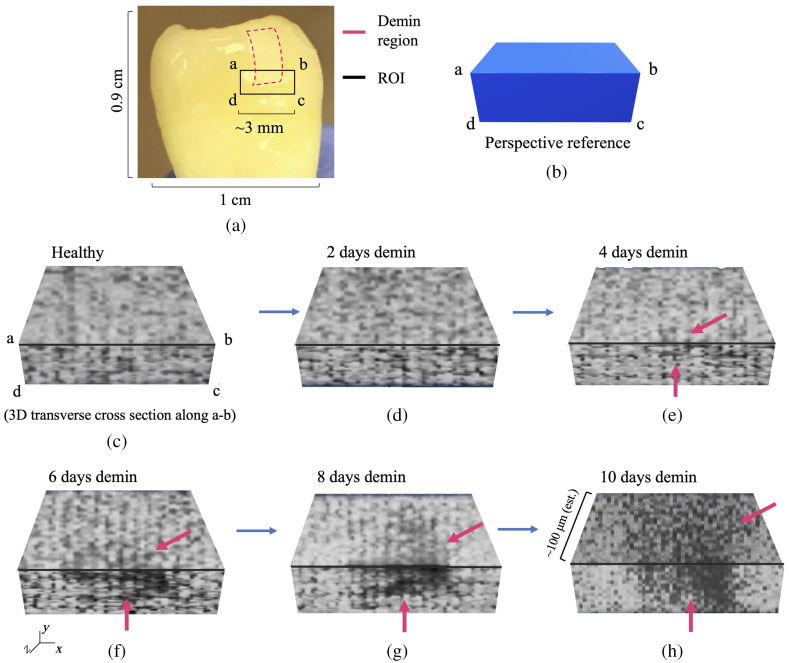
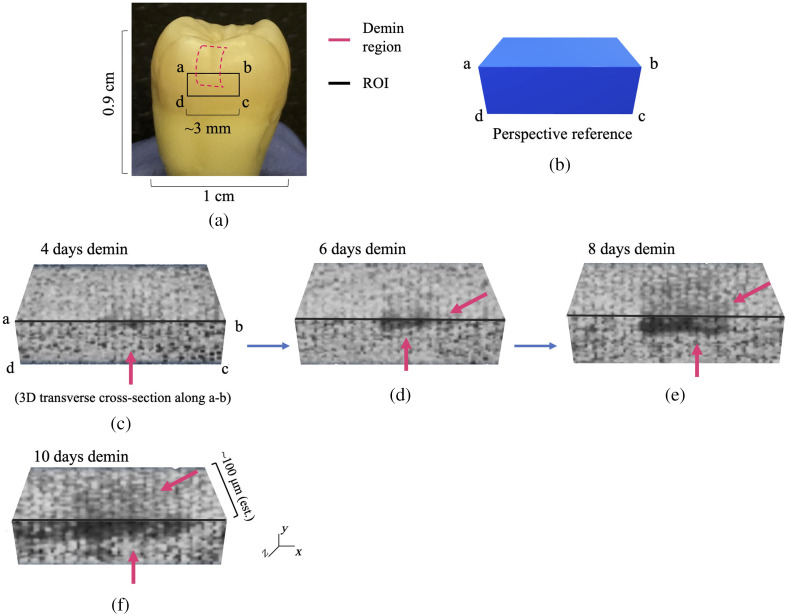
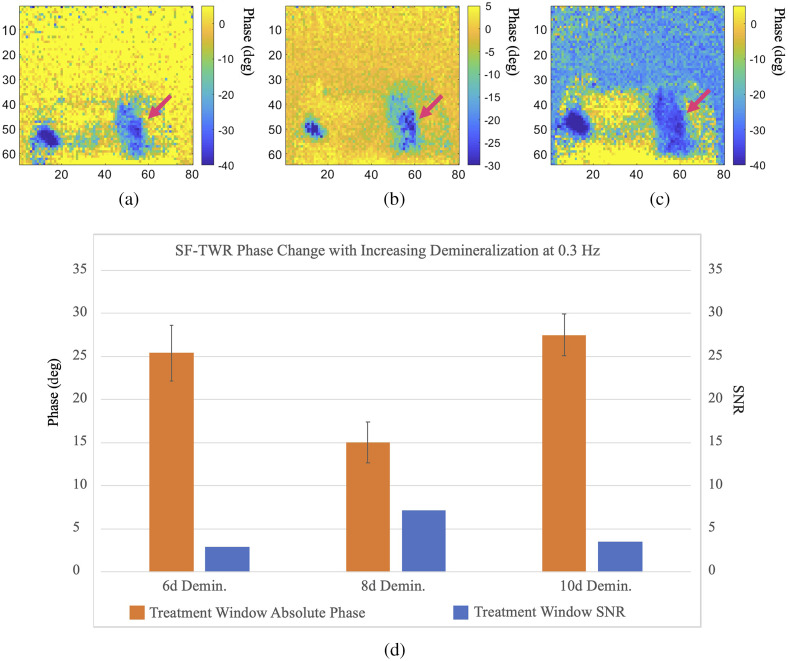
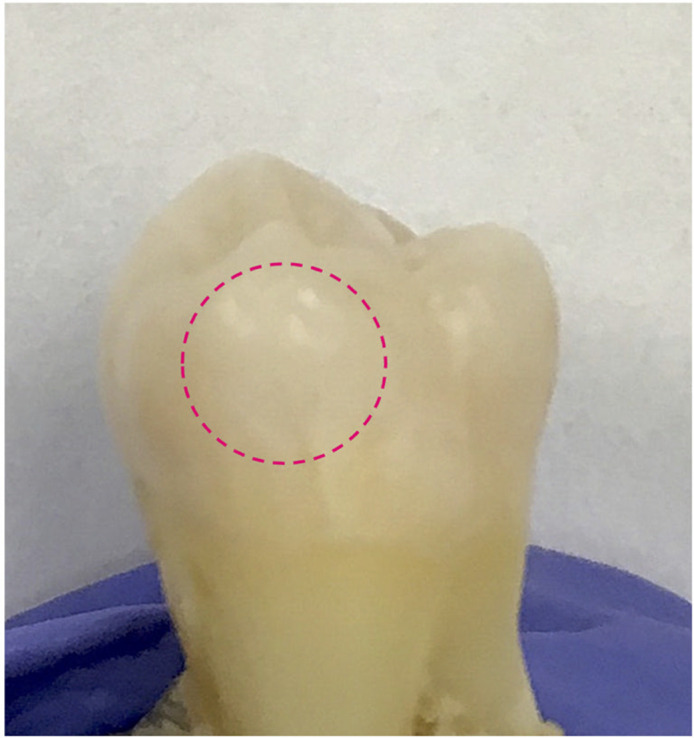
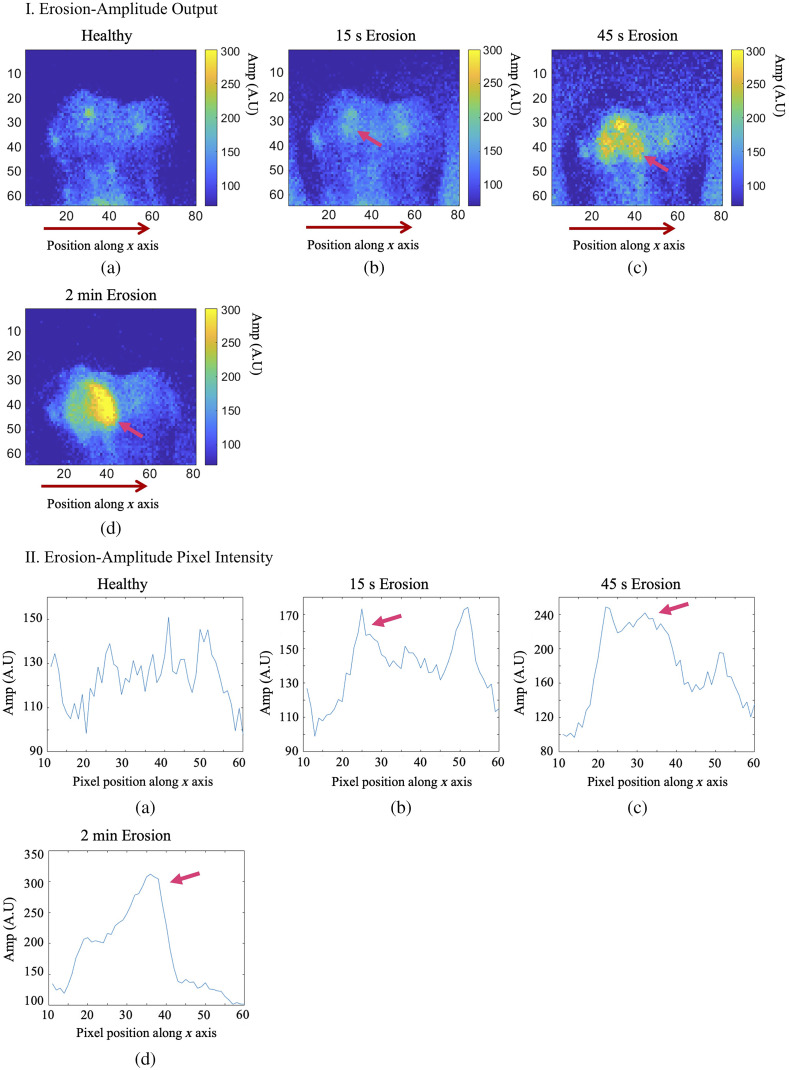
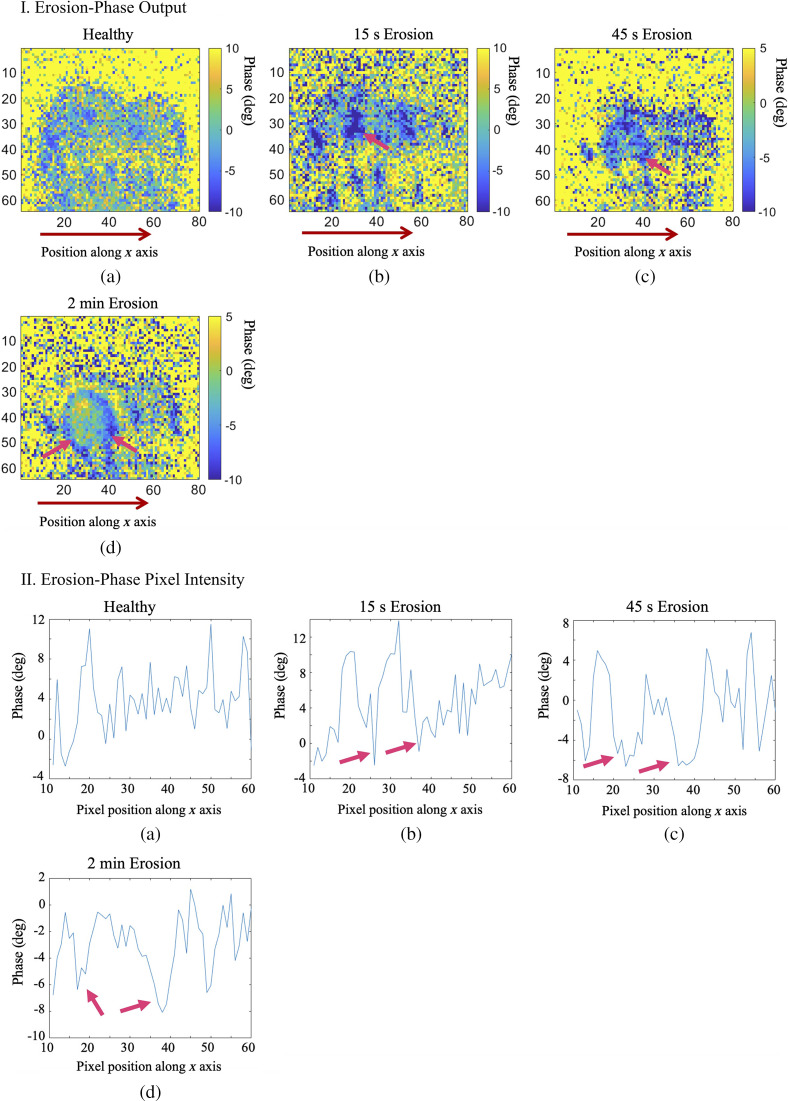
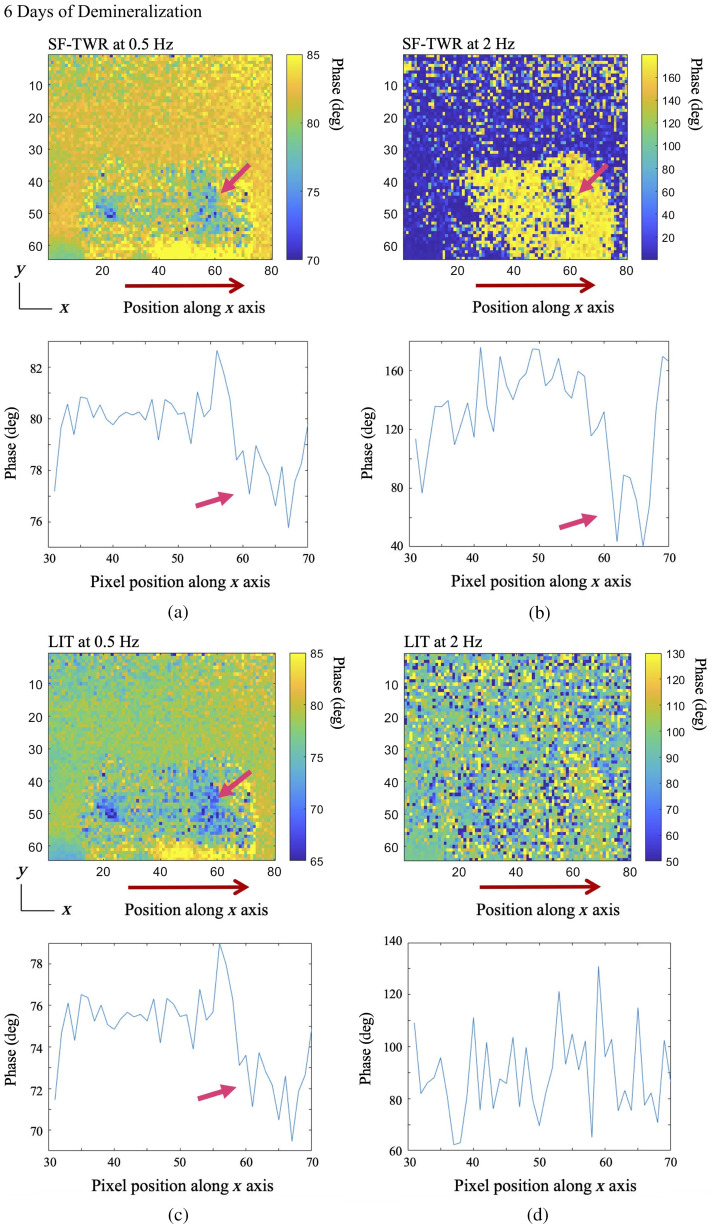
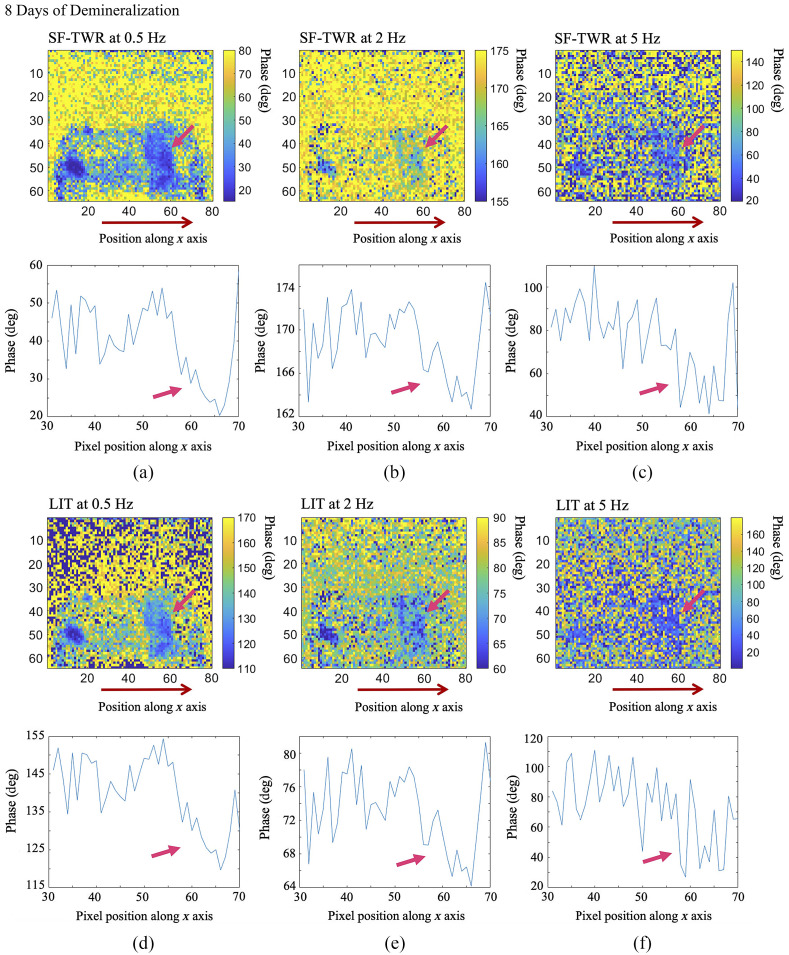
Results: eTC-PCT can detect artificial caries as early as 2 days after onset of artificial demineralization and after 45 s of surface erosion, with a laser power equivalent to 64% of maximum permissible exposure. In both cases, the lesion is not visible to the eye and undetected by x-rays. eTC-PCT is capable of monitoring lesion progression in 2-day increments and generating 3D tomographic reconstructions of the advancing lesion.

Conclusions: eTC-PCT shows great potential for further development as a dental imaging modality combining low detection threshold, high sensitivity to lesion progression, 3D reconstruction capability, and lack of ionizing radiation. These features enable early diagnosis and frequent monitoring, making eTC-PCT a promising technology for facilitating preventive dentistry.

Keywords: active thermography; dental caries detection; dental erosion detection; dental thermal imaging; enhanced truncated-correlation photothermal coherence tomography; non-invasive thermophotonic imaging.


Figures

Fig. 1
Fig. 1
eTC-PCT modality: (a) eTC-PCT system schematic and (b) eTC-PCT simplified algorithm flowchart.
Fig. 2
Fig. 2
eTC-PCT slice calculation. (a) Typical raw thermal relaxation signal recorded by the IR camera for one pixel (in blue), and the corresponding synthesized reference chirp after delay unit dn (in orange). Slice width WT is selected by the operator and the delay unit dn is incremented as multiples n of WT, where n is the slice number. Cross correlation is calculated at each dn. (b) Typical CC result of the synthesized reference chirp signal and the IR thermal relaxation signal for one pixel at d=0 (i.e., the initial slice with n=0). Note the very narrow FWHM of the CC, the key feature of high axial resolution of eTC-PCT despite the diffusive nature of the thermal wave.
Fig. 3
Fig. 3
SF-TWR system. SF-TWR simplified algorithm flowchart.
Fig. 4
Fig. 4
Samples D1 (a) and D2 (b). The digitally added pink outlines designate the treatment window on each sample.
Fig. 5
Fig. 5
Longitudinal demineralization results from the eTC-PCT amplitude channel. Each image is the first 2D slice of the eTC-PCT output, containing the near-surface data. Part I (a)–(f) and part II (a)–(f) The evolution of eTC-PCT amplitude results for D1 and D2, respectively, from a healthy state to having had the treatment windows exposed to the artificial demineralization solution for 10 days, creating growing caries (marked with the pink arrow). The caries signal intensity is directly related to its severity. However, after day 6, the amplitude data become saturated and the images cannot reliably show the progression of the lesion. This may be due to the well-known photothermal saturation effect that occurs at high absorption coefficient values. The highly absorbing regions on the left and bottom of the tooth surface are due to a pre-existing lesion and the cementum, respectively. Dimensions for all images: W=1.25  cm (±0.1), H=1  cm (±0.1).
Fig. 6
Fig. 6
Longitudinal demineralization results from the eTC-PCT phase channel. Each image is the first 2D slice of the eTC-PCT output, containing the near-surface data. Part I (a)–(f) and part II (a)–(f) The evolution of eTC-PCT phase results for D1 and D2, respectively, from a healthy state to having had the treatment window exposed to the artificial demineralization solution for 10 days, creating growing caries (marked with the pink arrow). The phase output exhibits an opposite trend to that of the amplitude, with caries exhibiting a lower phase value than healthy enamel, due to near-surface absorption of photons. Dimensions for all images: W=1.25  cm (±0.1), H=1  cm (±0.1).
Fig. 7
Fig. 7
Quantification of eTC-PCT phase data from the treatment window on sample D1. While a generally positive trend is observed in the absolute value of the phase difference between the untreated and the increasingly demineralized treatment window, this value is prone to day-to-day experimental fluctuations. The treatment window SNR, however, shows a much more consistent trend and is less affected by experimental condition variations, making it a reliable indicator of caries progression. The first column from the left presents the treatment window phase data before any acid exposure, which show a high level of standard deviation (e.g., noise), as is typical of healthy enamel signals. Note that the plot presents the “absolute value” of the phase difference for better visualization. The actual phase of the demineralized region is lower than the healthy region.
Fig. 8
Fig. 8
eTC-PCT 3D phase reconstruction of caries progression in sample D1. (a) Marked demineralization treatment region (pink outline) and the ROI on the tooth surface, the dental tissue behind which was reconstructed in 3D using the depth profilometry capability of eTC-PCT. (b) 3D perspective for the eTC-PCT 3D reconstructions. The intact (healthy) state of the treatment window is shown in 3D in (c), where the same ROI as marked in (a) is the front surface of the right parallelepiped cross-section, and the top surface shows the hidden “inside” of the tooth behind this surface ROI, as if the tooth has been cut along line a-b. (d)–(h) eTC-PCT 3D phase reconstructions of the progression of the artificial carious lesion for up to 10 days of acid exposure. The demineralized carious range, a progressively spreading dark region, is marked with pink arrows. In all 3D figures, the subsurface layers along the z-axis of the image are not on the same scale as the x-y plane. The scaling was performed to provide better visibility for the subsurface layers. These images demonstrate the tomographic capability of the eTC-PCT phase channel to detect caries as early as 4 days after the onset of treatment and to monitor its progression inside the tooth with high sensitivity.
Fig. 9
Fig. 9
eTC-PCT 3D phase reconstruction of caries progression in sample D2. Similar to Fig. 8, (a) shows the marked demineralization treatment region (pink outline) and the ROI on the tooth surface. (b) The perspective reference for the 3D images. (c)–(f) The progression of caries inside the tooth along line a-b, behind the ROI surface. The results present the eTC-PCT 3D phase reconstructions of the lesion for up to 10 days of acid exposure. The demineralized carious region is marked with pink arrows and is the progressively spreading dark region on the tooth surface and inside the tooth enamel. In all 3D figures, the subsurface layers on the z-axis of the image are not on the same scale as the x-y plane. The scaling was performed to provide better visibility for the subsurface layers.
Fig. 10
Fig. 10
The 0.3-Hz SF-TWR longitudinal early caries imaging. (a)–(c) The SF-TWR phase images of sample D1 for early caries progression from 6 days to 10 days of demineralization. (d) The statistical data extracted from each image. While SF-TWR has high sensitivity for early caries with high SNR and contrast, it does not provide a reliable indicator of lesion progress. Dimensions for all images: W=1.25  cm (±0.1), H=1  cm (±0.1).
Fig. 11
Fig. 11
Visible light image of healthy tooth sample used for the dental surface erosion study. The surface of sample E1 used for this study shown here was assessed by a practicing dentist as healthy (ICDAS II score of 0). The image shows the tooth surface after 2 min of artificial erosion with the treatment region marked inside the pink circle.
Fig. 12
Fig. 12
eTC-PCT amplitude channel results for imaging of artificial dental surface erosion on sample E1. Parts I and II present the imaging results and pixel intensity plots, respectively. The pixel intensity plots average the intensity of the pixels located on the tooth along the x-axis positions 10 to 60, also marked by the red arrow below each image. The signal from the eroded region is marked with pink arrows in these images. The amplitude channel provides relatively high sensitivity and SNR to dental erosion. Dimensions for all images: W=1.25  cm (±0.1), H=1  cm (±0.1).
Fig. 13
Fig. 13
eTC-PCT phase channel results for imaging of artificial dental surface erosion on sample E1. Parts I and II present the imaging results and pixel intensity plots, respectively. The pixel intensity plots average the intensity of the pixels located on the tooth along the x-axis positions 10 to 60, also marked by the red arrow below each image. The signal from the eroded region is marked with pink arrows in these images. Compared with the amplitude channel, the phase channel provides lower sensitivity to change and lower SNR for dental erosion. Dimensions for all images: W=1.25  cm (±0.1), H=1  cm (±0.1).
Fig. 14
Fig. 14
3D reconstruction of the erosion lesion on tooth E1. (a) The visible light image of E1, with the eroded treatment window outlined in a pink circle. (b) The 3D reconstruction of the surface erosion using the eTC-PCT amplitude delay channel data. The erosive depression on the tooth surface can be seen on the left side of the 3D reconstruction.
Fig. 15
Fig. 15
Comparison of SF-TWR and LIT outputs for imaging early artificially generated dental caries at 6 days of artificial demineralization on sample D1. Below each image, a corresponding pixel intensity plot is provided. The plots average the intensity of the pixels located on the tooth along the x-axis positions 30 to 70, marked by the red arrow below each image. The pink arrows mark the demineralized treatment window in each image/plot. It is observed that, while LIT and SF-TWR provide similar results at 0.5 Hz, SF-TWR provides higher SNR and detail at a higher frequency (2 Hz). Dimensions for all images: W=1.25  cm (±0.1), H=1  cm (±0.1).
Fig. 16
Fig. 16
Comparison of SF-TWR and LIT outputs for imaging early artificially generated dental caries at 8 days of artificial demineralization on sample D1. Below each image, a corresponding pixel intensity plot is provided. The plots average the intensity of the pixels located on the tooth along the x-axis positions 30 to 70, marked by the red arrow below each image. The pink arrows mark the demineralized treatment window in each image/plot. Similar to Fig. 15, it is observed that, while LIT and SF-TWR provide similar results at lower frequencies, SF-TWR provides higher SNR and detail as frequency is increased. Dimensions for all images: W=1.25  cm (±0.1), H=1  cm (±0.1).

Similar articles

Cited by

References

    1. Jorgensen R. S., Thibodeau R., “Defensive avoidance of disapproval: the relationship of a defensive style to physical and mental health,” Harv. Rev. Psychiatry 15, 9–17 (2007).HRPSEP10.1080/10673220601183923 - DOI - PubMed
    1. Technology in the National Health and Nutrition Examination Survey, “U.S. National Institute of Dental and Craniofacial Research,” 2004, http://www.nidcr.nih.gov/DataStatistics/FindDataByTopic/DentalCaries/Den....
    1. Canadian Dental Association, The State of Oral Health in Canada, “Canadian Dental Association,” pp. 1–25, 2017, https://www.cda-adc.ca/stateoforalhealth/_files/TheStateofOralHealthinCa... (accessed 21 August 2019).
    1. Ashley P., “Book review: essentials of dental caries: the disease and its management,” Primary Dental Care os13(3), 92 (2006).10.1308/135576106777795626 - DOI
    1. Jeon R. J., et al. , “Dental diagnostic clinical instrument (‘Canary’) development using photothermal radiometry and modulated luminescence,” J. Phys. Conf. Ser. 214, 012023 (2010).JPCSDZ10.1088/1742-6596/214/1/012023 - DOI

Publication types

Grants and funding