Segmentation of the Prostate Transition Zone and Peripheral Zone on MR Images with Deep Learning
- PMID: 33929265
- PMCID: PMC8189171
- DOI: 10.1148/rycan.2021200024
Segmentation of the Prostate Transition Zone and Peripheral Zone on MR Images with Deep Learning
Abstract
Purpose To develop a deep learning model to delineate the transition zone (TZ) and peripheral zone (PZ) of the prostate on MR images. Materials and Methods This retrospective study was composed of patients who underwent a multiparametric prostate MRI and an MRI/transrectal US fusion biopsy between January 2013 and May 2016. A board-certified abdominal radiologist manually segmented the prostate, TZ, and PZ on the entire data set. Included accessions were split into 60% training, 20% validation, and 20% test data sets for model development. Three convolutional neural networks with a U-Net architecture were trained for automatic recognition of the prostate organ, TZ, and PZ. Model performance for segmentation was assessed using Dice scores and Pearson correlation coefficients. Results A total of 242 patients were included (242 MR images; 6292 total images). Models for prostate organ segmentation, TZ segmentation, and PZ segmentation were trained and validated. Using the test data set, for prostate organ segmentation, the mean Dice score was 0.940 (interquartile range, 0.930-0.961), and the Pearson correlation coefficient for volume was 0.981 (95% CI: 0.966, 0.989). For TZ segmentation, the mean Dice score was 0.910 (interquartile range, 0.894-0.938), and the Pearson correlation coefficient for volume was 0.992 (95% CI: 0.985, 0.995). For PZ segmentation, the mean Dice score was 0.774 (interquartile range, 0.727-0.832), and the Pearson correlation coefficient for volume was 0.927 (95% CI: 0.870, 0.957). Conclusion Deep learning with an architecture composed of three U-Nets can accurately segment the prostate, TZ, and PZ. Keywords: MRI, Genital/Reproductive, Prostate, Neural Networks Supplemental material is available for this article. © RSNA, 2021.
Keywords: Genital/Reproductive; MRI; Neural Networks; Prostate.
Conflict of interest statement
Figures
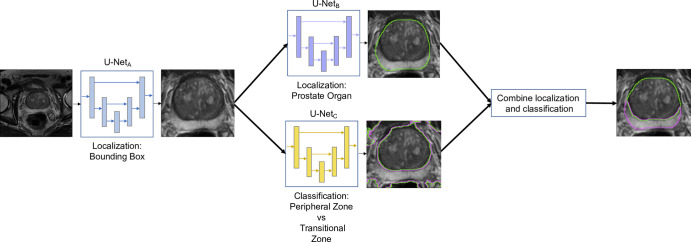
![A, U-NetA neural network architecture. U-NetA localizes the prostate
by creating a bounding box around it and narrows the field of view (see
Appendix E1 [supplement]). The image is processed with nine layers that
consist of convolutions (Convs), batch normalization (Batch Norm), and
rectified linear unit (ReLU) activation. Both the contraction and expansion
pathways use convolutional kernels that have 1 × 3 × 3 and 2
× 1 × 1 filters. The image is downsampled to a 1 × 1
× 1 matrix before it is upsampled. B, U-NetB neural network
architecture. U-NetB completes prostate organ segmentation by classifying
each pixel as either belonging to the prostate or background. The image is
processed with six layers that consist of convolutions, batch normalization,
and ReLU activation. The contraction and expansion pathways use
convolutional kernels that have 1 × 3 × 3 and 2 × 1
× 1 filters. The image is collapsed to a 1 × 8 × 8
image before it is expanded. C, U-NetC neural network architecture. U-NetC
differentiates between transition zone and peripheral zone by classifying
every voxel in the image as one of these two classes. This classification
then identifies the border between these two prostate regions. U-NetC has
the same architecture as U-NetB and implements six layers that perform
convolutions, batch normalization, and ReLU activation. The convolutional
kernels use 1 × 3 × 3 and 2 × 1 × 1 filters. The
image is downsampled to a 1 × 8 × 8 image before it is
upsampled. 3D = three dimensional, 2D = two dimensional.](https://cdn.ncbi.nlm.nih.gov/pmc/blobs/f74e/8189171/c6928547afc8/rycan.2021200024.fig4.jpg)
References
-
- Siegel RL, Miller KD, Jemal A. Cancer statistics, 2016. CA Cancer J Clin 2016;66(1):7–30. - PubMed
-
- Bray F, Ferlay J, Soerjomataram I, Siegel RL, Torre LA, Jemal A. Global cancer statistics 2018: GLOBOCAN estimates of incidence and mortality worldwide for 36 cancers in 185 countries. CA Cancer J Clin 2018;68(6):394–42.[Published correction appears in CA Cancer J Clin 2020;70(4):313.]. - PubMed
-
- Schröder FH, Hugosson J, Roobol MJ, et al. Screening and prostate-cancer mortality in a randomized European study. N Engl J Med 2009;360(13):1320–1328. - PubMed
-
- Hugosson J, Carlsson S. Overdetection in screening for prostate cancer. Curr Opin Urol 2014;24(3):256–263. - PubMed