. 2021 Jun;10(11):e2002227.
doi: 10.1002/adhm.202002227. Epub 2021 Apr 30.

The Influence of Ligand Density and Degradability on Hydrogel Induced Breast Cancer Dormancy and Reactivation

Affiliations

The Influence of Ligand Density and Degradability on Hydrogel Induced Breast Cancer Dormancy and Reactivation

Cindy J Farino Reyes et al. Adv Healthc Mater. 2021 Jun.

Abstract

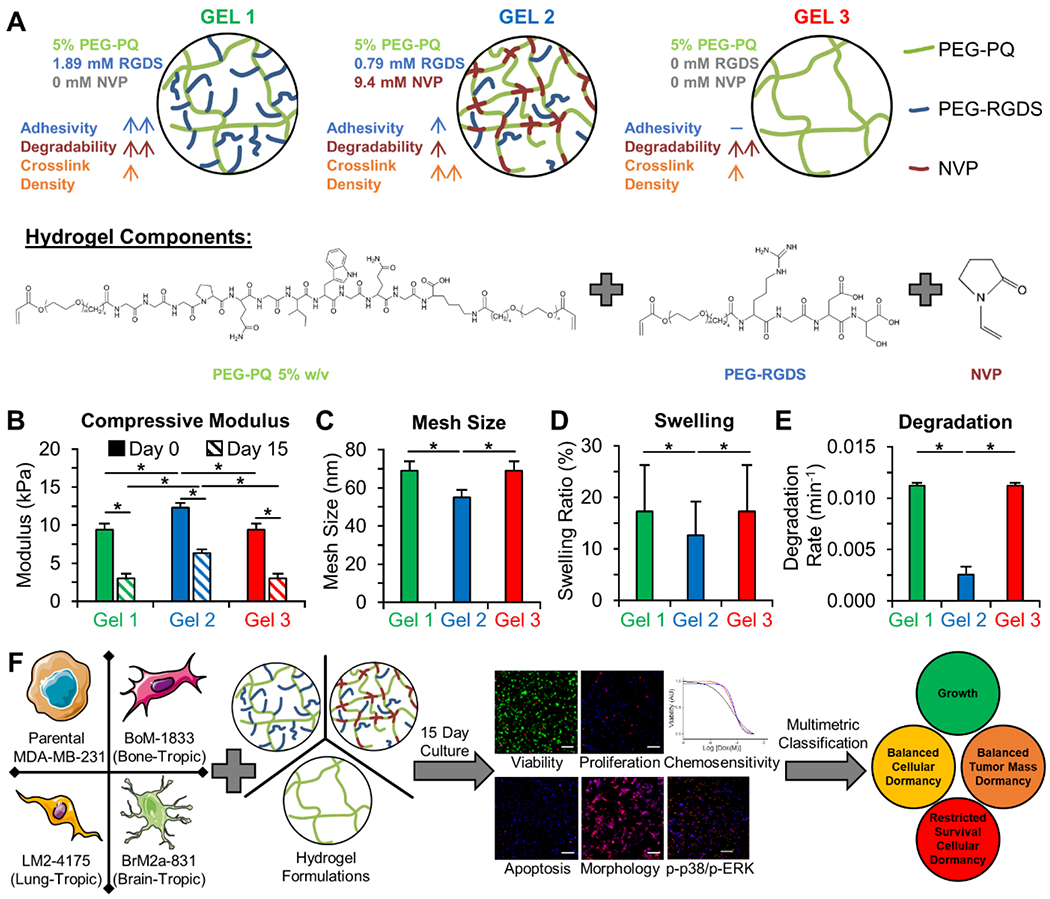
The role of hydrogel properties in regulating the phenotype of triple negative metastatic breast cancer is investigated using four cell lines: the MDA-MB-231 parental line and three organotropic sublines BoM-1833 (bone-tropic), LM2-4175 (lung-tropic), and BrM2a-831 (brain-tropic). Each line is encapsulated and cultured for 15 days in three poly(ethylene glycol) (PEG)-based hydrogel formulations composed of proteolytically degradable PEG, integrin-ligating RGDS, and the non-degradable crosslinker N-vinyl pyrrolidone. Dormancy-associated metrics including viable cell density, proliferation, metabolism, apoptosis, chemoresistance, phosphorylated-ERK and -p38, and morphological characteristics are quantified. A multimetric classification approach is implemented to categorize each hydrogel-induced phenotype as: 1) growth, 2) balanced tumor dormancy, 3) balanced cellular dormancy, or 4) restricted survival, cellular dormancy. Hydrogels with high adhesivity and degradability promote growth. Hydrogels with no adhesivity, but high degradability, induce restricted survival, cellular dormancy in the parental line and balanced cellular dormancy in the organotropic lines. Hydrogels with reduced adhesivity and degradability induce balanced cellular dormancy in the parental and lung-tropic lines and balanced tumor mass dormancy in bone- and brain-tropic lines. The ability to induce escape from dormancy via dynamic incorporation of RGDS is also presented. These results demonstrate that ECM properties and organ-tropism synergistically regulate cancer cell phenotype and dormancy.

Keywords: extracellular matrix; latency; organotropic; tissue engineering.


Conflict of interest statement

Conflicts of Interest

The authors declare no conflicts of interest.

Figures

Figure 1:
Figure 1:. Hydrogel Characterization & Experimental Workflow.
(A) Schematic of three hydrogel formulations with different adhesivity, degradability, and crosslink density implemented to induce growth (Gel 1), balanced cellular dormancy (Gel 2), or restricted survival cellular dormancy (Gel 3) in parental MDA-MB-231s. Chemical structures of hydrogel components: PEG-PQ, PEG-RGDS, and n-vinyl pyrrolidinone (NVP). Quantification of the (B) compressive modulus of cell-laden hydrogels at day 0 (solid) and 15 (striped), (C) mesh size, (D) swelling ratio, and (E) degradation rate. * indicates p<0.05 determined by one-way ANOVA. n=4 hydrogels per condition. Values represent mean + standard deviation. (F) Schematic of the experimental workflow involving culture of four breast cancer cell lines within three different hydrogel formulations, quantification of cellular behavior, and implementation of multimetric classification of hydrogel-induced cellular phenotypes.
Figure 2:
Figure 2:. Cell Viability.
(A) Representative maximum intensity z-projections from 3D image stacks of MDA-MB-231s (parental), BoM-1833s (bone-tropic), LM2-4175s (lung-tropic), and BrM2a-831s (brain-tropic) on day 0 (Gel 1, 6 hr post encapsulation) or day 15 within each hydrogel formulation. Cells were labeled with calcein AM (green: live cells) and ethidium homodimer (red: dead cells). Scale bar = 100 μm. Quantification of (B) cell viability on day 15 and (C) viable cell ratio (the number of viable cells at day 15 normalized to day 0). (C) Dashed line indicates a ratio of 1.0 (no change in the number of viable cells). (B) * indicates p<0.05 determined by a one-way ANOVA. (C) * indicates p<0.05 compared to the value 1 determined by a 2-sample t-test. n=5 z-stacks from 5 individual hydrogels. Values represent mean + standard deviation.
Figure 3:
Figure 3:. Early Apoptosis.
(A) Representative maximum intensity z-projections from 3D image stacks of MDA-MB-231s (parental), BoM-1833s (bone-tropic), LM2-4175s (lung-tropic), and BrM2a-831s (brain-tropic) on day 0 (Gel 1, 6 hr post encapsulation) or day 15 within each hydrogel formulation. Cells were labeled with the early apoptosis marker Annexin V (red: apoptotic cells) and Hoechst (blue: nuclei). Scale bar = 100 μm. (B) Quantification of Annexin V+ cells on day 15. * indicates p<0.05 determined by a one-way ANOVA. n=5 z-stacks from 5 individual hydrogels. Values represent mean + standard deviation.
Figure 4:
Figure 4:. Proliferation.
(A) Representative maximum intensity z-projections from 3D image stacks of MDA-MB-231s (parental), BoM-1833s (bone-tropic), LM2-4175s (lung-tropic), and BrM2a-831s (brain-tropic) on day 0 (Gel 1, 6 hr post encapsulation) or day 15 within each hydrogel formulation. Cells were labeled with EdU (red: proliferative cells) and Hoechst (blue: nuclei). Scale bar = 100 μm. (B) Quantification of the percentage of EdU+ cells on day 15. (C) Quantification of the EdU+ cell ratio (the number of EdU+ cells on day 15 normalized to day 0). (C) Dashed line indicates a ratio of 1.0 (no change in the number of actively proliferating cells). (C) * indicates p<0.05 compared to the value 1.0 determined by a 2-sample t-test. n=5 z-stacks from 5 individual hydrogels. Values represent mean + standard deviation.
Figure 5:
Figure 5:. Ratiometric Analysis of Cell Viability, Death, & Metabolic Activity.
(A) Ratio of new live to new dead cells formed in the hydrogels post day 0 as observed on day 15. Dashed line represents a ratio of 1.0 (indicating a perfect balance between the number of new live and dead cells formed in the gels post day 0). (B) Ratio of EdU+ cells to Annexin V+ cells at day 15. Dashed line indicates a ratio of 1.0 (indicating a perfect balance between proliferation and apoptosis). (C) Quantification of relative metabolic activity on day 15, normalized to day 0. Dashed line indicates a ratio of 1.0 (no change in metabolic activity post day 0). * indicates p<0.05 compared to the value 1.0 determined by a 2-sample t-test. n=5 z-stacks from 5 individual hydrogels. Values represent mean + standard deviation.
Figure 6:
Figure 6:. Morphological Analysis of Solitary Single Cells & Cell Clusters.
(A) Representative maximum intensity z-projections from 3D image stacks of MDA-MB-231s (parental), BoM-1833s (bone-tropic), LM2-4175s (lung-tropic), and BrM2a-831s (brain-tropic) after 15 days in culture. Cells were labeled with phalloidin (red: F-actin) and Hoechst (blue: nuclei). Scale bar = 100 μm. Quantification of (B) ratio of solitary single cells to cells residing in clusters, (C) percentage of round single cells, (D) percentage of round cell clusters, (E) cluster diameter, (F) cluster density, and (G) single cell density within the hydrogels. * indicates p<0.05 determined by a one-way ANOVA. n=5 z-stacks from 5 individual hydrogels. Values represent mean + standard deviation.
Figure 7:
Figure 7:. Chemosensitivity to Doxorubicin.
(A) Representative maximum intensity z-projections from 3D image stacks of live (calcein AM: green) BoM-1833s (bone-tropic) after 15 days in culture followed by 48 hr exposure to doxorubicin at the indicated concentration. Scale bar = 100 μm. Dose-response curves and IC50 and EC50 values for (B) MDA-MB-231s (parental), (C) BoM-1833s (bone-tropic), (E) LM2-4175s (lung-tropic), and (F) BrM2a-831s (brain-tropic) cell lines. Calculated (D) EC50 and (G) IC50 values. * indicates p<0.05 determined by a one-way ANOVA. n=6 z-stacks from 6 individual hydrogels. Values represent mean ± standard deviation.
Figure 8:
Figure 8:. Phosphorylated p38 & ERK Expression.
(A) Representative maximum intensity z-projections from 3D image stacks of MDA-MB-231s (parental) cultured in the three hydrogel formulations that were fixed and fluorescently labeled for phosphorylated p38 (p-p38: red) and phosphorylated ERK (p-ERK: green) and counterstained with Hoechst (nuclei: blue). Scale bar = 100 μm. Quantification of (B) p-ERK mean fluorescence intensity, (C) p-p38 mean fluorescence intensity, and (D) p-ERK:p-p38 mean fluorescence intensity ratio for MDA-MB-231s (parental), BoM-1833s (bone-tropic), LM2-4175s (lung-tropic), and BrM2a-831s (brain-tropic) after 15 days in culture in the indicated hydrogel formulation. * indicates p<0.05 determined by a one-way ANOVA. n=5 z-stacks from 5 individual hydrogels. Values represent mean + standard deviation.
Figure 9:
Figure 9:. Defining Hydrogel-Induced Phenotypes Via Multimetric Classification.
(A) Phenotypic states were defined initially by a ground truth metric and subsequently supported by additional metrics. Balanced dormancy was further characterized as cellular or tumor mass via the single cell:clustered cell ratio. (B) Values for measured metrics and classified phenotypic states. The highlighted values indicate that the cells reside in the following states: growth (green), balanced cellular dormancy (yellow), balanced tumor mass dormancy (brown), and restricted survival cellular dormancy (red). The red and green text for two values in gel 2 indicate those that differed from the definitions used for classification. * indicates significant difference (p<0.05) from the value 1.0 determined by a 2-sample t-test.
Figure 10:
Figure 10:. Reactivation of Dormant Cells.
(A) Representative maximum intensity z-projections from 3D image stacks of dormant MDA-MB-231s (parental), BoM-1833s (bone-tropic), LM2-4175s (lung-tropic), and BrM2a-831s (brain-tropic) cultured in gel 3 (0 mM RGDS, 0 mM NVP) at day 15 (columns 1 and 2). At day 15, 10 mM PEG-RGDS was dynamically incorporated into the hydrogel via photocoupling, and the cells cultured for an additional 7 days (22 days total) (columns 3 and 4). Cells were labeled with calcein AM (green: live cells) and ethidium homodimer (red: dead cells) (columns 1 and 3), or EdU (red: proliferative cells) and Hoechst (blue: nuclei) (columns 2 and 4). Quantification of (B) percent viability at day 15 and day 22 and (C) the number of viable cells at day 22 relative to day 15 prior to RGDS incorporation. Quantification of the (D) percent of the cell population EdU+ at day 15 and 22 and (E) number of EdU+ cells at day 22 relative to day 15. * indicates statistically significant difference (p<0.05) determined by a one-way ANOVA in (B) and (D) or a 2-sample t-test in (C) and (E). n=6 z-stacks from 6 individual hydrogels. Values represent mean + standard deviation.

References

    1. Facts Cancer & Figures 2019. American Cancer Society. (2019).
    1. Chaffer CL & Weinberg RA A perspective on cancer cell metastasis. Science (New York, N.Y.) 331, 1559–1564, doi:10.1126/science.1203543 (2011). - DOI - PubMed
    1. Aguirre-Ghiso JA Models, mechanisms and clinical evidence for cancer dormancy. Nature reviews. Cancer 7, 834–846, doi:10.1038/nrc2256 (2007). - DOI - PMC - PubMed
    1. Phan TG & Croucher PI The dormant cancer cell life cycle. Nature reviews. Cancer 20, 398–411, doi:10.1038/s41568-020-0263-0 (2020). - DOI - PubMed
    1. Aguirre-Ghiso JA, Soledad Sosa M Emerging Topics on Disseminated Cancer Cell Dormancy and the Paradigm of Metastasis. Annual Review of Cancer Biology (2018).

Publication types