Review
. 2021 Sep 1;94(1125):20210157.
doi: 10.1259/bjr.20210157. Epub 2021 Apr 30.

Ovary: MRI characterisation and O-RADS MRI

Affiliations
Review

Ovary: MRI characterisation and O-RADS MRI

Elizabeth A Sadowski et al. Br J Radiol. .

Abstract

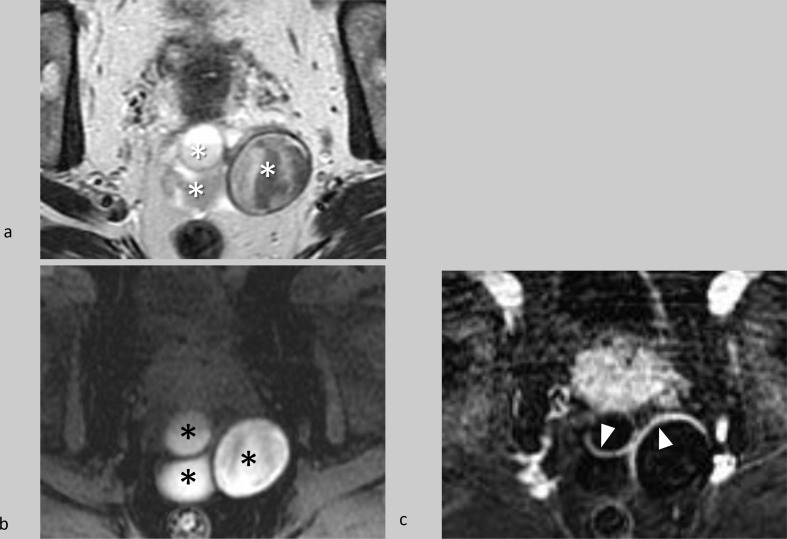
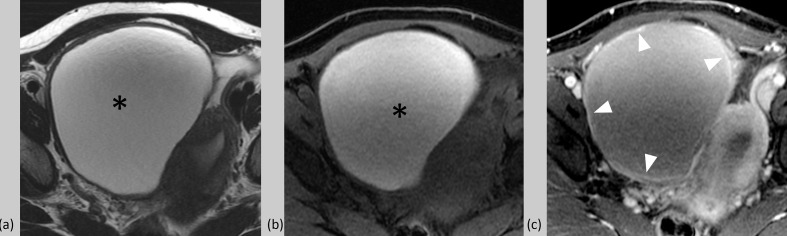
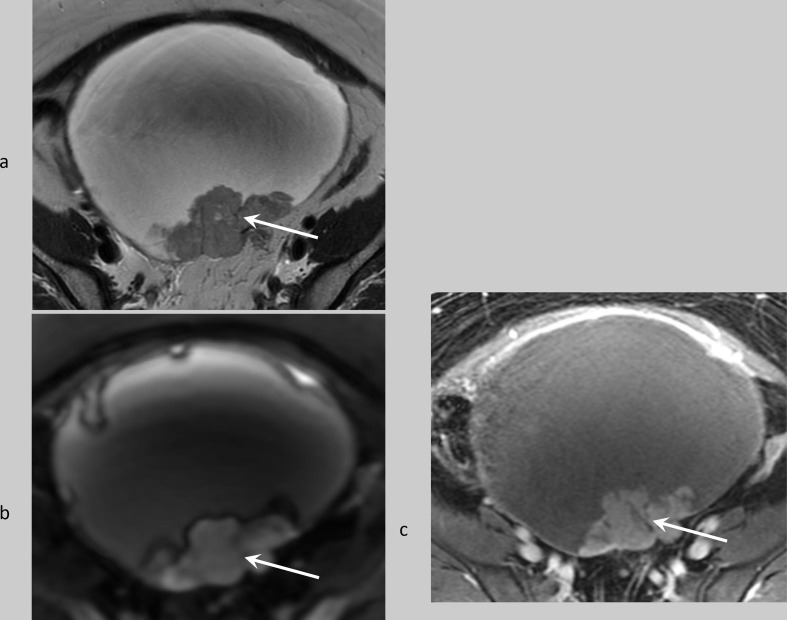
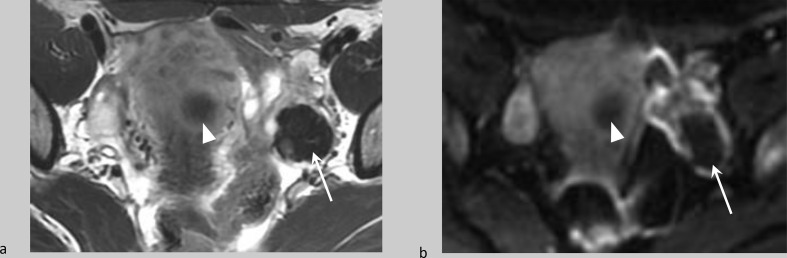
Ultrasound has a high specificity for the diagnosis of a benign lesion in cases of classic appearing simple cyst, hemorrhagic cyst, endometrioma and dermoid. However, ultrasound can sometimes be limited for definitive characterisation and risk stratification of other types of lesions, including those with echogenic content that may appear solid, with or without blood flow. Frequently, MRI can be used to further characterise these types of lesions, due to its ability to distinguish solid tissue from non-tissue solid components such as fat, blood, or debris. Incorporating the MR imaging into the evaluation of adnexal lesions can improve diagnostic certainty and guide clinical management potentially avoiding inappropriate surgery for benign lesions and expediting appropriate treatment for malignant lesions, particularly in the females with sonographically indeterminate adnexal lesions.


Figures

Figure 1.
Figure 1.
This figure is reproduced by permission of ACR. O-RADS MRI Risk Stratification System. ^Approximate PPV based on data from Thomassin-Naggara, et al. O-RADS MRI Score for Risk Stratification of Sonographically Indeterminate Adnexal Masses. JAMA Network Open. 2020;3(1):e1919896. Please note that the PPV provided applies to the score category overall and not to individual characteristics. Definitive PPV are not currently available for individual characteristics. The PPV values for malignancy include both borderline tumours and invasive cancers. * Solid tissue is defined as a lesion component that enhances and conforms to one of these morphologies: papillary projection, mural nodule, irregular septation/wall or other larger solid portions. ** Minimal enhancement of Rokitansky nodules in lesion containing lipid does not change to O-RADS MRI 4. *** Hemorrhagic cyst <3 cm in pre-menopausal female is O-RADS MRI 1. DCE, Dynamic contrast enhancement with a time resolution of 15 sec or less; DWI, Diffusion weighted images PPV, positive predictive value.
Figure 2.
Figure 2.
Time–intensity curve comparing the enhancing solid tissue in adnexal lesions to the enhancement of the myometrium. (a) Low risk curve with no shoulder and a gradual increase in enhancement over time. (b) Intermediate risk curve with a shoulder and initial slope of enhancement less than or equal to the myometrium. (c) High risk curve with a shoulder and initial slope of enhancement greater than the myometrium.
Figure 3.
Figure 3.
Example of an O-RADS MRI score two lesion with no enhancement on sagittal T1WI (a), T2WI (b) and post-contrast T1WI (c). Unilocular adnexal cyst with T2 hyperintense fluid (black asterisk), T1 hypointense fluid (white asterisk), and no significant wall enhancement on the post-contrast T1WI (arrows). T1WI, T1
Figure 4.
Figure 4.
Example of a dermoid (O-RADS MRI score 2) on selected axial T2WI (a), T1WI (b), fat-saturated T1WI prior to administration of intravenous gadolinium (c), and subtraction post-contrast T1WI (d). This right ovarian dermoid has layering fat (black asterisks), which has signal loss on the fat-suppressed T1W (white asterisk). There is an enhancing Rokitansky nodule (white arrows).T1 WI, T1 weighted imaging.
Figure 5.
Figure 5.
O-RADS MRI score 2 example on selected axial T2WI (a), fat-saturated T1WI (b), and subtraction post-contrast T1WI (c). Multilocular endometrioma with locules of fluid that exhibit variable T2 hypointense signal (white asterisks) and variable hyperintense T1 signal (black asterisks), suggesting blood products of different age. There is enhancement of smooth septations and of the smooth wall (arrowheads). T1WI, T1 weighted imaging.
Figure 6.
Figure 6.
O-RADS MRI score 3 example on selected axial T2WI (a), fat-saturated T1WI (b), and subtraction post-contrast T1WI (c). Haemorrhagic cyst with fluid that is T2 and T1 hyperintense, and an enhancing wall (arrowheads). T1WI, T1 weighted imaging.
Figure 7.
Figure 7.
Example of solid tissue, which is by definition, solid components of an adnexal lesion that enhance and conform to one of these morphologic categories: irregular septations, nodules, papillary projections, or solid lesion. Clear cell carcinoma on selected axial T2WI (a), high B-value DWI (b), and post-contrast T1WI (c) with enhancing nodules (arrows) along the posterior wall of the lesion. DWI, diffusion-weighted imaging; T1WI, T1 weighted imaging.
Figure 8.
Figure 8.
Example of a dark T2/dark DWI adnexal lesion scored a O-RADS MRI 2. Ovarian fibroma (arrows) on selected axial T2WI (a) and B = 1000 DWI (b) which is homogeneous hypointense on T2 and the high B-value DWI image (dark T2/dark DWI) and the same signal intensity characteristics as the incidental uterine fibroid (arrowheads) in keeping with a lesion containing fibrous material. DWI, diffusion-weighted imaging.
Figure 9.
Figure 9.
Examples of O-RADS MRI score 3, 4, five with enhancing solid tissue. O-RADS MRI score three lesion with ehancing solid tissue (white arrow) on selected axial T2WI (a), post-contrast T1WI (b), and corresponding low risk TIC curve (c). O-RADS MRI score 4 lesion with ehancing solid tissue (white arrow) on selected axial T2WI (d), post-contrast T1WI (e), and corresponding intermediate risk TIC curve (f). O-RADS MRI score 5 lesion with ehancing solid tissue (white arrow) on selected axial T2WI (g), post-contrast T1WI (h), and corresponding high risk TIC curve (I). T1 Wi, T1 weighted imaging; TIC, time–intensity curve.

Similar articles

Cited by

References

    1. Buys SS, Partridge E, Greene MH, Prorok PC, Reding D, Riley TL, et al. . Ovarian cancer screening in the prostate, lung, colorectal and ovarian (PLCO) cancer screening trial: findings from the initial screen of a randomized trial. Am J Obstet Gynecol 2005; 193: 1630–9. doi: 10.1016/j.ajog.2005.05.005 - DOI - PubMed
    1. Greenlee RT, Kessel B, Williams CR, Riley TL, Ragard LR, Hartge P, et al. . Prevalence, incidence, and natural history of simple ovarian cysts among women >55 years old in a large cancer screening trial. Am J Obstet Gynecol 2010; 202: 373.e1–373.e9. doi: 10.1016/j.ajog.2009.11.029 - DOI - PMC - PubMed
    1. Sharma A, Apostolidou S, Burnell M, Campbell S, Habib M, Gentry-Maharaj A, et al. . Risk of epithelial ovarian cancer in asymptomatic women with ultrasound-detected ovarian masses: a prospective cohort study within the UK Collaborative trial of ovarian cancer screening (UKCTOCS. Ultrasound Obstet Gynecol 2012; 40: 338–44. doi: 10.1002/uog.12270 - DOI - PubMed
    1. Jacobs IJ, Menon U, Ryan A, Gentry-Maharaj A, Burnell M, Kalsi JK, et al. . Ovarian cancer screening and mortality in the UK Collaborative trial of ovarian cancer screening (UKCTOCS): a randomised controlled trial. Lancet 2016; 387: 945–56. doi: 10.1016/S0140-6736(15)01224-6 - DOI - PMC - PubMed
    1. Atri M, Alabousi A, Reinhold C, Akin EA, Benson CB, Bhosale PR, et al. . ACR appropriateness Criteria® clinically suspected adnexal mass, no acute symptoms. J Am Coll Radiol 2019; 16: S77–93. doi: 10.1016/j.jacr.2019.02.011 - DOI - PubMed