. 2021 Apr;129(4):47014.
doi: 10.1289/EHP7722. Epub 2021 Apr 30.

Risk-Based Chemical Ranking and Generating a Prioritized Human Exposome Database

Affiliations

Risk-Based Chemical Ranking and Generating a Prioritized Human Exposome Database

Fanrong Zhao et al. Environ Health Perspect. 2021 Apr.

Abstract

Background: Due to the ubiquitous use of chemicals in modern society, humans are increasingly exposed to thousands of chemicals that contribute to a major portion of the human exposome. Should a comprehensive and risk-based human exposome database be created, it would be conducive to the rapid progress of human exposomics research. In addition, once a xenobiotic is biotransformed with distinct half-lives upon exposure, monitoring the parent compounds alone may not reflect the actual human exposure. To address these questions, a comprehensive and risk-prioritized human exposome database is needed.

Objectives: Our objective was to set up a comprehensive risk-prioritized human exposome database including physicochemical properties as well as risk prediction and develop a graphical user interface (GUI) that has the ability to conduct searches for content associated with chemicals in our database.

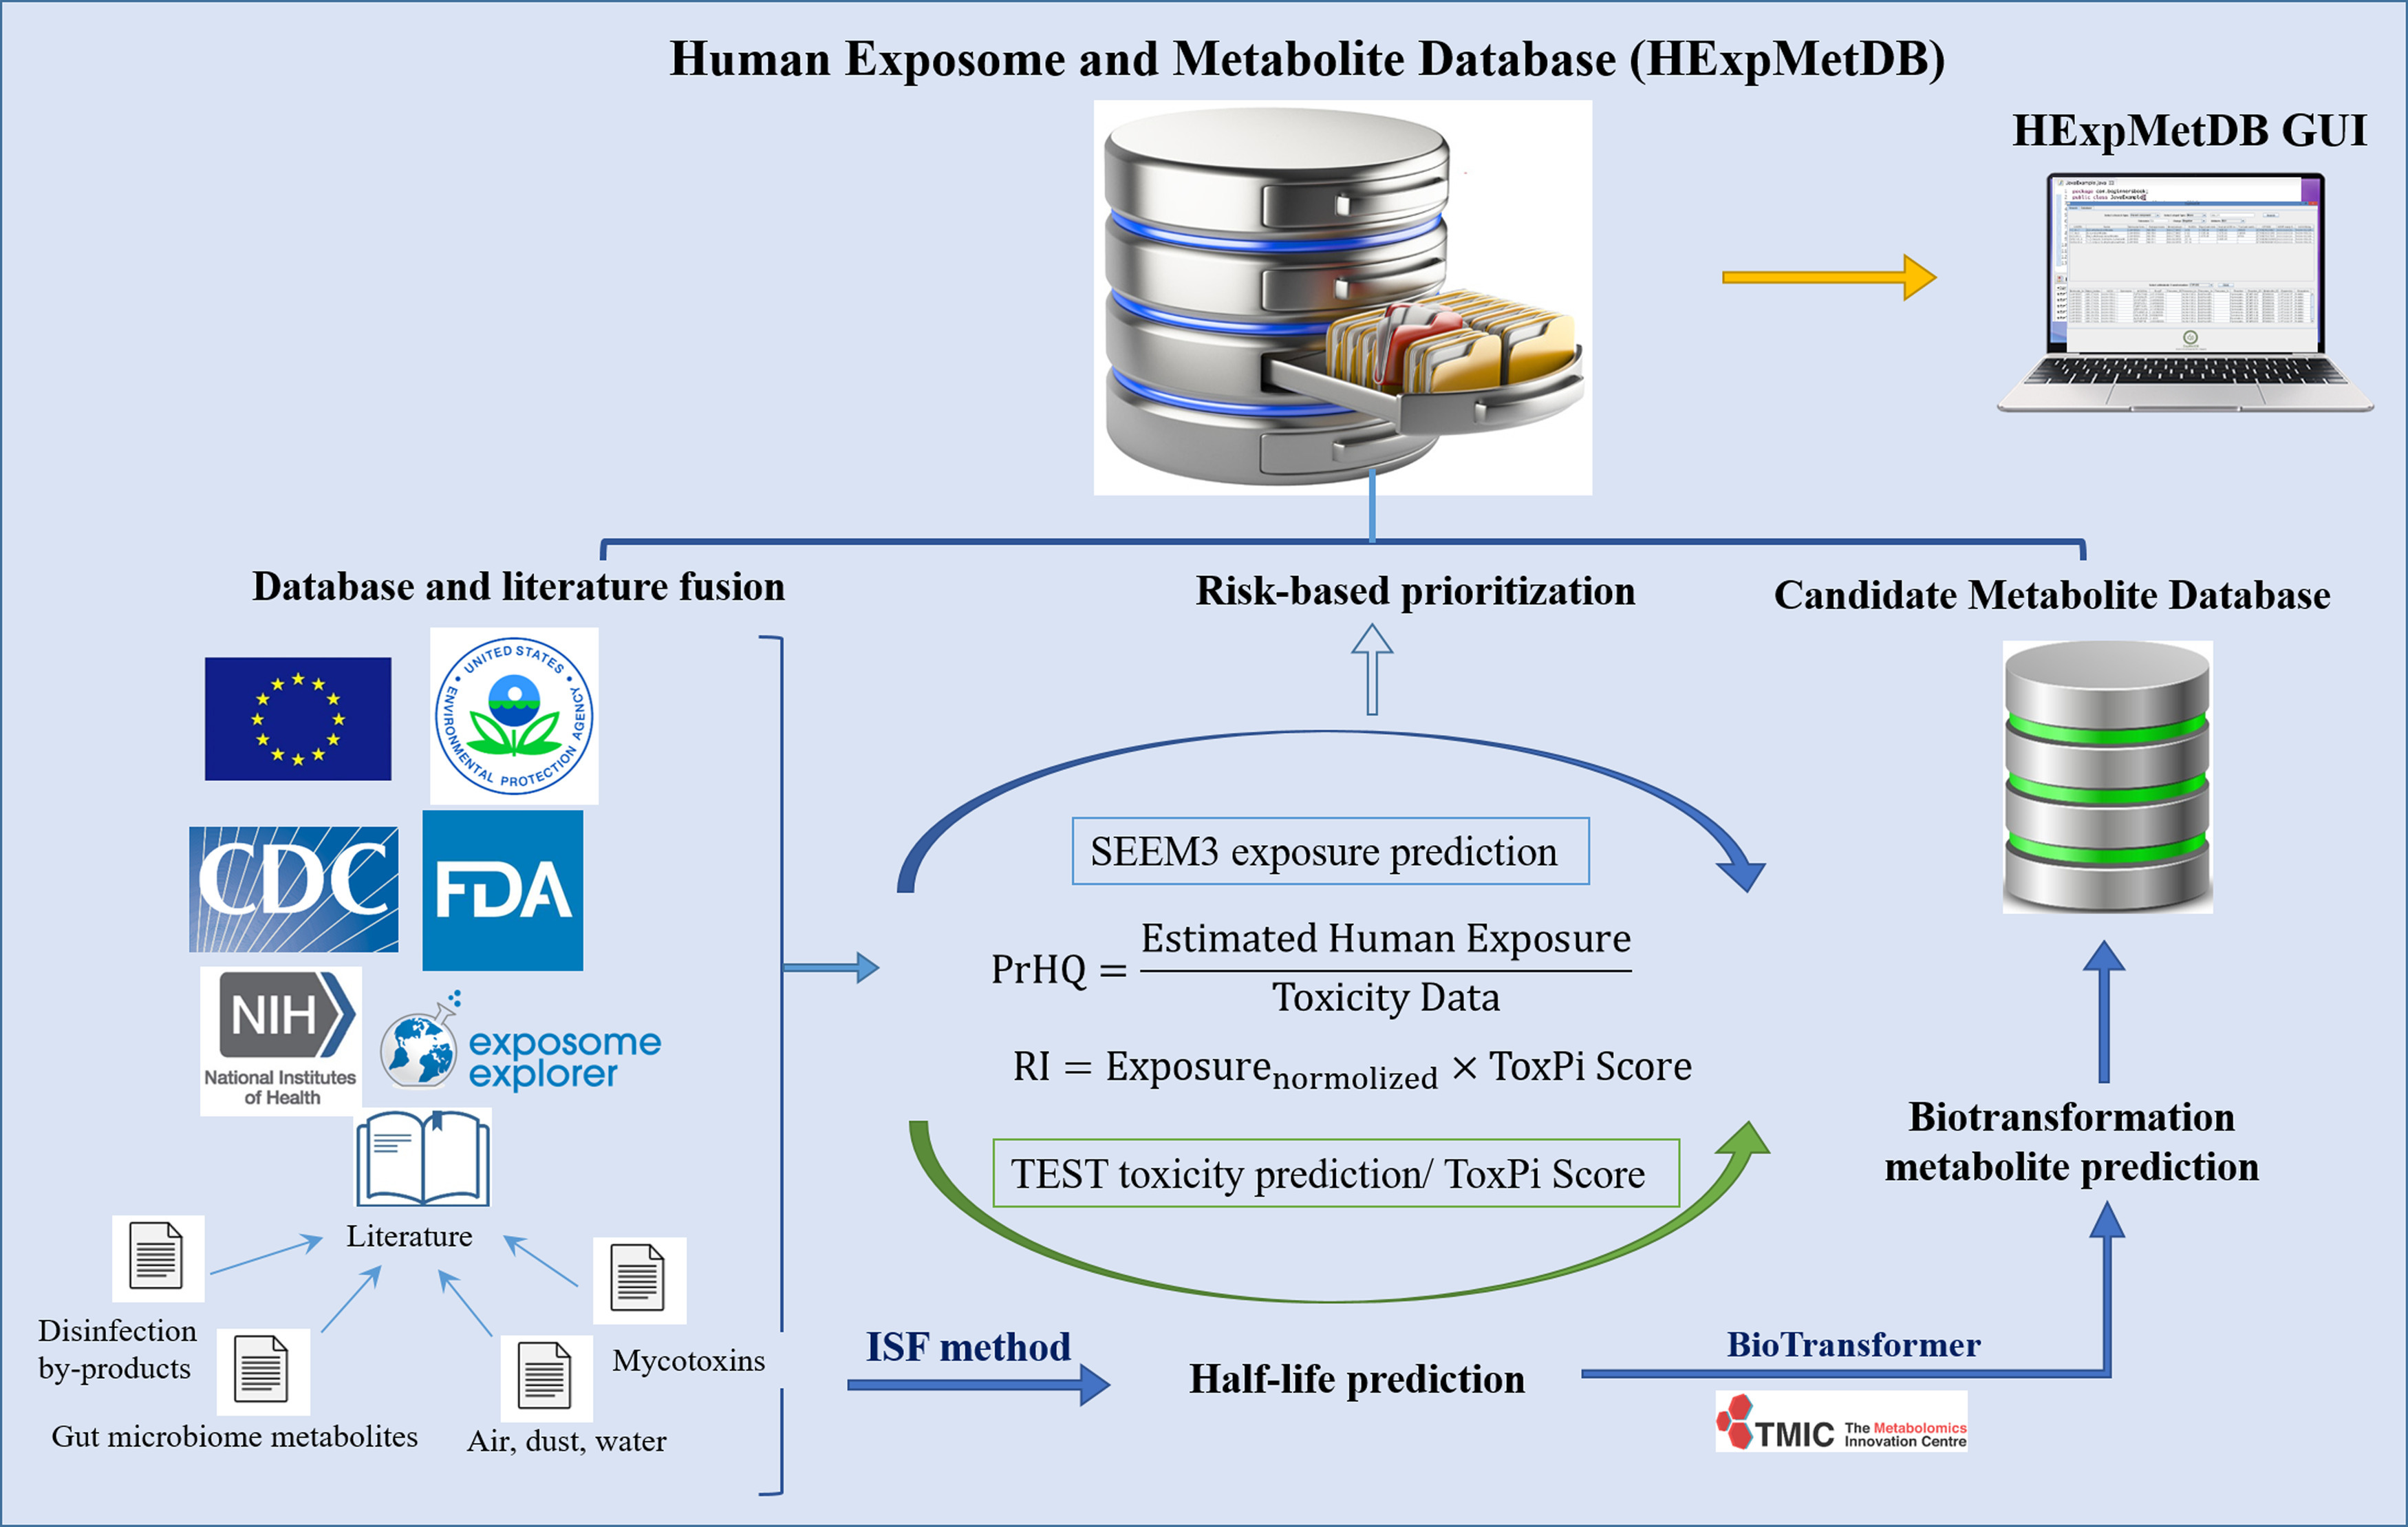
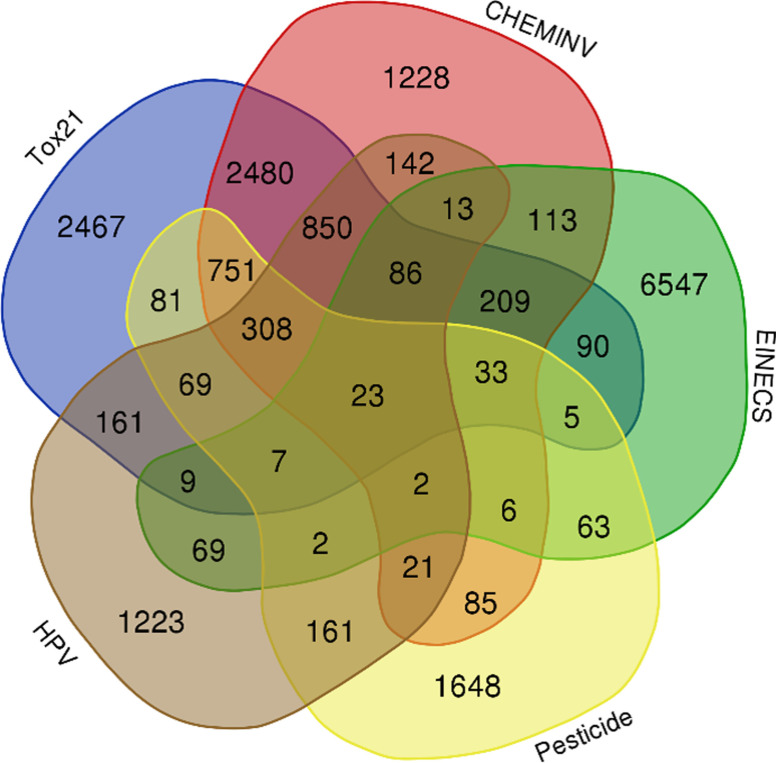
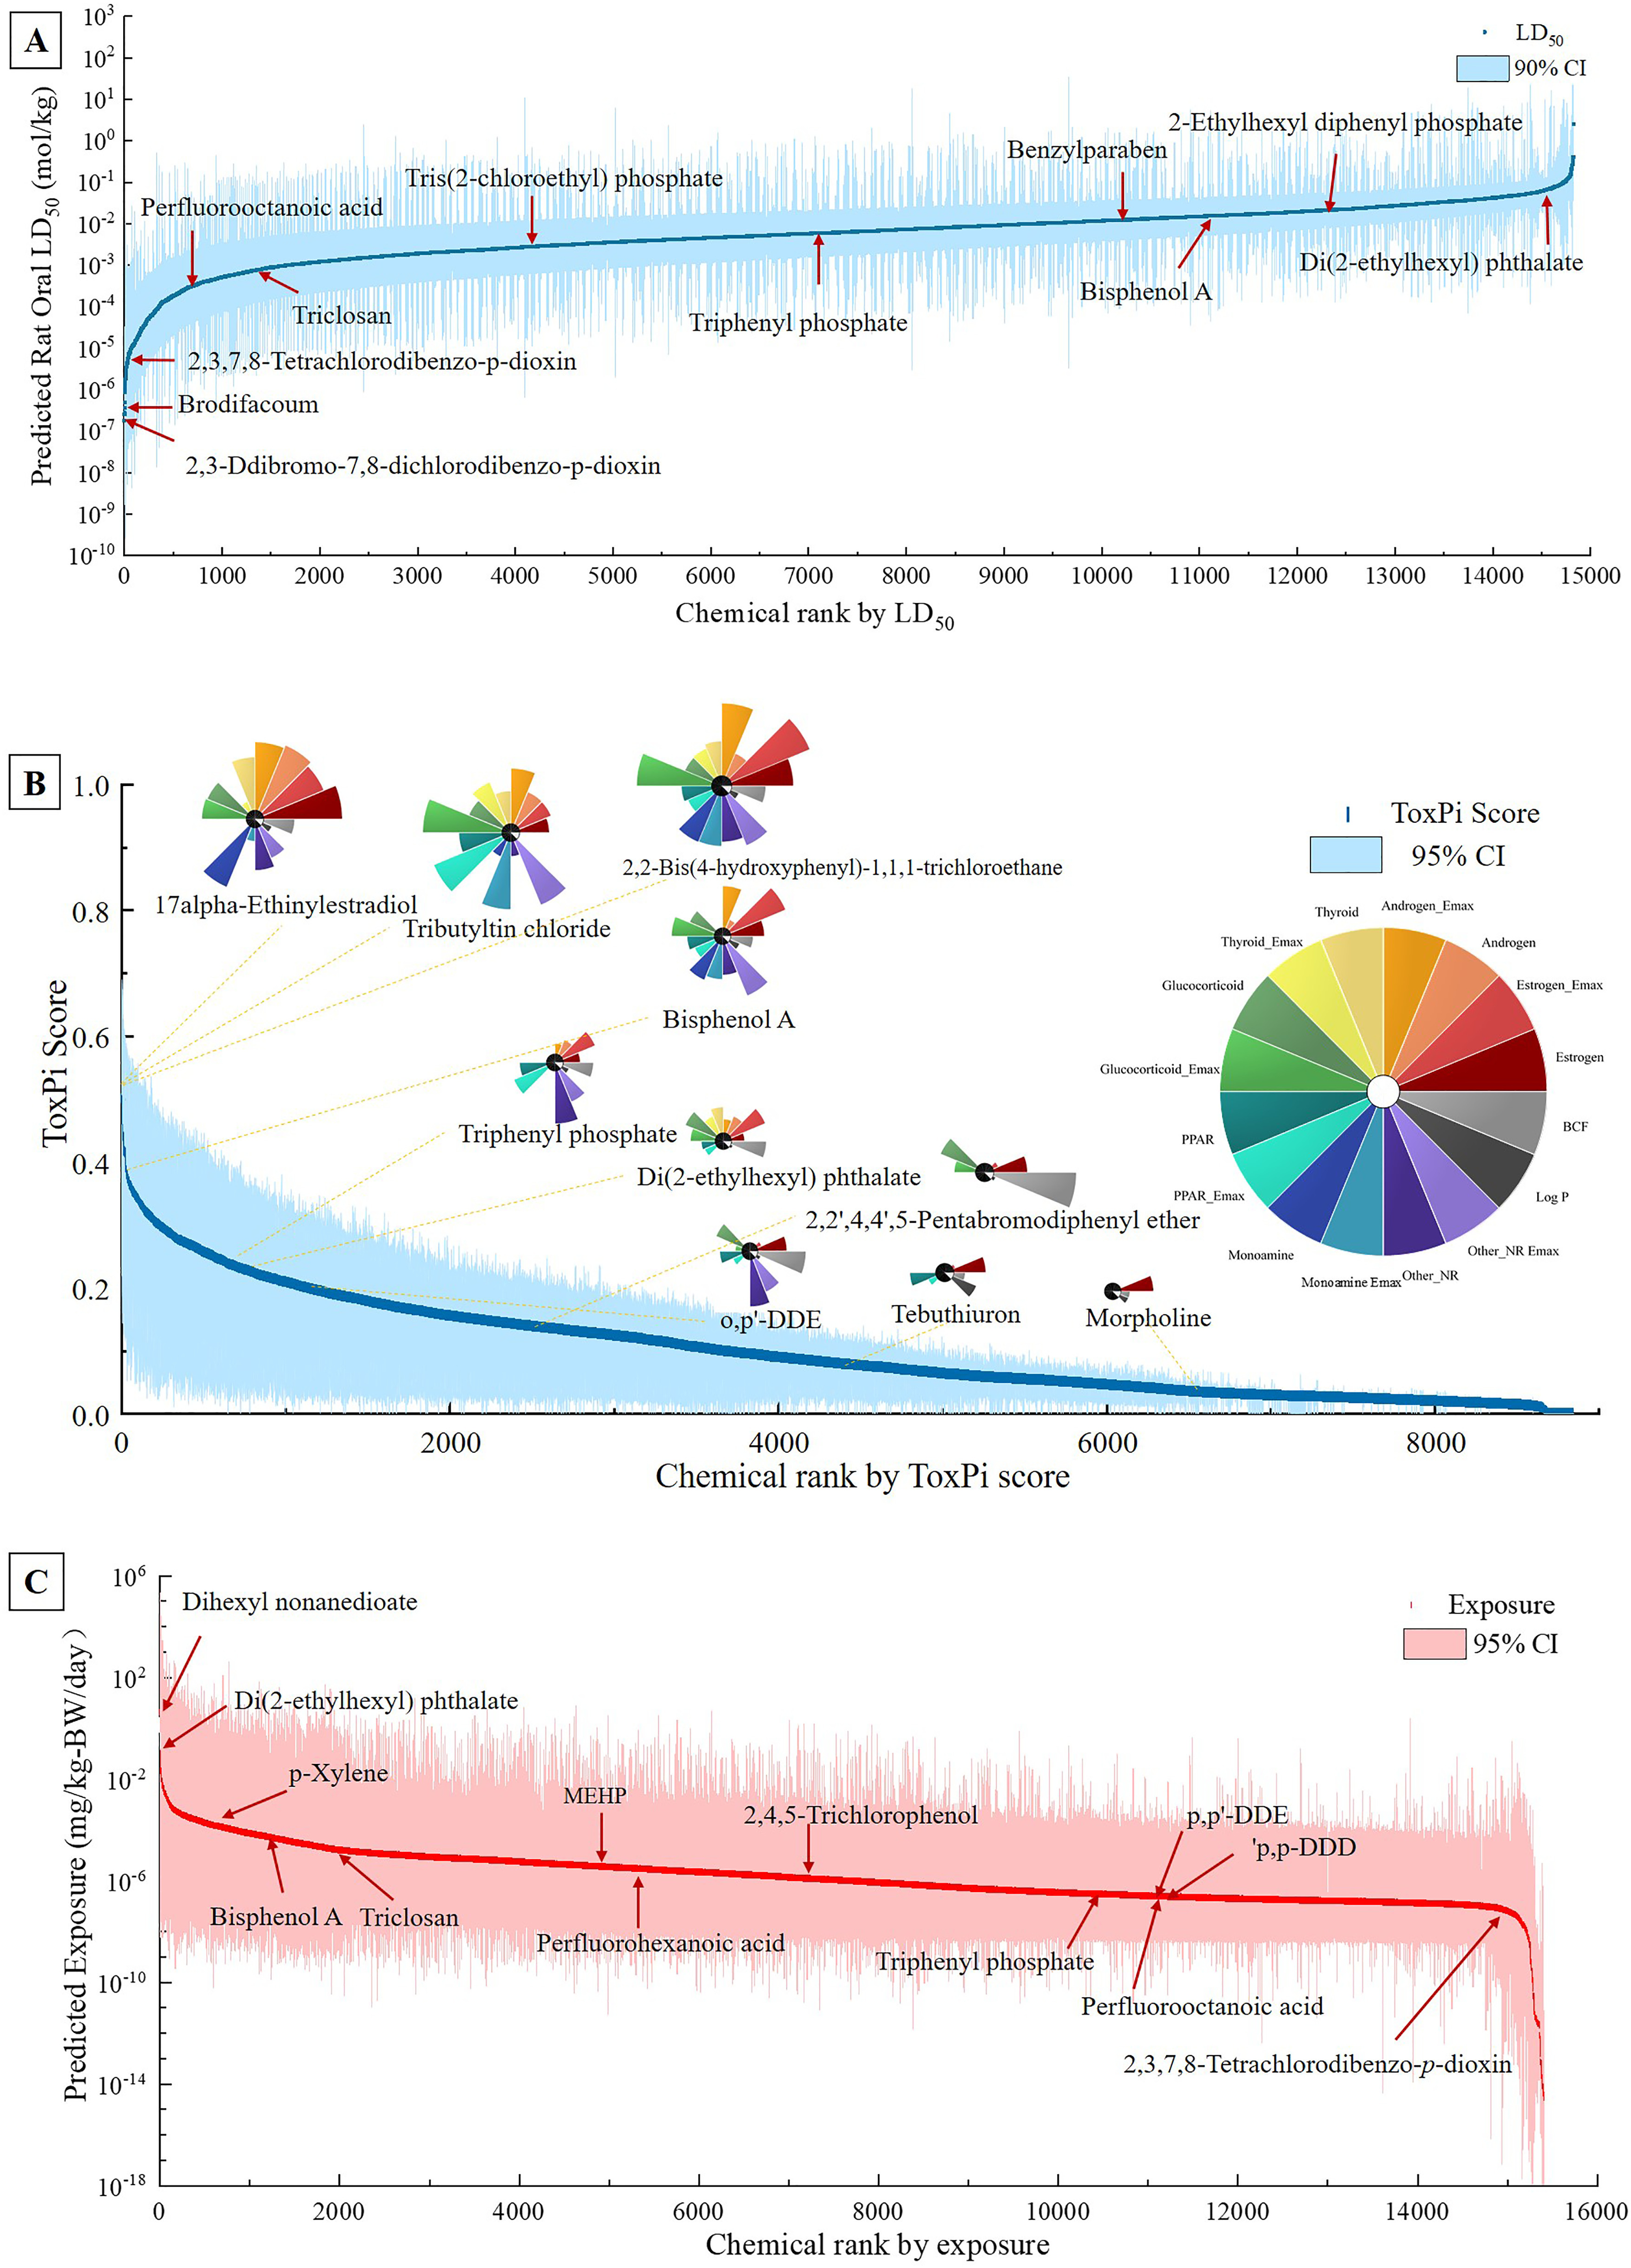
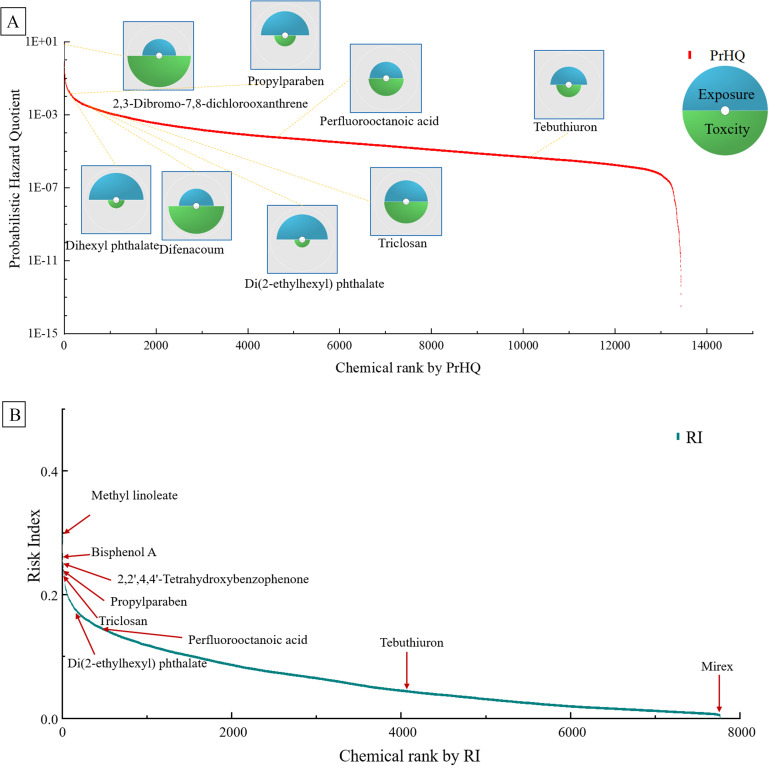
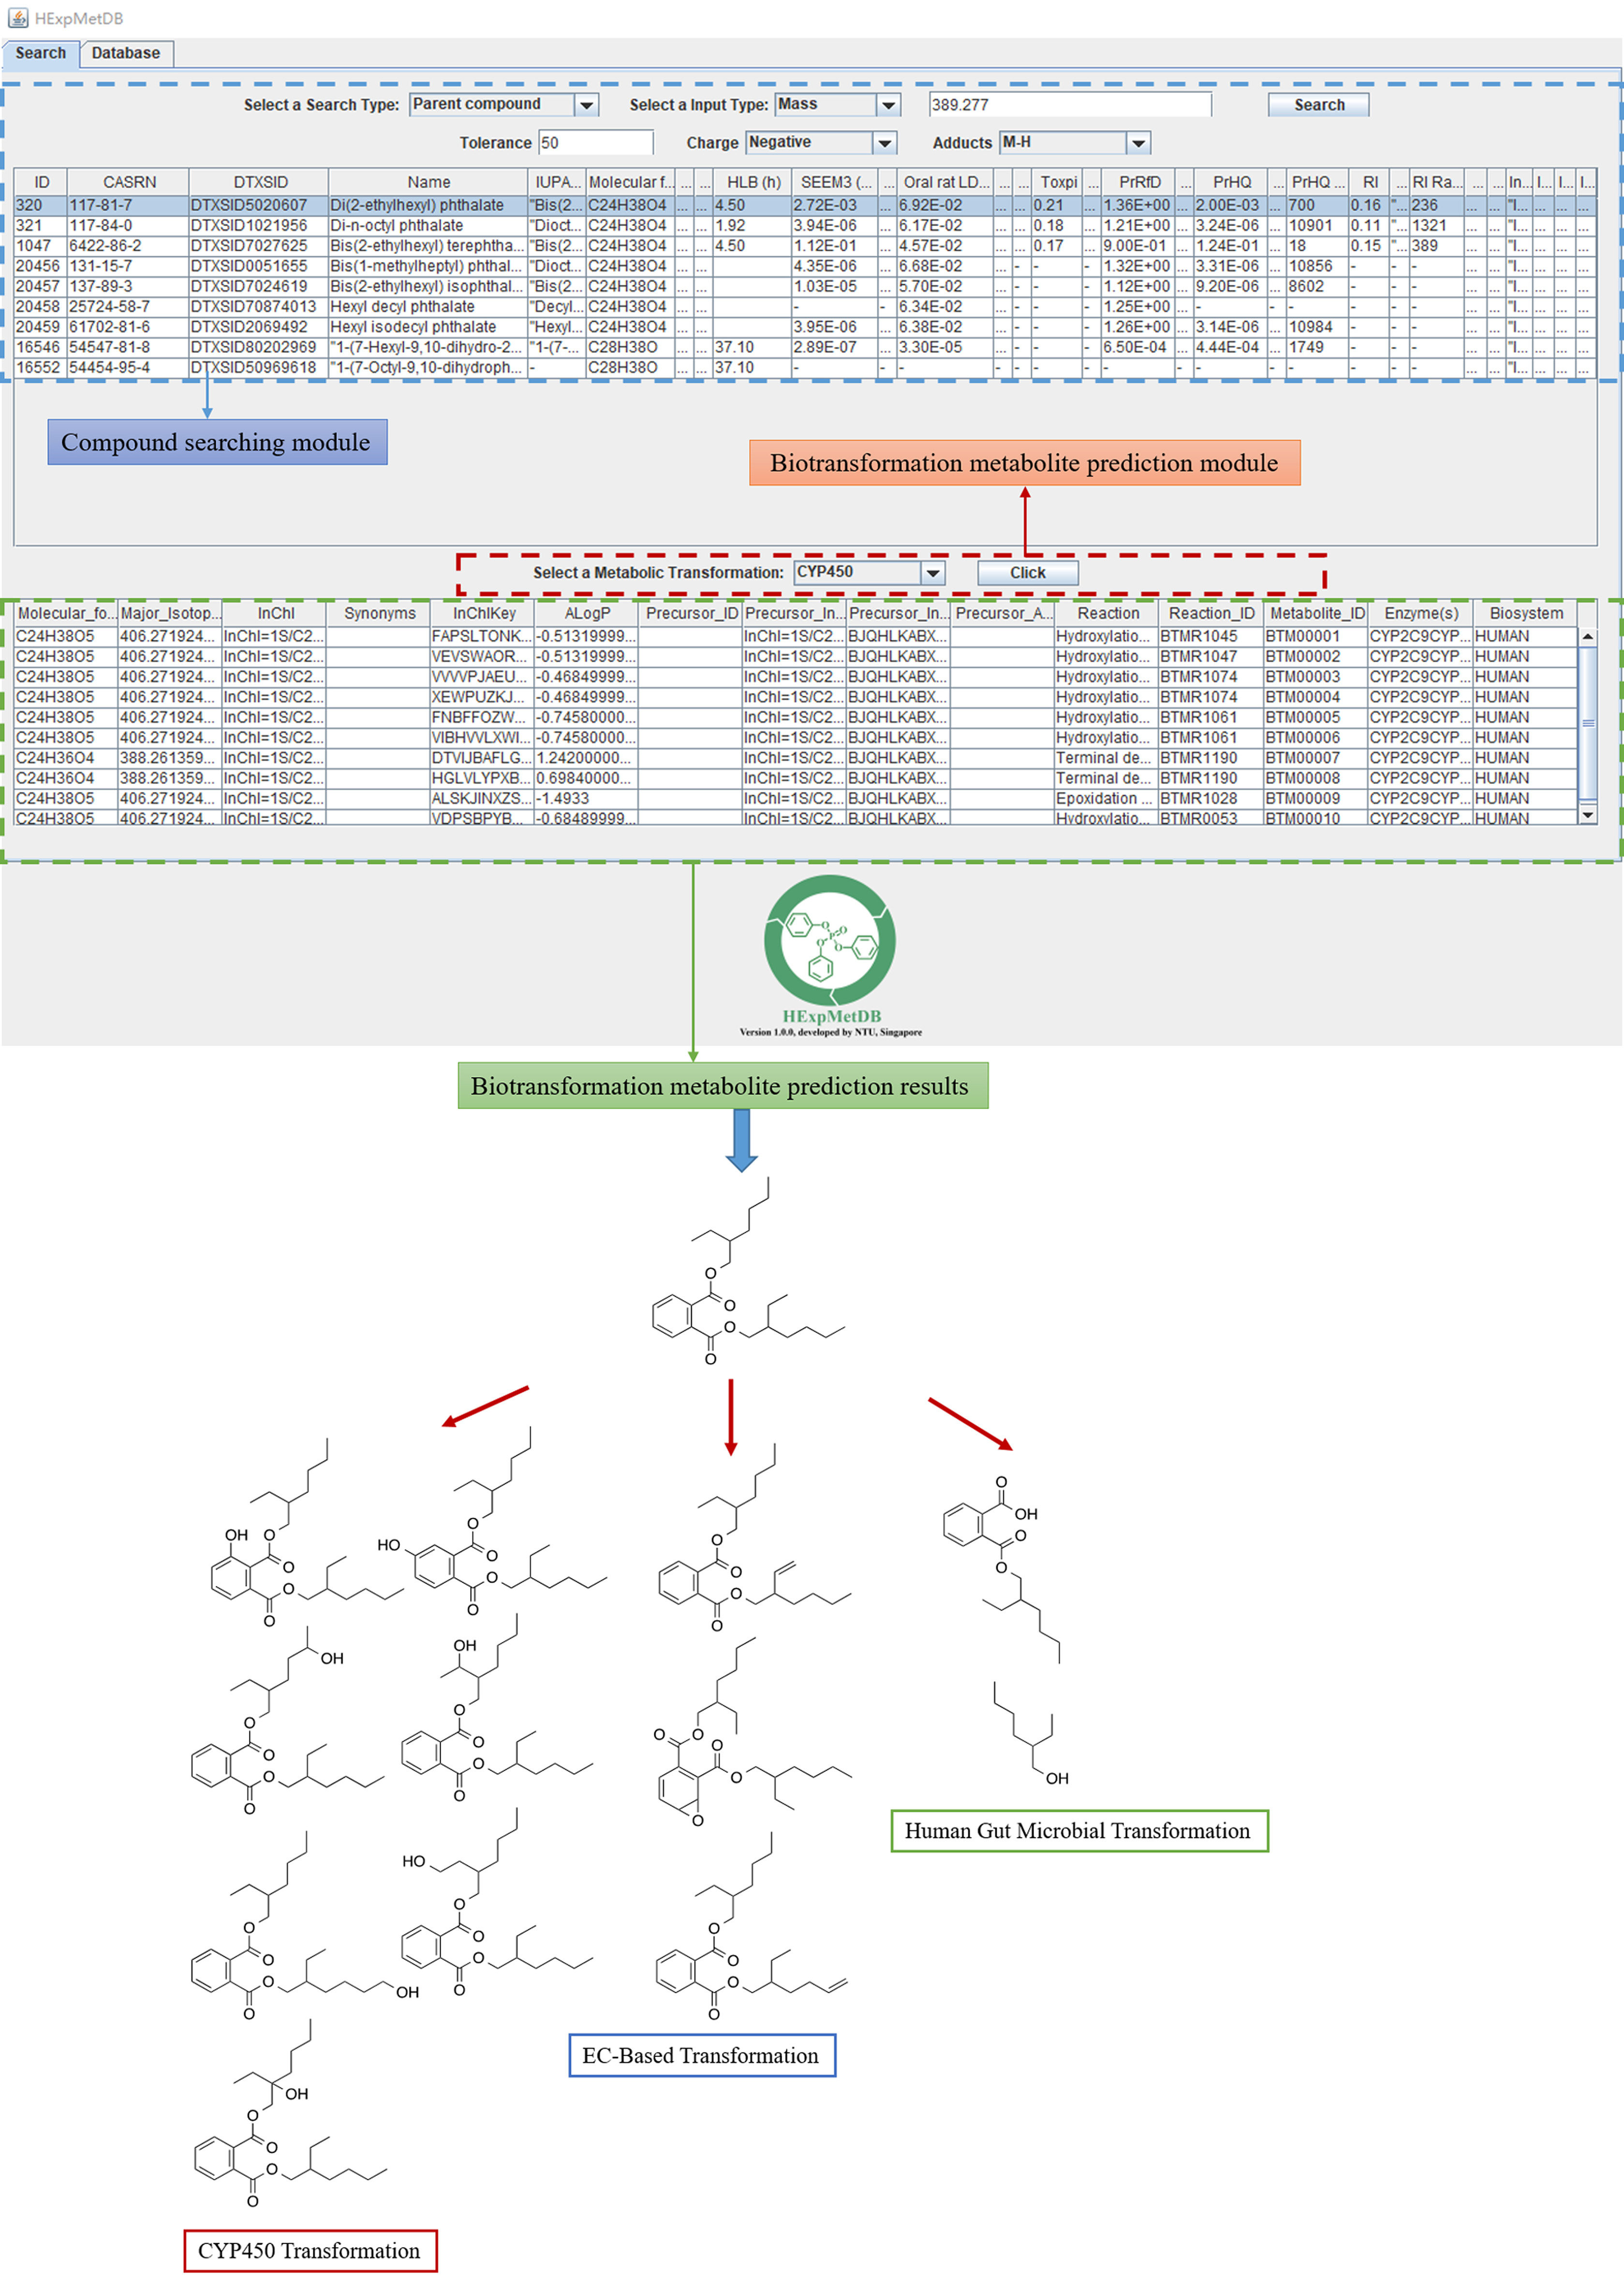
Methods: We built a comprehensive risk-prioritized human exposome database by text mining and database fusion. Subsequently, chemicals were prioritized by integrating exposure level obtained from the Systematic Empirical Evaluation of Models with toxicity data predicted by the Toxicity Estimation Software Tool and the Toxicological Priority Index calculated from the ToxCast database. The biotransformation half-lives (HLBs) of all the chemicals were assessed using the Iterative Fragment Selection approach and biotransformation products were predicted using the previously developed BioTransformer machine-learning method.

Results: We compiled a human exposome database of >20,000 chemicals, prioritized 13,441 chemicals based on probabilistic hazard quotient and 7,770 chemicals based on risk index, and provided a predicted biotransformation metabolite database of >95,000 metabolites. In addition, a user-interactive Java software (Oracle)-based search GUI was generated to enable open access to this new resource.

Discussion: Our database can be used to guide chemical management and enhance scientific understanding to rapidly and effectively prioritize chemicals for comprehensive biomonitoring in epidemiological investigations. https://doi.org/10.1289/EHP7722.


Figures

Figure 1 is a schematic diagram of the Human Exposome and Metabolite Database establishment workflow having four steps. Step 1: Human Exposome and Metabolite Database with an icon of a database leads to Human Exposome and Metabolite Database graphical user interface with an icon of a laptop, Database and literature fusion, including U.S. Environmental Protection Agency, Centers for Disease Control and Prevention, U.S. Food and Drug Administration, National Institutes of Health, Exposome Explorer, Literature. The literature includes: disinfection by products; gut microbiome metabolites; air, dust, water; and mycotoxins. Step 2: Database and literature fusion leads to Systematic Empirical Evaluation of Models exposure prediction, where probabilistic hazard quotient equals estimated human exposure over toxicity data; Risk index equals exposure begin subscript normalized end subscript times Toxicological Priority Index score; and Toxicity Estimation Software Tool toxicity prediction per Toxicological Priority Index score. The literature with Iterative Fragment Selection method leads to half life prediction. Step 3: Systematic Empirical Evaluation of Models exposure prediction leads to risk-based prioritization and half life prediction with biotransformer, the Metabolomics innovation center leads to biotransformation metabolite prediction. Step 4: Biotransformation metabolite prediction leads to Candidate metabolite database with an icon of a database.
Figure 1.
Schematic workflow for Human Exposome and Metabolite Database (HExpMetDB) establishment. Note: CDC, Centers for Disease Control and Prevention; FDA, U.S. Food and Drug Administration; GUI, graphical user interface; ISF, Iterative Fragment Selection; NIH, National Institutes of Health; PrHQ, probabilistic hazard quotient; RI, risk index; SEEM3, Systematic Empirical Evaluation of Models; TEST, Toxicity Estimation Software Tool; ToxPi, Toxicological Priority Index.
Figure 2 is a Venn diagram depicting analysis of five major databases mapping in the Human Exposome and Metabolite Database. There are five structures. The first structure is titled Toxicology in the 21st Century, the second structure is titled Chemical Inventory for Toxicity Forecaster, the third structure is titled European Inventory of Existing Commercial Chemical Substances, the fourth structure is titled Pesticides, the fifth structure is titled High production volume. Toxicology in the 21st Century contains the following data: 2467, 81, 161, 69, 2480, 751, 9, 308, 850, 7, 23, 86, 209, 33, 5, and 90. Chemical Inventory for Toxicity Forecaster contains the following data: 1228, 2480, 142, 751, 850, 13, 86, 113, 308, 23, 33, 209, 2, 6, 21, and 85. European Inventory of Existing Commercial Chemical Substances contains the following data: 6547, 113, 209, 90, 5, 63, 6, 33, 13, 86, 23, 2, 2, 7, 9, and 69. Pesticides contains the following data: 1648, 161, 85, 63, 21, 6, 2, 2, 5, 7, 23, 33, 69, 308, 81, and 751. High production volume contains the following data: 1223, 161, 9, 69, 161, 69, 7, 2, 21, 2, 23, 308, 86, 850, 13, and 142.
Figure 2.
Overlap analysis of five major database mapping in HExpMetDB. High production volume (HPV) chemicals, European Inventory of Existing Commercial Chemical Substances (EINECS), U.S. EPA Chemical Inventory for ToxCast (CHEMINV), NIH toxicology in the 21st Century (Tox21) chemicals and U.S. EPA pesticides contain a total of 18,909 chemicals, covering 91% of the whole database (20,756). Note: EPA, Environmental Protection Agency; HExpMetDB, Human Exposome and Metabolite Database; NIH, National Institutes of Health.
Figure 3A is a line graph plotting predicted rat oral lethal dose, 50 percent (moles per kilogram), ranging from 10 begin superscript negative 10 end superscript to 10 begin superscript 3 end superscript in unit increments (y-axis) across chemical rank by lethal dose, 50 percent, ranging from 0 to 15,000 in increments of 1,000 (x-axis) for lethal dose, 50 percent and 90 percent confidence intervals. Figure 3B is a bubble polar area chart and line graph, and a pie chart. The bubble polar area chart and line graph plotting Toxicological Priority Index, ranging from 0.0 to 1.0 in increments of 0.2 (y-axis) across chemical rank by Toxicological Priority Index score, ranging from 0 to 8,000 in increments of 2,000 (x-axis) for Toxicological Priority Index and 95 percent confidence intervals. The pie chart is divided into sixteen parts, namely, androgen underscore efficacy, androgen, estrogen underscore efficacy, estrogen, bioconcentration factor, the octanol-water partitioning coefficient, other nuclear receptor underscore efficacy, other nuclear receptor underscore, monoamine efficacy, Monoamine, peroxisome proliferator-activated receptors underscore efficacy, peroxisome proliferator-activated receptors, Glucocorticoid underscore efficacy, Glucocorticoid, Thyroid underscore efficacy, and thyroid. Figure 3C is a line graph plotting predicted exposure (milligrams per kilogram body weight per day), ranging from 10 superscript negative 18 to 10 superscript 6 in increments of 10 superscript 4 (y-axis) across chemical rank by exposure, ranging from 0 to 16,000 in increments of 2,000 (x-axis) for exposure and 95 percent confidence intervals.
Figure 3.
The cumulative distribution of (A) predicted rat oral LD50 (n=14,827); (B) Toxicological Priority Index (ToxPi) score (n=8,845); (C) Systematic Empirical Evaluation of Model (SEEM) predicted exposure values (n=15,408). Some typical environmental pollutants are labeled. The summary data are listed in Table S2 and Excel Table S2. Note: BCF, bioconcentration factor; BW, body weight; CI, confidence interval; Emax, efficacy; LD50, median lethal dose; NR, nuclear receptor; PPAR, peroxisome proliferator-activated receptor; ToxPi, Toxicological Priority Index.
Figure 4A is a bubble pie chart and line graph plotting Probabilistic hazard quotient, ranging from 10 superscript negative 15 to 10 superscript 1 in increments of 10 superscript 3 (y-axis) across chemical rank by probabilistic hazard quotient, ranging from 0 to 14,000 in increments of 2,000 (x-axis) for exposure and toxicity. Figure 4B is a line graph plotting risk index, ranging from 0.0 to 0.4 in increments of 0.2 (y-axis) across chemical rank by Risk index, ranging from 0 to 8,000 in increments of 2,000 (x-axis) for Risk index.
Figure 4.
(A) The cumulative distribution of chemical probabilistic hazard quotients (PrHQs) (n=13,441). The inset shows the PrHQs for typical environmental pollutants represented as exposure (blue) and toxicity (green) component slices. For each slice, the distance from the origin is proportional to the normalized value. (B) The cumulative distribution of chemical risk indexes (RIs) (n=7,770). The summary data are listed in Excel Table S2.
Figure 5 is a flow chart having two steps. Step 1: A tabular representation titled search has fifteen columns and ten rows. The columns are: Identification number, Chemical Abstracts Service Registry Number, Distributed Structure-Searchable Toxicity substance identifier displays compound searching module, name, International Union of Pure and Applied Chemistry, molecular, biotransformation half-life, Systematic Empirical Evaluation of Models, Oral rat Lethal Dose, Toxicological Priority Index, probabilistic reference dose, probabilistic hazard quotient, probabilistic hazard quotient, risk index, and risk index ratio. Below, another tabular representation titled select a metabolic transformation displays biotransformation metabolite prediction module has fifteen columns and eleven rows. The columns are: molecular, major isotope, International Chemical Identifier, synonyms, InChlkey, AlogP, Precursor underscore I D, Precursor, Precursor, Precursor, reaction, reaction identifier, metabolite identifier, enzyme, and biosystem. Step 2: Step 1 and Human Exposome and Metabolite Database with chemical formula icon inside a circle lead to biotransformation metabolite prediction results. Step 3: biotransformation metabolite prediction results has three chemical components: Cytochrome 450 transformation, E C based transformation, and Human gut Microbial transformation. All three chemical components have chemical formula structure.
Figure 5.
The graphical user interface (GUI) of our developed HExpMetDB. The compound search module can perform searches based on CASRN, formula, mass-charge-ratio (m/z), adduct search with mass accuracy (in ppm), and retrieve the corresponding metadata including chemical identifiers, structures, and predicted data of HLBs, exposure and rat oral LD50. The biotransformation metabolite prediction module can further search the candidate metabolites of the searched compound. Di(2-ethylhexyl) phthalate (CASRN 117-81-7) biotransformation metabolite prediction was used as an example. Note: ALogP, predicted values of the logarithm transformed 1-octanol/water partition coefficient; CASRN, Chemical Abstracts Service Registry Number; DTXSID, Distributed Structure-Searchable Toxicity substance identifier; EC-based, enzyme commission based; HExpMetDB, Human Exposome and Metabolite Database; HLB, biotransformation half-life; ID, identifier; InChI, International Chemical Identifier; InChIKey, condensed version of the InChI; IUPAC, International Union of Pure and Applied Chemistry; LD50, median lethal dose; PrRD, probabilistic reference dose; PrHQ, probabilistic hazard quotient; RI, risk index; SEEM3, Systematic Empirical Evaluation of Models.

Similar articles

Cited by

References

    1. Andrianou XD, van der Lek C, Charisiadis P, Ioannou S, Fotopoulou KN, Papapanagiotou Z, et al. . 2019. Application of the urban exposome framework using drinking water and quality of life indicators: a proof-of-concept study in Limassol, Cyprus. PeerJ 7:e6851, PMID: 31179170, 10.7717/peerj.6851. - DOI - PMC - PubMed
    1. Arnot JA, Brown TN, Wania F. 2014. Estimating screening-level organic chemical half-lives in humans. Environ Sci Technol 48(1):723–730, PMID: 24298879, 10.1021/es4029414. - DOI - PubMed
    1. Barupal DK, Fiehn O. 2019. Generating the Blood Exposome Database using a comprehensive text mining and database fusion approach. Environ Health Perspect 127(9):97008, PMID: 31557052, 10.1289/EHP4713. - DOI - PMC - PubMed
    1. Bland J. 2007. Managing biotransformation: introduction and overview. Altern Ther Health Med 13(2):S85–S87, PMID: 17405682. - PubMed
    1. Brown TN, Arnot JA, Wania F. 2012. Iterative fragment selection: a group contribution approach to predicting fish biotransformation half-lives. Environ Sci Technol 46(15):8253–8260, PMID: 22779755, 10.1021/es301182a. - DOI - PubMed

Publication types

LinkOut - more resources