. 2021 Apr;129(4):47013.
doi: 10.1289/EHP8495. Epub 2021 Apr 30.

CATMoS: Collaborative Acute Toxicity Modeling Suite

Kamel Mansouri  1   2 Agnes L Karmaus  1 Jeremy Fitzpatrick  3 Grace Patlewicz  4 Prachi Pradeep  4   5 Domenico Alberga  6 Nathalie Alepee  7 Timothy E H Allen  8 Dave Allen  1 Vinicius M Alves  9   10 Carolina H Andrade  10 Tyler R Auernhammer  11 Davide Ballabio  12 Shannon Bell  1 Emilio Benfenati  13 Sudin Bhattacharya  14 Joyce V Bastos  10 Stephen Boyd  15 J B Brown  16 Stephen J Capuzzi  9 Yaroslav Chushak  17   18 Heather Ciallella  19 Alex M Clark  20 Viviana Consonni  12 Pankaj R Daga  21 Sean Ekins  20 Sherif Farag  9 Maxim Fedorov  22 Denis Fourches  23   24 Domenico Gadaleta  13 Feng Gao  15 Jeffery M Gearhart  17   18 Garett Goh  25 Jonathan M Goodman  8 Francesca Grisoni  12 Christopher M Grulke  4 Thomas Hartung  26 Matthew Hirn  27 Pavel Karpov  28 Alexandru Korotcov  29 Giovanna J Lavado  13 Michael Lawless  21 Xinhao Li  23 Thomas Luechtefeld  26 Filippo Lunghini  30 Giuseppe F Mangiatordi  6 Gilles Marcou  30 Dan Marsh  26 Todd Martin  31 Andrea Mauri  32 Eugene N Muratov  9   10 Glenn J Myatt  33 Dac-Trung Nguyen  34 Orazio Nicolotti  6 Reine Note  7 Paritosh Pande  25 Amanda K Parks  11 Tyler Peryea  34 Ahsan H Polash  16 Robert Rallo  25 Alessandra Roncaglioni  13 Craig Rowlands  26 Patricia Ruiz  35 Daniel P Russo  19 Ahmed Sayed  36 Risa Sayre  4   5 Timothy Sheils  34 Charles Siegel  25 Arthur C Silva  10 Anton Simeonov  34 Sergey Sosnin  22 Noel Southall  34 Judy Strickland  1 Yun Tang  37 Brian Teppen  15 Igor V Tetko  28   38 Dennis Thomas  25 Valery Tkachenko  29 Roberto Todeschini  12 Cosimo Toma  13 Ignacio Tripodi  39 Daniela Trisciuzzi  6 Alexander Tropsha  9 Alexandre Varnek  30 Kristijan Vukovic  13 Zhongyu Wang  40 Liguo Wang  40 Katrina M Waters  25 Andrew J Wedlake  8 Sanjeeva J Wijeyesakere  11 Dan Wilson  11 Zijun Xiao  40 Hongbin Yang  37 Gergely Zahoranszky-Kohalmi  34 Alexey V Zakharov  34 Fagen F Zhang  11 Zhen Zhang  41 Tongan Zhao  34 Hao Zhu  19 Kimberley M Zorn  20 Warren Casey  2 Nicole C Kleinstreuer  2
Affiliations

CATMoS: Collaborative Acute Toxicity Modeling Suite

Kamel Mansouri et al. Environ Health Perspect. 2021 Apr.

Erratum in

  • Erratum: CATMoS: Collaborative Acute Toxicity Modeling Suite.
    Mansouri K, Karmaus A, Fitzpatrick J, Patlewicz G, Pradeep P, Alberga D, Alepee N, Allen TEH, Allen D, Alves VM, Andrade CH, Auernhammer TR, Ballabio D, Bell S, Benfenati E, Bhattacharya S, Bastos JV, Boyd S, Brown JB, Capuzzi SJ, Chushak Y, Ciallella H, Clark AM, Consonni V, Daga PR, Ekins S, Farag S, Fedorov M, Fourches D, Gadaleta D, Gao F, Gearhart JM, Goh G, Goodman JM, Grisoni F, Grulke CM, Hartung T, Hirn M, Karpov P, Korotcov A, Lavado GJ, Lawless M, Li X, Luechtefeld T, Lunghini F, Mangiatordi GF, Marcou G, Marsh D, Martin T, Mauri A, Muratov EN, Myatt GJ, Nguyen DT, Nicolotti O, Note R, Pande P, Parks AK, Peryea T, Polash A, Rallo R, Roncaglioni A, Rowlands C, Ruiz P, Russo D, Sayed A, Sayre R, Sheils T, Siegel C, Silva AC, Simeonov A, Sosnin S, Southall N, Strickland J, Tang Y, Teppen B, Tetko IV, Thomas D, Tkachenko V, Todeschini R, Toma C, Tripodi I, Trisciuzzi D, Tropsha A, Varnek A, Vukovic K, Wang Z, Wang L, Waters KM, Wedlake AJ, Wijeyesakere SJ, Wilson D, Xiao Z, Yang H, Zahoranszky-Kohalmi G, Zakharov AV, Zhang FF, Zhang Z, Zhao T, Zhu H, Zorn KM, Casey W, Kleinstreuer NC. Mansouri K, et al. Environ Health Perspect. 2021 Jul;129(7):79001. doi: 10.1289/EHP9883. Epub 2021 Jul 9. Environ Health Perspect. 2021. PMID: 34242083 Free PMC article. No abstract available.
  • Erratum: CATMoS: Collaborative Acute Toxicity Modeling Suite.
    Mansouri K, Karmaus AL, Fitzpatrick J, Patlewicz G, Pradeep P, Alberga D, Alepee N, Allen TEH, Allen D, Alves VM, Andrade CH, Auernhammer TR, Ballabio D, Bell S, Benfenati E, Bhattacharya S, Bastos JV, Boyd S, Brown JB, Capuzzi SJ, Chushak Y, Ciallella H, Clark AM, Consonni V, Daga PR, Ekins S, Farag S, Fedorov M, Fourches D, Gadaleta D, Gao F, Gearhart JM, Goh G, Goodman JM, Grisoni F, Grulke CM, Hartung T, Hirn M, Karpov P, Korotcov A, Lavado GJ, Lawless M, Li X, Luechtefeld T, Lunghini F, Mangiatordi GF, Marcou G, Marsh D, Martin T, Mauri A, Muratov EN, Myatt GJ, Nguyen DT, Nicolotti O, Note R, Pande P, Parks AK, Peryea T, Polash AH, Rallo R, Roncaglioni A, Rowlands C, Ruiz P, Russo DP, Sayed A, Sayre R, Sheils T, Siegel C, Silva AC, Simeonov A, Sosnin S, Southall N, Strickland J, Tang Y, Teppen B, Tetko IV, Thomas D, Tkachenko V, Todeschini R, Toma C, Tripodi I, Trisciuzzi D, Tropsha A, Varnek A, Vukovic K, Wang Z, Wang L, Waters KM, Wedlake AJ, Wijeyesakere SJ, Wilson D, Xiao Z, Yang H, Zahoranszky-Kohalmi G, Zakharov AV, Zhang FF, Zhang Z, Zhao T, Zhu H, Zorn KM, Casey W, Kleinstreuer NC. Mansouri K, et al. Environ Health Perspect. 2021 Oct;129(10):109001. doi: 10.1289/EHP10369. Epub 2021 Oct 14. Environ Health Perspect. 2021. PMID: 34647794 Free PMC article. No abstract available.

Abstract

Background: Humans are exposed to tens of thousands of chemical substances that need to be assessed for their potential toxicity. Acute systemic toxicity testing serves as the basis for regulatory hazard classification, labeling, and risk management. However, it is cost- and time-prohibitive to evaluate all new and existing chemicals using traditional rodent acute toxicity tests. In silico models built using existing data facilitate rapid acute toxicity predictions without using animals.

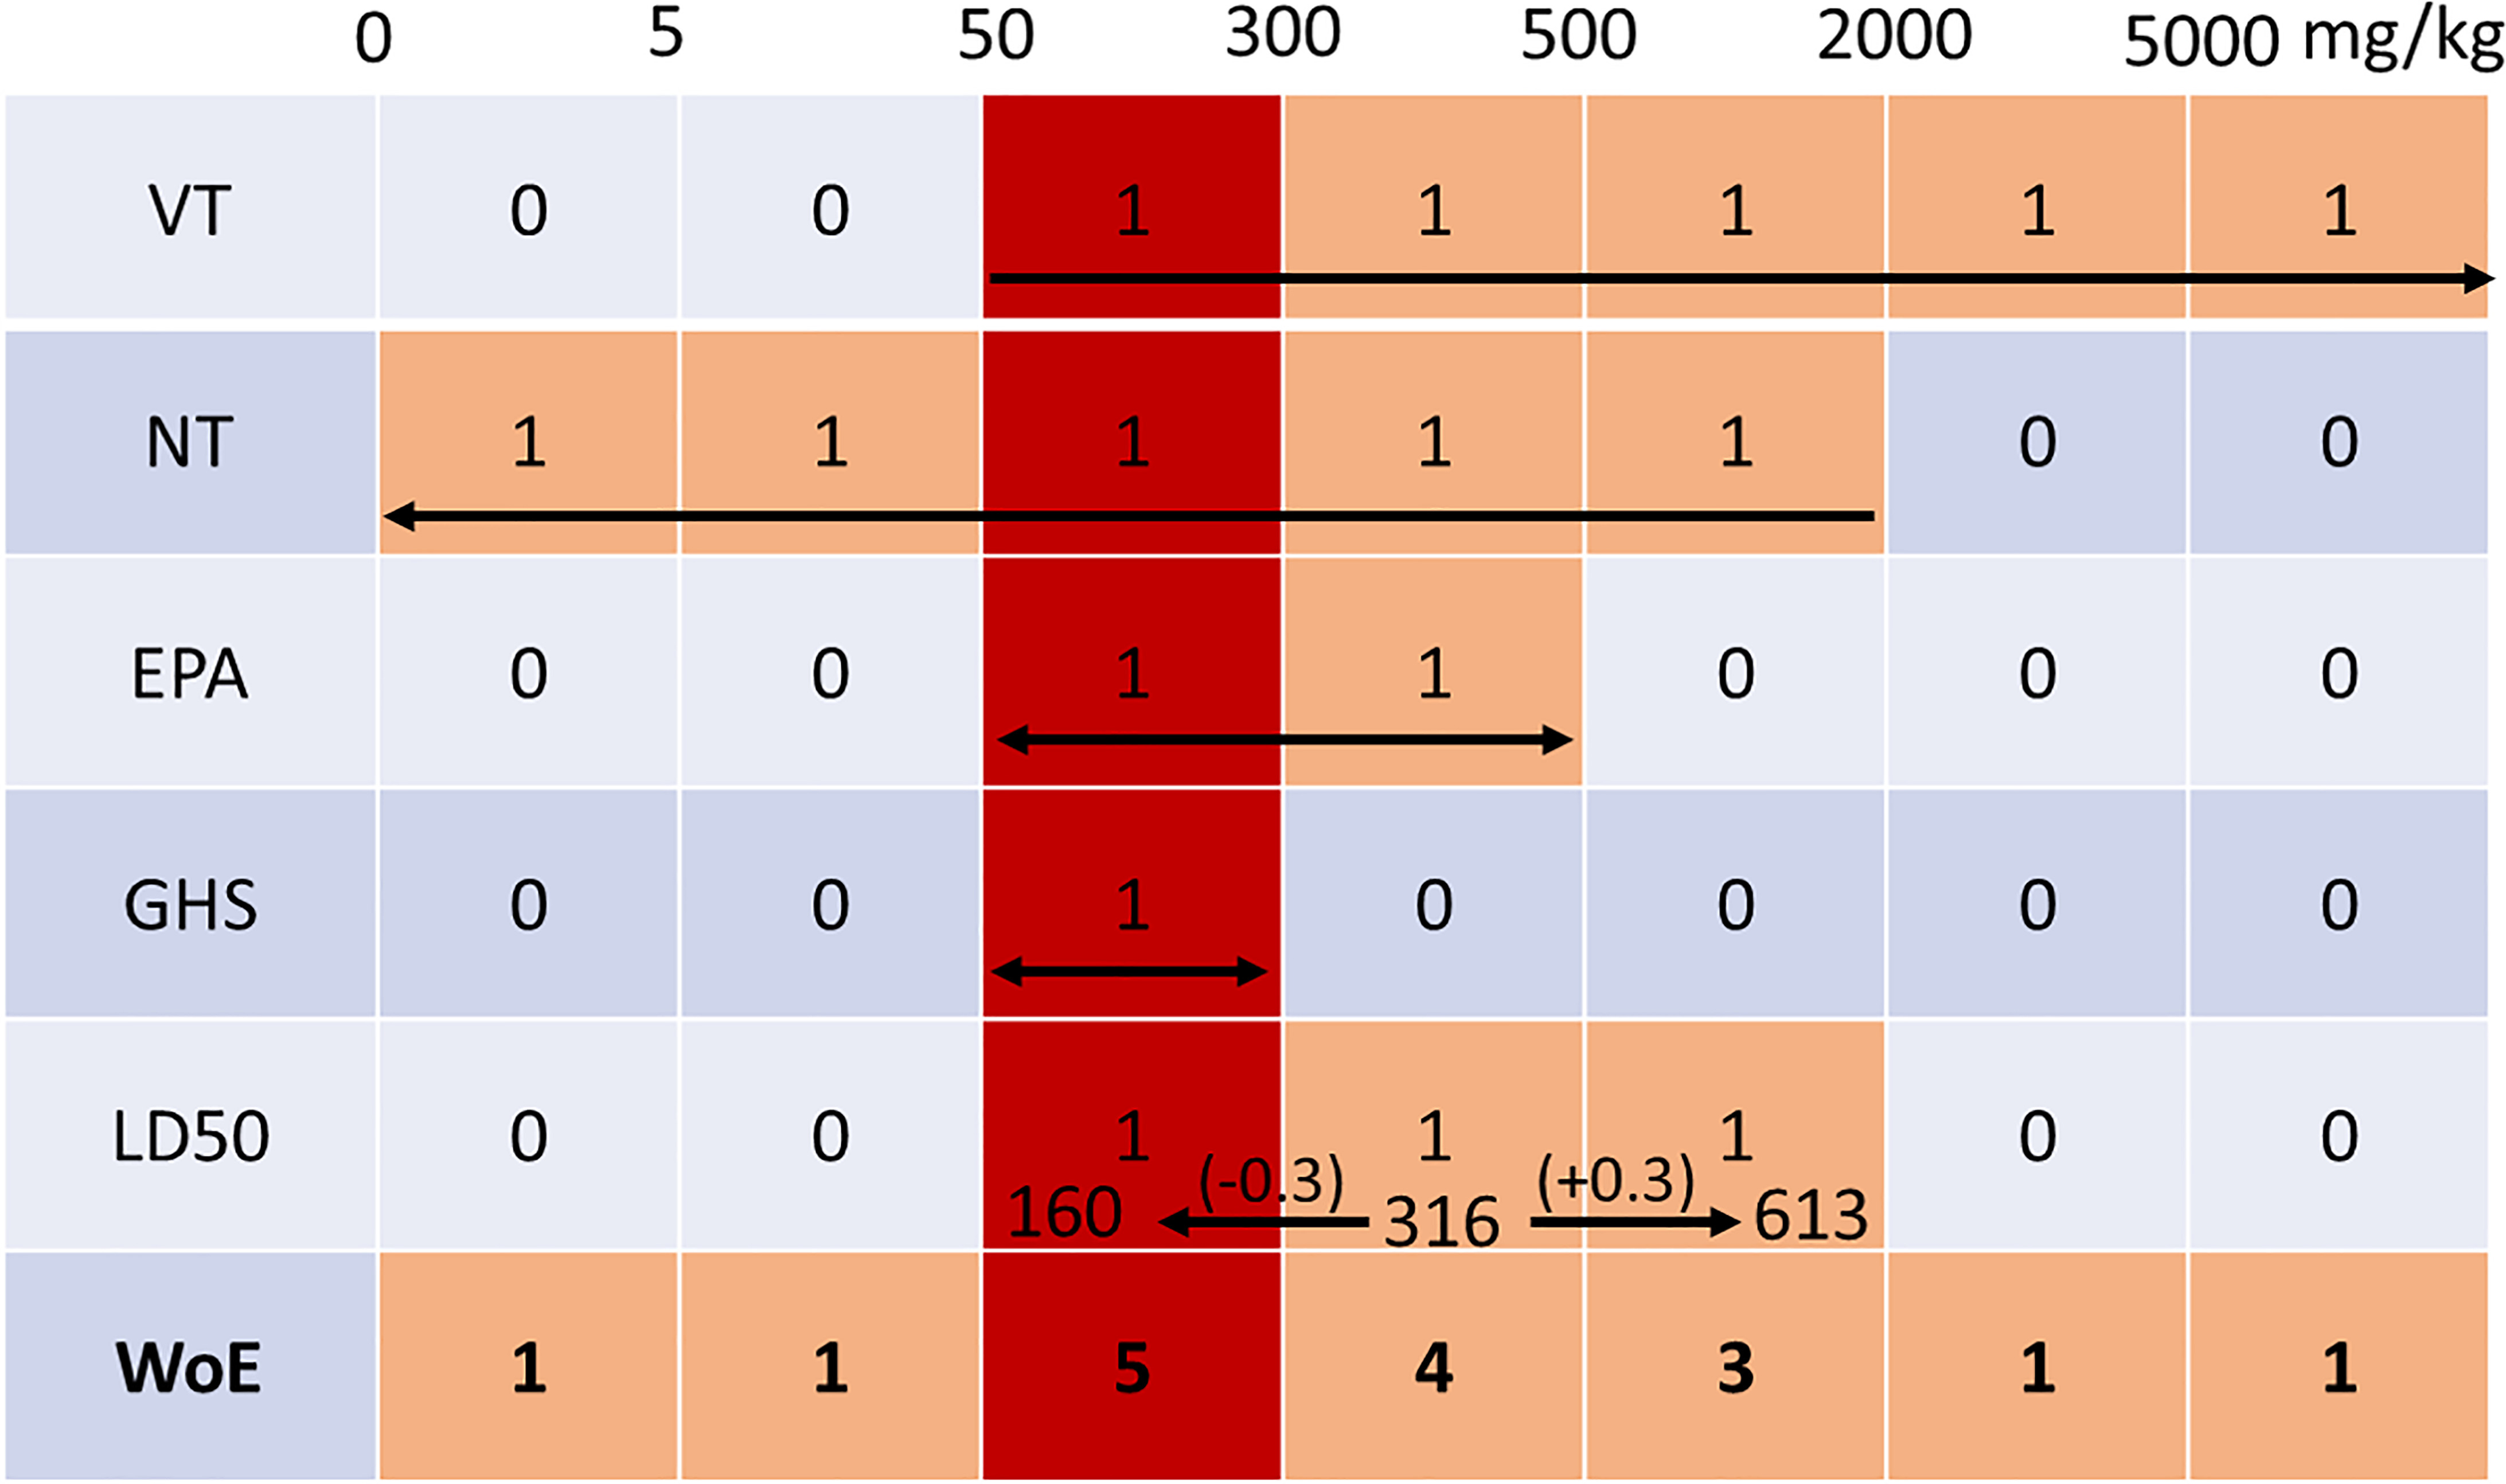
Objectives: The U.S. Interagency Coordinating Committee on the Validation of Alternative Methods (ICCVAM) Acute Toxicity Workgroup organized an international collaboration to develop in silico models for predicting acute oral toxicity based on five different end points: Lethal Dose 50 (LD50 value, U.S. Environmental Protection Agency hazard (four) categories, Globally Harmonized System for Classification and Labeling hazard (five) categories, very toxic chemicals [LD50 (LD5050mg/kg)], and nontoxic chemicals (LD50>2,000mg/kg).

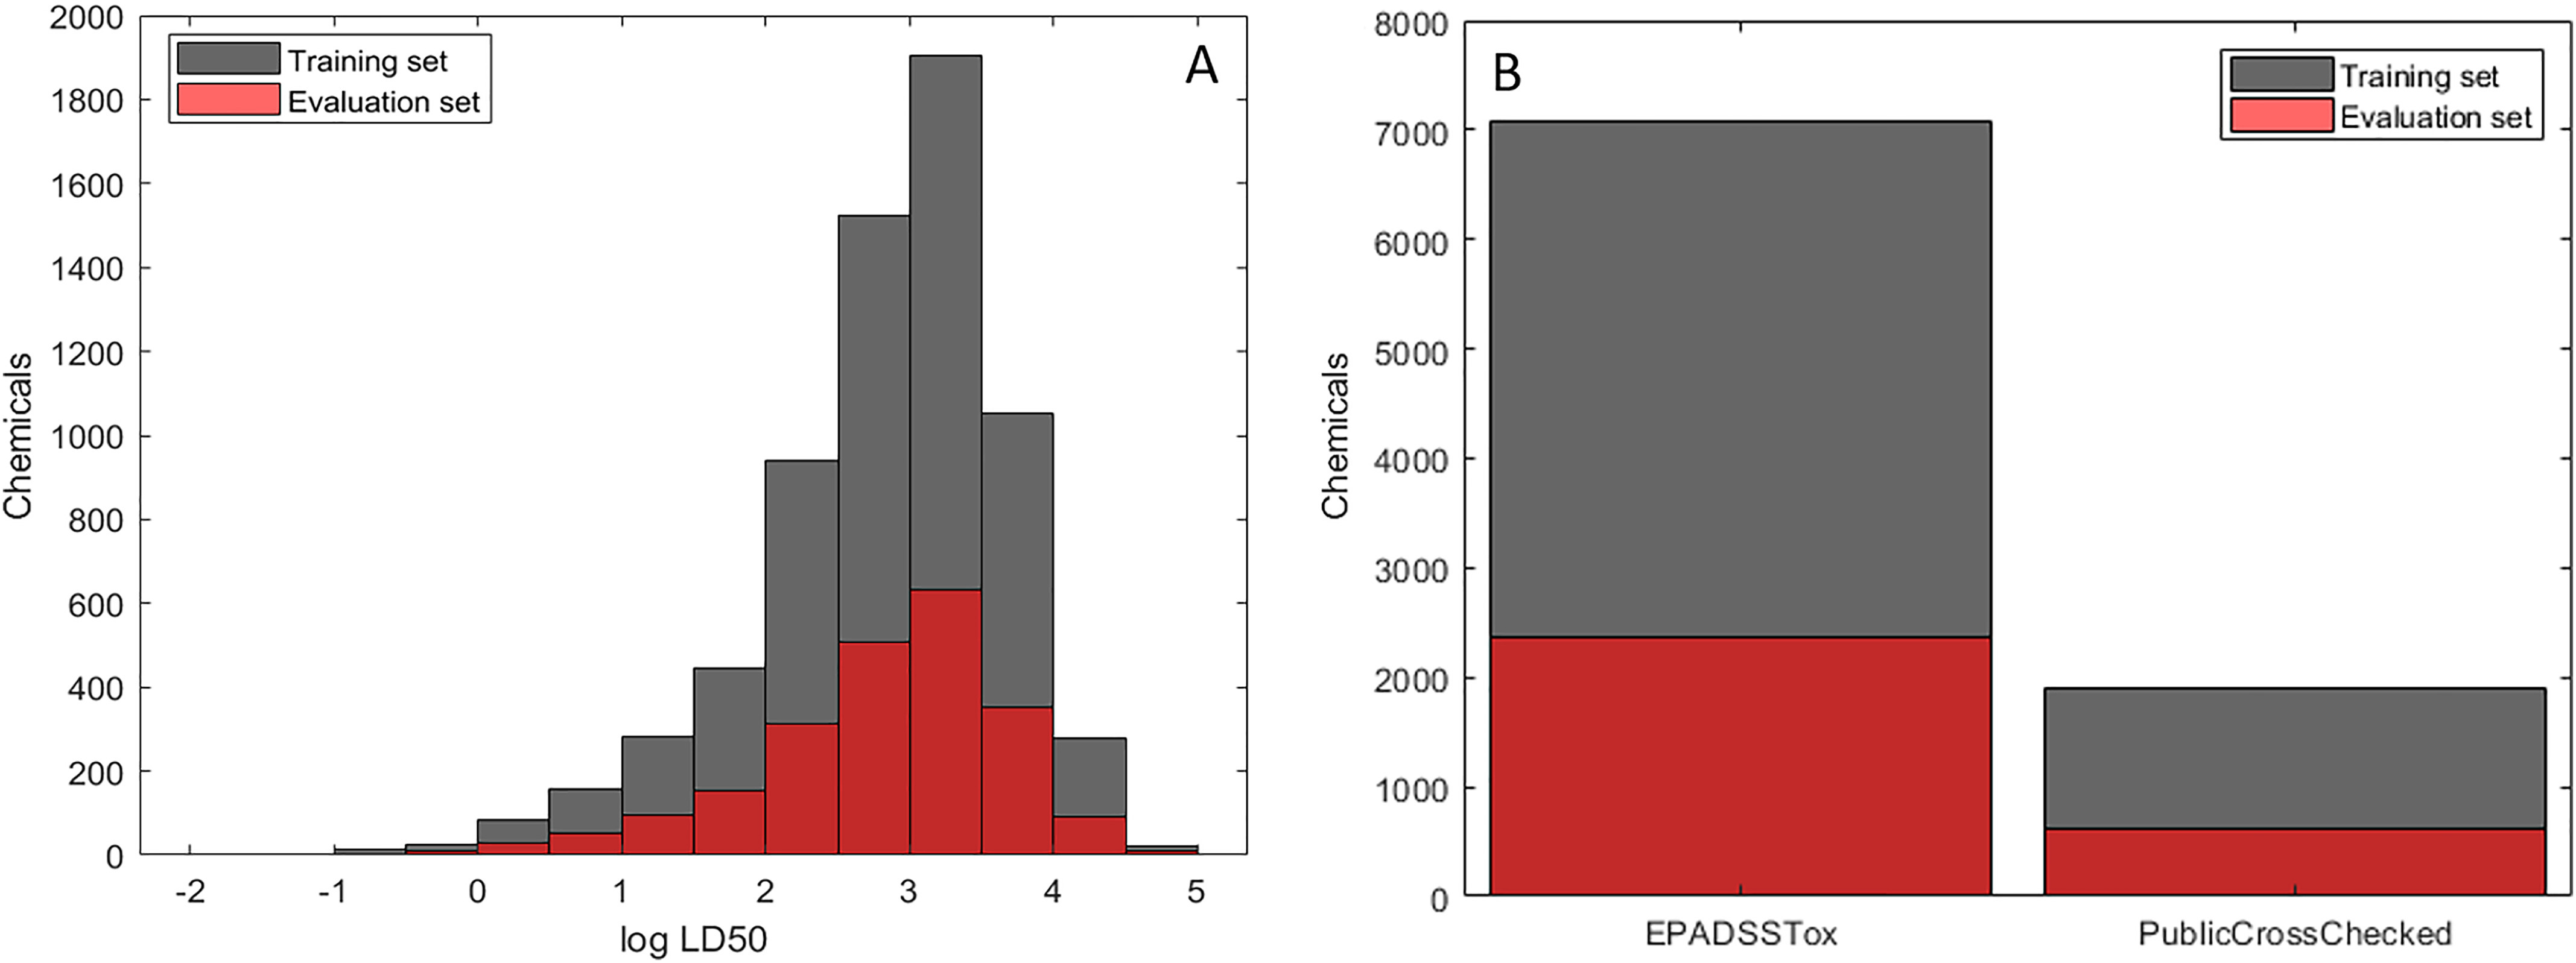
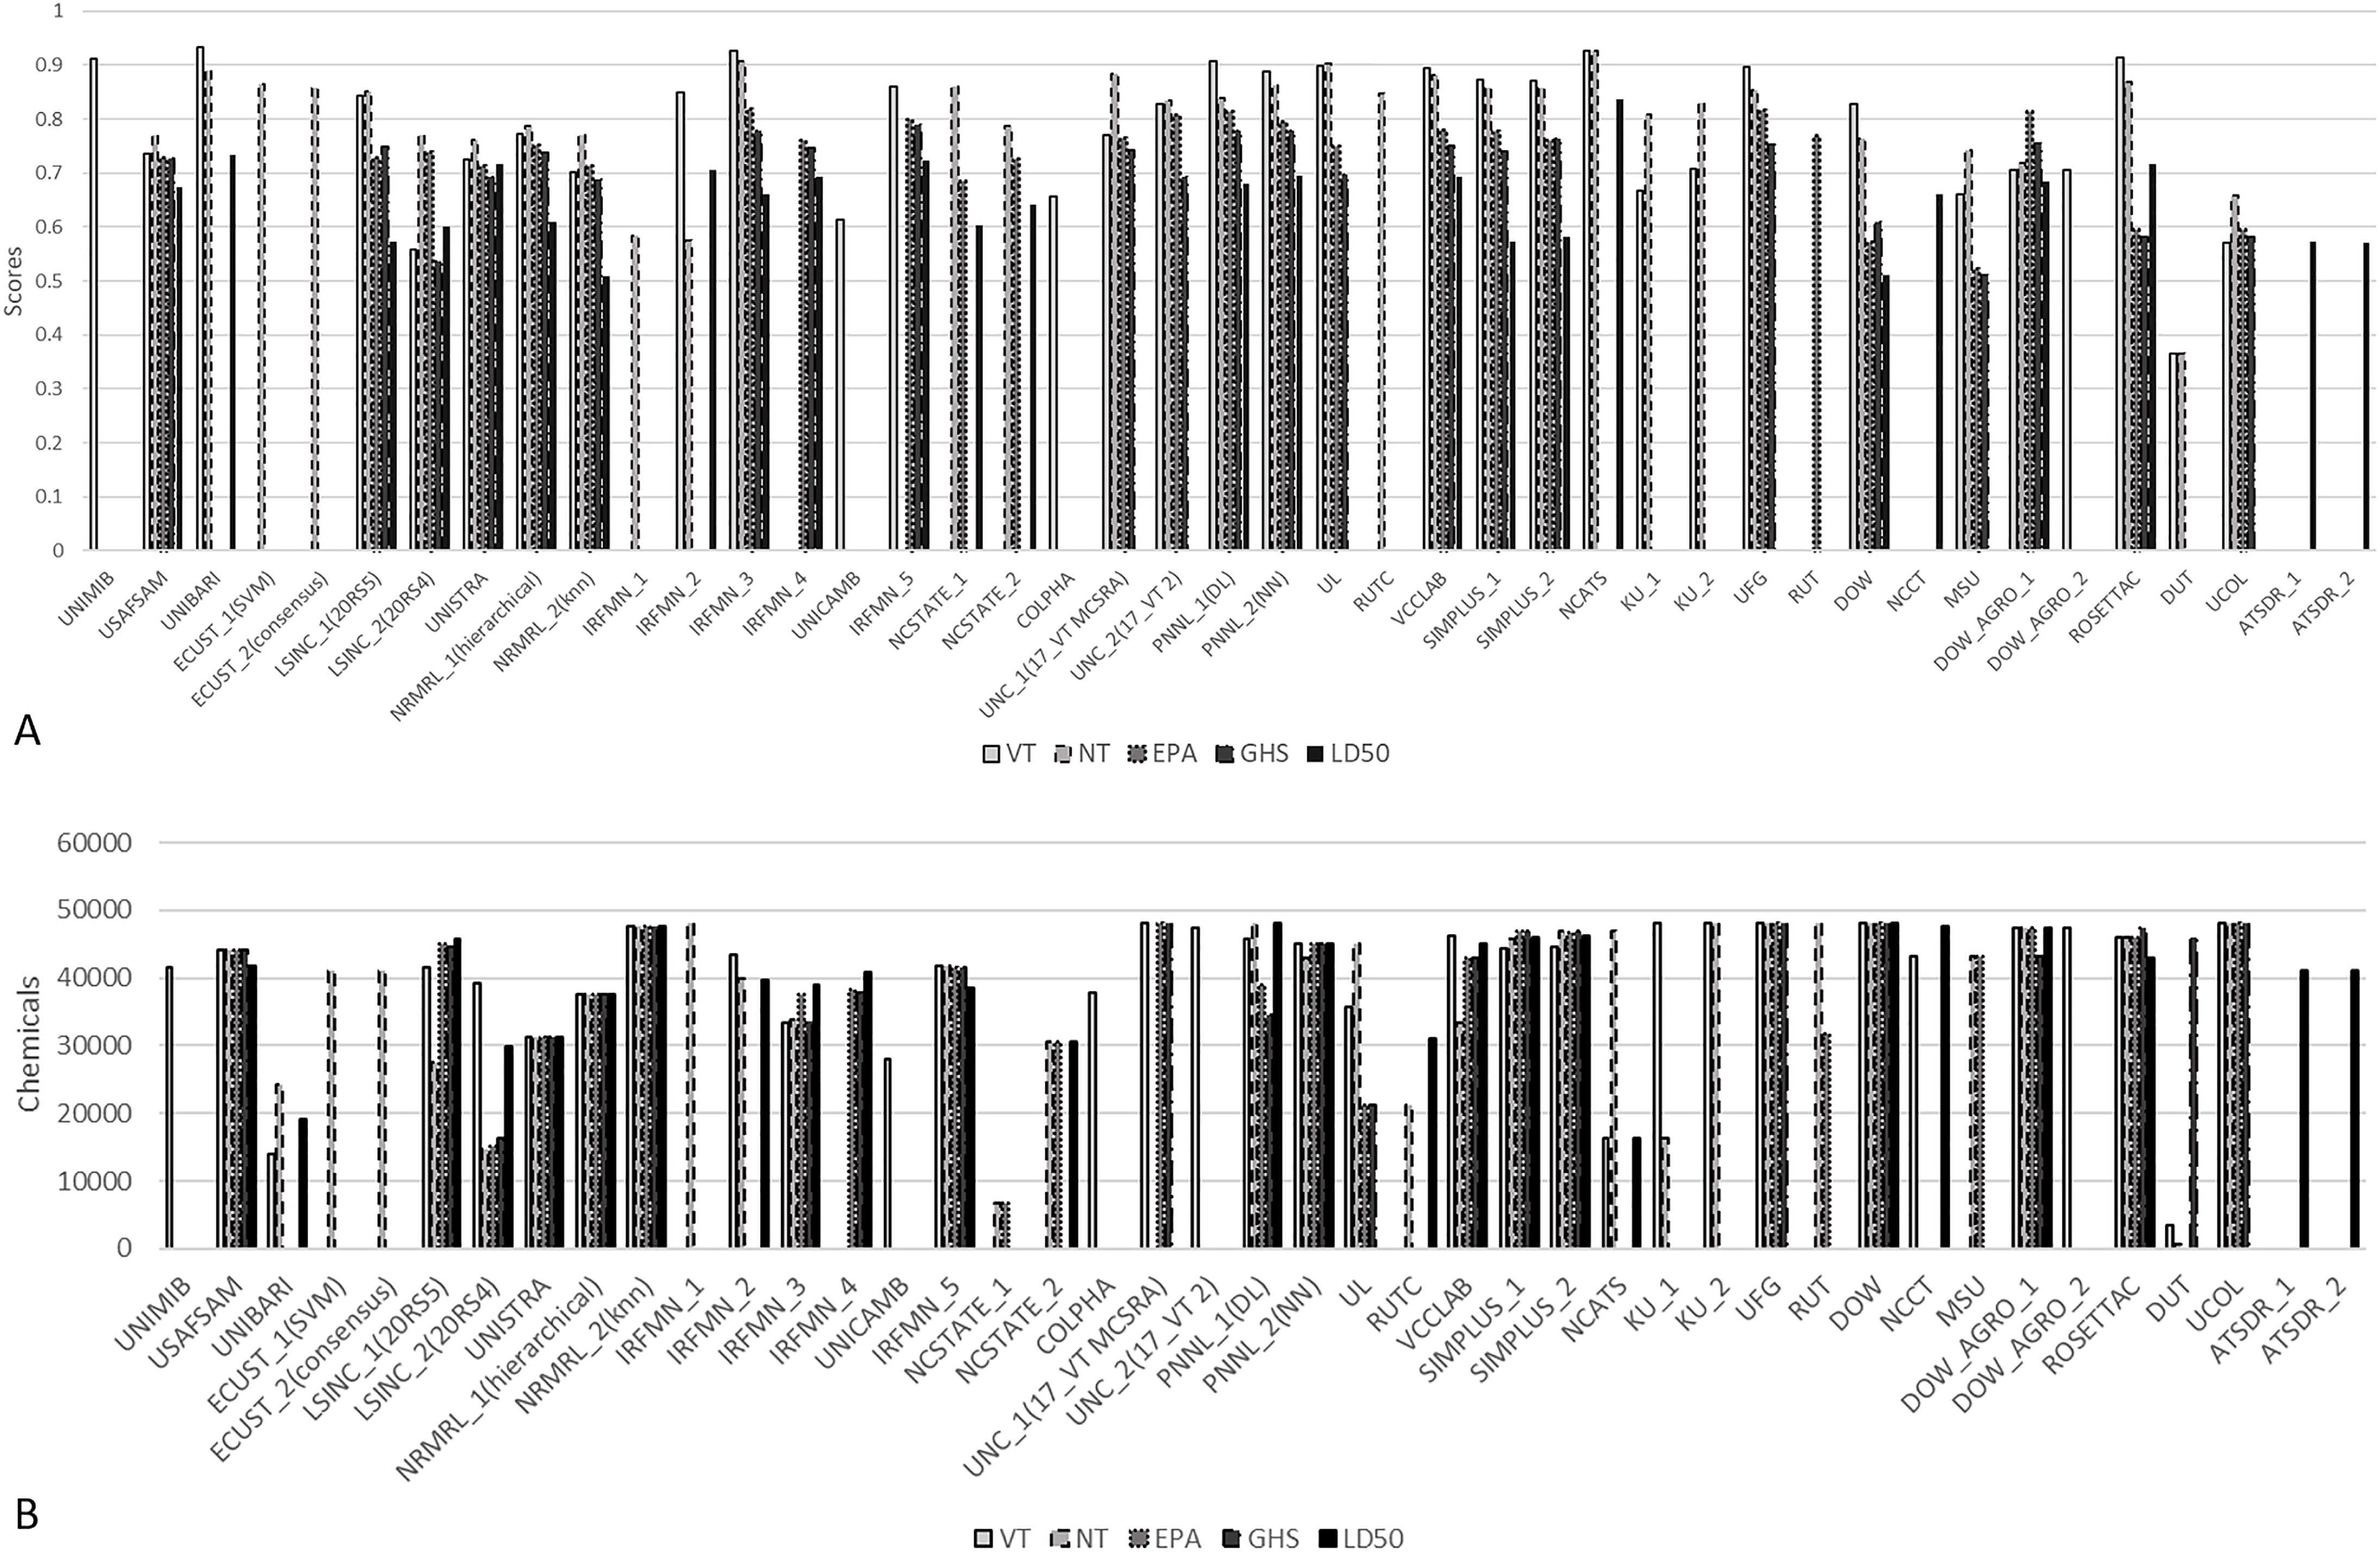
Methods: An acute oral toxicity data inventory for 11,992 chemicals was compiled, split into training and evaluation sets, and made available to 35 participating international research groups that submitted a total of 139 predictive models. Predictions that fell within the applicability domains of the submitted models were evaluated using external validation sets. These were then combined into consensus models to leverage strengths of individual approaches.

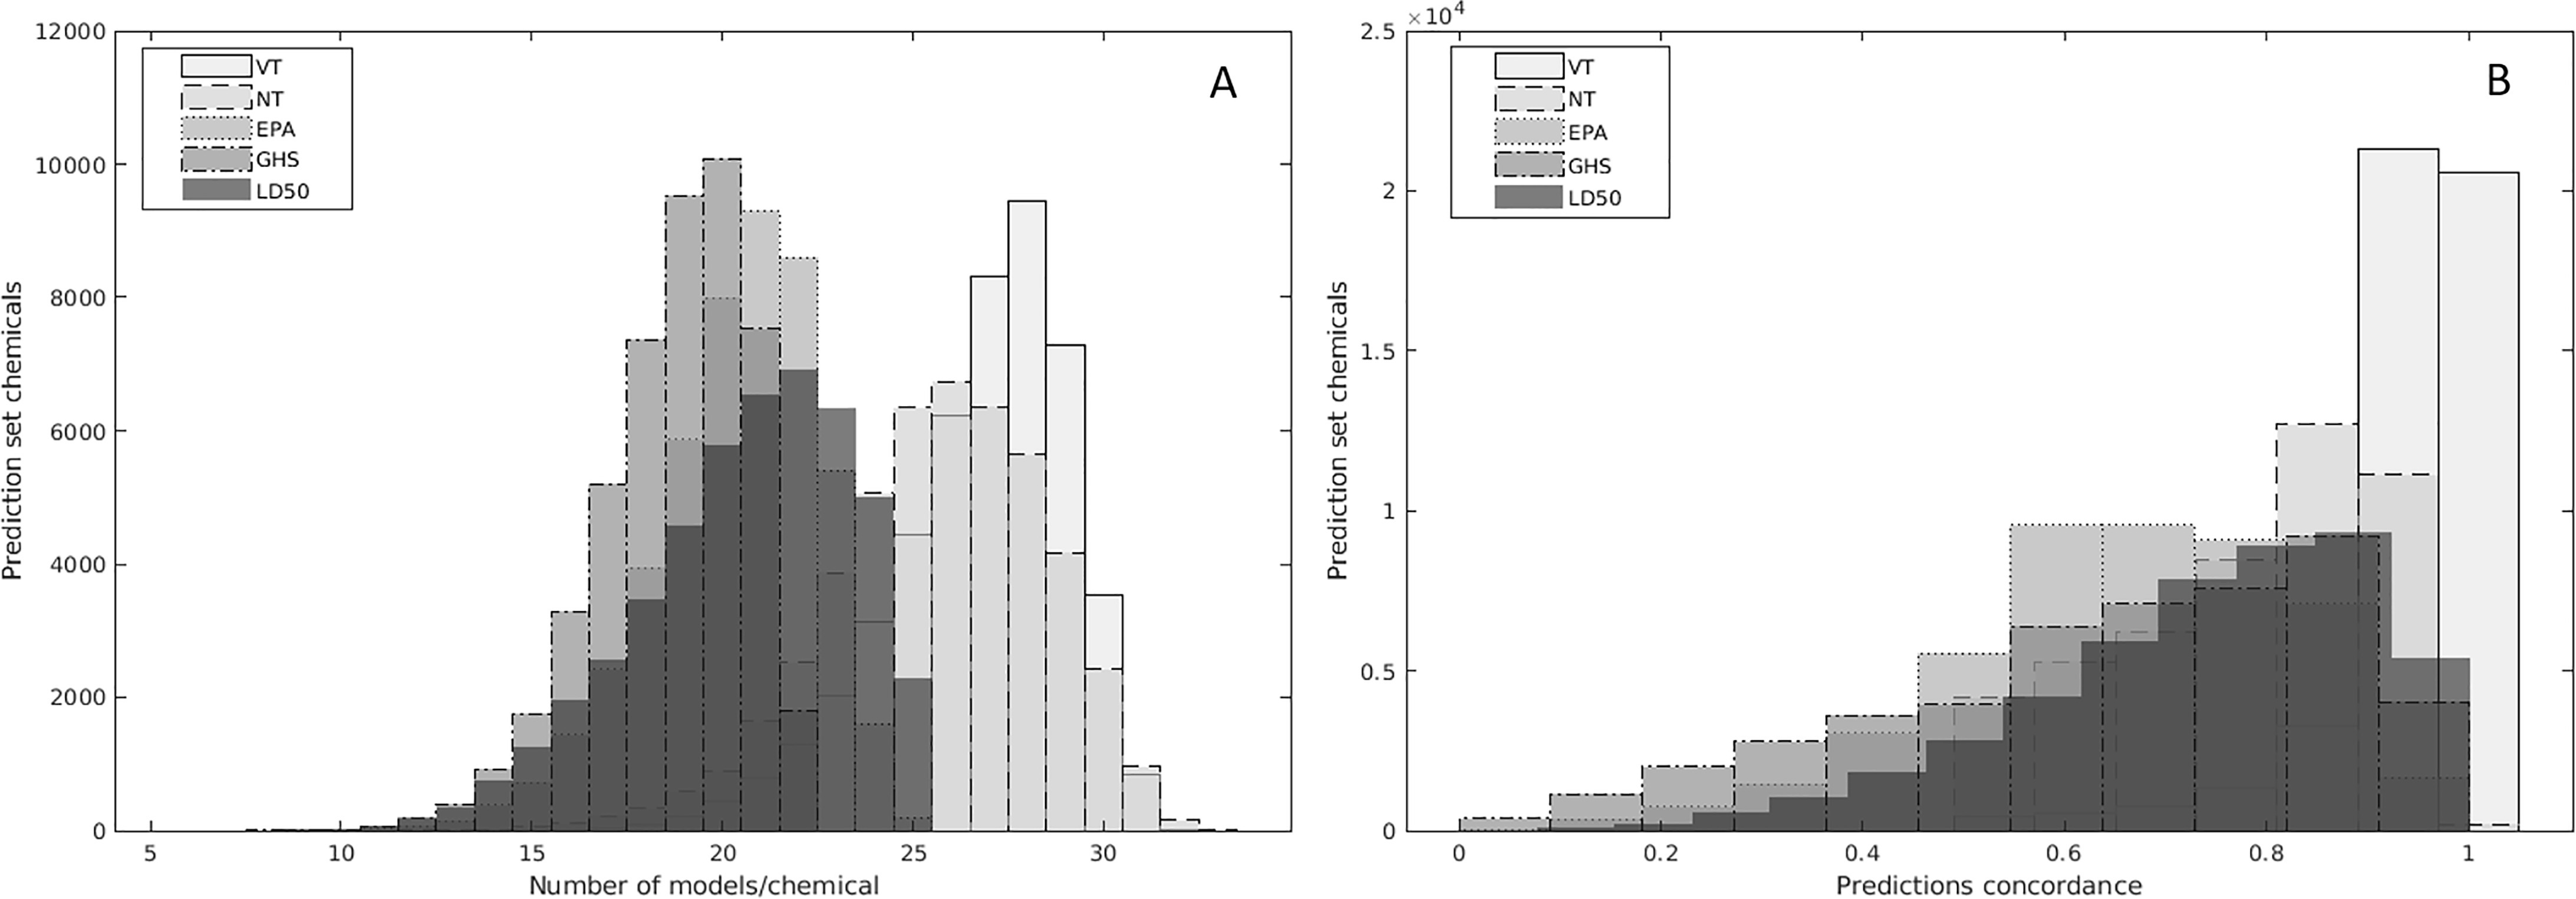
Results: The resulting consensus predictions, which leverage the collective strengths of each individual model, form the Collaborative Acute Toxicity Modeling Suite (CATMoS). CATMoS demonstrated high performance in terms of accuracy and robustness when compared with in vivo results.

Discussion: CATMoS is being evaluated by regulatory agencies for its utility and applicability as a potential replacement for in vivo rat acute oral toxicity studies. CATMoS predictions for more than 800,000 chemicals have been made available via the National Toxicology Program's Integrated Chemical Environment tools and data sets (ice.ntp.niehs.nih.gov). The models are also implemented in a free, standalone, open-source tool, OPERA, which allows predictions of new and untested chemicals to be made. https://doi.org/10.1289/EHP8495.


Figures

Figure 1A is a stacked bar graph plotting chemicals, ranging from 0 to 2000 in increments of 200 (y-axis) across log of dose of a substance that would be expected to kill half the animals in a test group, ranging from negative 2 to 5 in unit increments (x-axis) for training set and evaluation set. Figure 1B is a stacked bar graph plotting chemicals, ranging from 0 to 8000 in increments of 1000 (y-axis) across Environmental Protection Agency Distributed Structure-Searchable Toxicity and Public Cross Checked (x-axis) for training set and evaluation set.
Figure 1.
Characteristics of training (Supplemental Material 1) and evaluation sets (Supplemental Material 2). (A) Distribution of LD50 values. (B) Sources of the chemical structures.
Figure 2A is a clustered bar graph plotting scores, ranging from 0 to 1 in unit increments (y-axis) across U N I M I B, U S A F S A M, U N I B A R I, E C U S T underscore 1 (S V M), E C U S T underscore 2 (consensus), L S I N C underscore 1 (20 R 55), L S I N C underscore 2 (20 R 54), U N I S T R A, N R M R L underscore 1 (hierarchical), N R M R L underscore 2 (K Nearest Neighbor), I R F M N underscore 1, I R F M N underscore 2, I R F M N underscore 3, I R F M N underscore 4, N C S T A T E underscore 1, N C S T A T E underscore 2, C O L P H A, U N C underscore 1 (17 underscore V T M C S R A), U N C underscore 2 (17 underscore V T 2), P N N L underscore 1(D L), U L, R U T C, V C C L A B, S I M P L U S underscore 1, S I M P L U S underscore 2, N C A T S, K U underscore 1, K U underscore 2, U F G, R U T, D O W, N C C T, M S U, D O W underscore A G R O underscore 2, R O S E T T A C, D U T, U C O L, A T S D R underscore 1, and A T S D R underscore 2 (x-axis) for very toxic, non-toxic, Environmental Protection Agency, United Nations Globally Harmonized System of Classification and Labeling of Chemicals, and dose of a substance that would be expected to kill half the animals in a test group. Figures 2B is a clustered bar graph plotting scores, ranging from 0 to 60000 in increments of 10000 (y-axis) across U N I M I B, U S A F S A M, U N I B A R I, E C U S T underscore 1 (S V M), E C U S T underscore 2 (consensus), L S I N C underscore 1 (20 R 55), L S I N C underscore 2 (20 R 54), U N I S T R A, N R M R L underscore 1 (hierarchical), N R M R L underscore 2 (K Nearest Neighbor), I R F M N underscore 1, I R F M N underscore 2, I R F M N underscore 3, I R F M N underscore 4, N C S T A T E underscore 1, N C S T A T E underscore 2, C O L P H A, U N C underscore 1 (17 underscore V T M C S R A), U N C underscore 2 (17 underscore V T 2), P N N L underscore 1(D L), U L, R U T C, V C C L A B, S I M P L U S underscore 1, S I M P L U S underscore 2, N C A T S, K U underscore 1, K U underscore 2, U F G, R U T, D O W, N C C T, M S U, D O W underscore A G R O underscore 2, R O S E T T A C, D U T, U C O L, A T S D R underscore 1, and A T S D R underscore 2 (x-axis) for very toxic, non-toxic, Environmental Protection Agency, United Nations Globally Harmonized System of Classification and Labeling of Chemicals, and dose of a substance that would be expected to kill half the animals in a test group.
Figure 2.
Evaluation scores (A) and coverage of the prediction set (B) by the submitted models. See Supplemental Material 5 and 6 for Figure 2A and B, respectively. Modeling groups along the x-axis are defined in Table 4.
Figures 3A and 3B are stacked histograms plotting prediction set chemicals, ranging from 0 to 12000 in increments of 2000 and 0 to 2.5 times 10 begin superscript 4 end superscript in increments of 0.5 (y-axis) across number of models or chemicals, ranging from 5 to 30 in increments 5 and predictions concordance, ranging from 0 to 1 in increments of 0.2 (x-axis) for very toxic, non-toxic, Environmental Protection Agency, United Nations Globally Harmonized System of Classification and Labeling of Chemicals, and dose of a substance that would be expected to kill half the animals in a test group, respectively.
Figure 3.
Distributions of the coverage of the prediction set chemicals (A) and concordance among the single models (B) across the five end points. See Supplemental Material 7.
Figure 4 is a matrix plotting 0, 5, 50, 300, 500, 2000, 5000 milligrams per kilogram (columns) across very toxic, non-toxic, Environmental Protection Agency, United Nations Globally Harmonized System of Classification and Labeling of Chemicals, dose of a substance that would be expected to kill half the animals in a test group, and Weight of evidence (rows).
Figure 4.
Example of identifying the winning bin and reconciling the consensus predictions across five end points using the WoE (weight of evidence) approach. The columns represent the different bins from the EPA and GHS categories combined. The rows represent the five different end points and the WoE prediction. The arrows in each row represent the range of the prediction for each end point which were attributed a value of 1 and outside of it a value of 0. For the LD50 end point, the range limits are calculated by adding and subtracting the confidence interval of 0.3 in log value to the original LD50 prediction of 316mg/kg resulting in a range of 160 to 613mg/kg. The winning bin is determined by the maximum of the sum of each column in the WoE row. Note: EPA, U.S. Environmental Protection Agency; GHS, U.N. Globally Harmonized System of Classification and Labeling of Chemicals; LD50, dose of a substance that would be expected to kill half the animals in a test group; NT, nontoxic/toxic; VT, very toxic/not very toxic; WoE, weight of evidence.

References

    1. ACDLabs. 2019. Chemistry Software for Analytical and Chemical Knowledge Management. https://www.acdlabs.com/ [accessed 21 May 2019].
    1. Alberga D, Trisciuzzi D, Mansouri K, Mangiatordi GF, Nicolotti O. 2019. Prediction of acute oral systemic toxicity using a multifingerprint similarity approach. Toxicol Sci 167(2):484–495, PMID: 30371864, 10.1093/toxsci/kfy255. - DOI - PubMed
    1. Anderson S. 1984. Graphical representation of molecules and substructure-search queries in MACCStm. J Mol Graph 2(3):83–90, 10.1016/0263-7855(84)80060-0. - DOI
    1. Ballabio D, Grisoni F, Consonni V, Todeschini R. 2019. Integrated QSAR models to predict acute oral systemic toxicity. Mol Inf 38(8–9):1800124, PMID: 30549437, 10.1002/minf.201800124. - DOI - PubMed
    1. Ballabio D, Vasighi M, Consonni V, Kompany-Zareh M. 2011. Genetic algorithms for architecture optimisation of counter-propagation artificial neural networks. Chemometr Intell Lab Syst 105(1):56–64, 10.1016/j.chemolab.2010.10.010. - DOI

Publication types

LinkOut - more resources