. 2021 Apr 30;18(4):e1003585.
doi: 10.1371/journal.pmed.1003585. eCollection 2021 Apr.

Maximizing and evaluating the impact of test-trace-isolate programs: A modeling study

Affiliations

Maximizing and evaluating the impact of test-trace-isolate programs: A modeling study

Kyra H Grantz et al. PLoS Med. .

Abstract

Background: Test-trace-isolate programs are an essential part of coronavirus disease 2019 (COVID-19) control that offer a more targeted approach than many other nonpharmaceutical interventions. Effective use of such programs requires methods to estimate their current and anticipated impact.

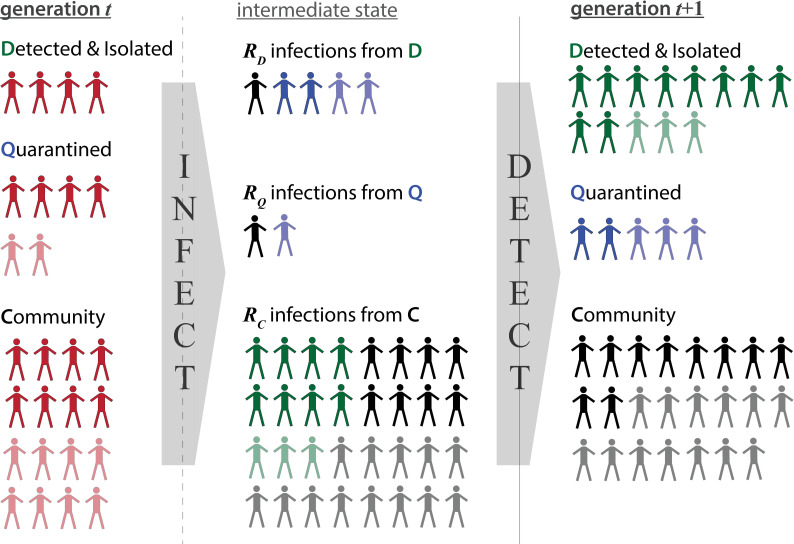
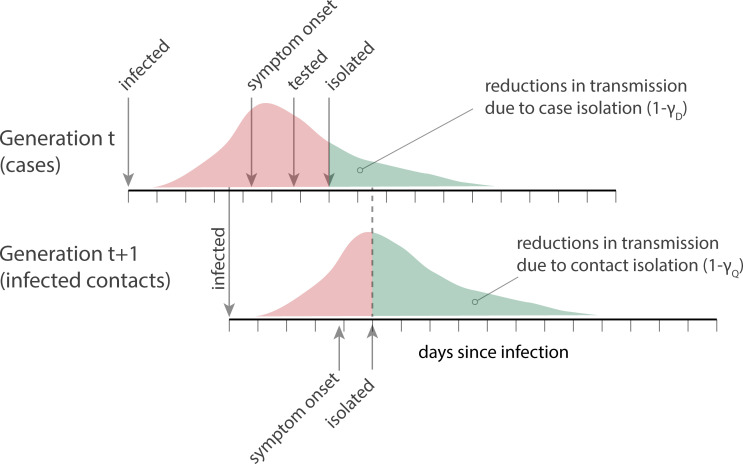
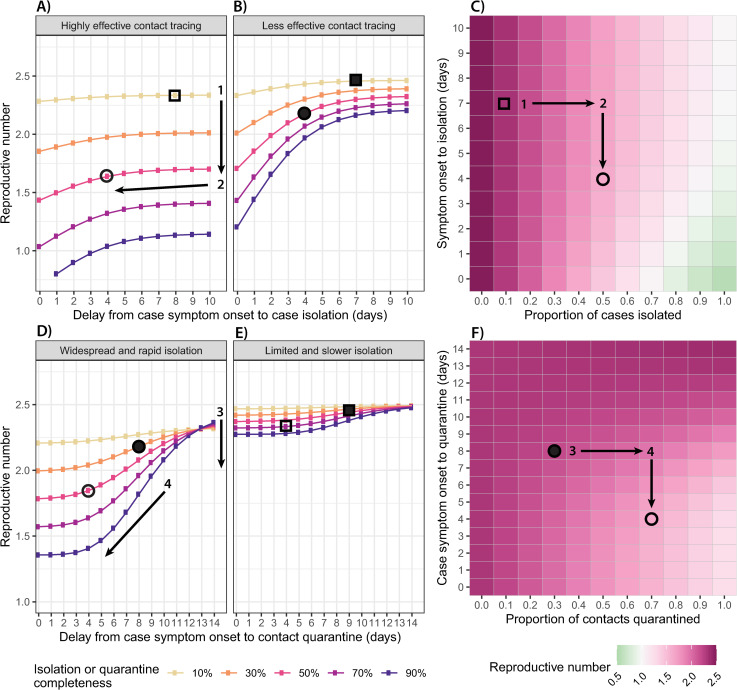
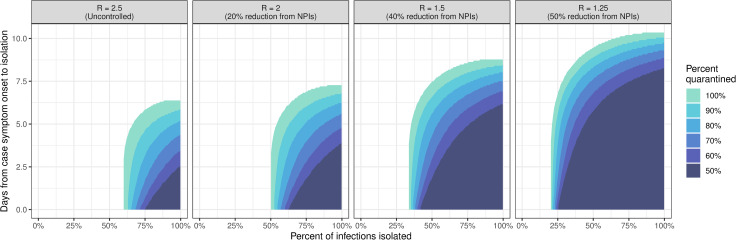
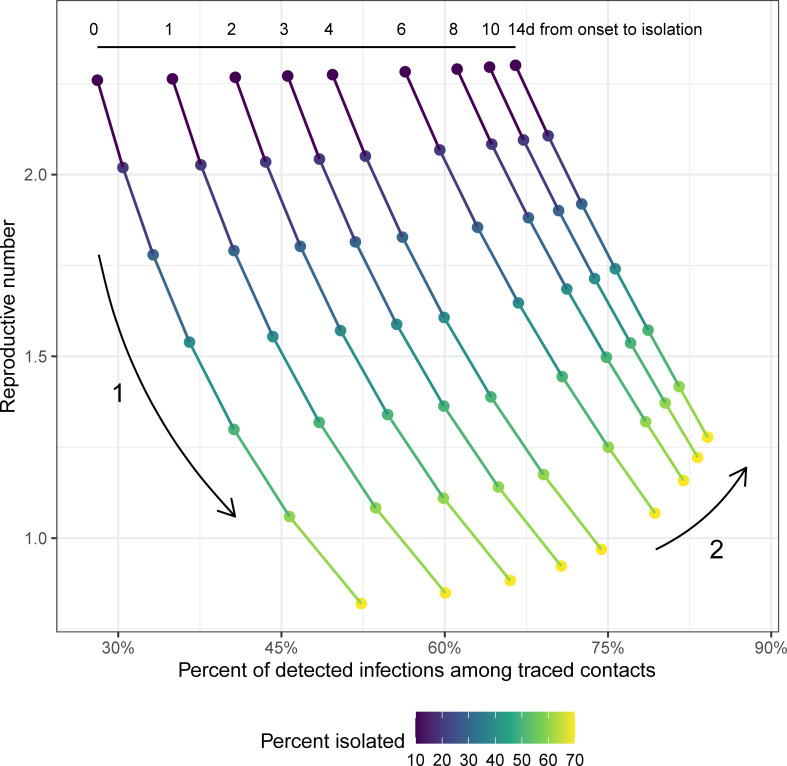
Methods and findings: We present a mathematical modeling framework to evaluate the expected reductions in the reproductive number, R, from test-trace-isolate programs. This framework is implemented in a publicly available R package and an online application. We evaluated the effects of completeness in case detection and contact tracing and speed of isolation and quarantine using parameters consistent with COVID-19 transmission (R0: 2.5, generation time: 6.5 days). We show that R is most sensitive to changes in the proportion of cases detected in almost all scenarios, and other metrics have a reduced impact when case detection levels are low (<30%). Although test-trace-isolate programs can contribute substantially to reducing R, exceptional performance across all metrics is needed to bring R below one through test-trace-isolate alone, highlighting the need for comprehensive control strategies. Results from this model also indicate that metrics used to evaluate performance of test-trace-isolate, such as the proportion of identified infections among traced contacts, may be misleading. While estimates of the impact of test-trace-isolate are sensitive to assumptions about COVID-19 natural history and adherence to isolation and quarantine, our qualitative findings are robust across numerous sensitivity analyses.

Conclusions: Effective test-trace-isolate programs first need to be strong in the "test" component, as case detection underlies all other program activities. Even moderately effective test-trace-isolate programs are an important tool for controlling the COVID-19 pandemic and can alleviate the need for more restrictive social distancing measures.


Conflict of interest statement

I have read the journal’s policy and the authors of this manuscript have the following competing interests: JL is a paid statistical advisor for PLOS Medicine.

Figures

Fig 1
Fig 1
Conceptual representation of the model algorithm, where infections in generation t (left column) infect new individuals according to RD, RQ, and RC reproductive numbers that populate the INFECT matrix (center column). These newly propagated infections are then distributed into D, Q, and C compartments in generation t+1 (right column) according to the various detection transition probabilities specified in the DETECT matrix (colors of center column). Symptomatic individuals (darker shading) may be more likely to be detected than asymptomatic individuals (lighter shading).
Fig 2
Fig 2. Conceptual representation of test-trace-isolate programs, where detection of a case in generation t through widespread testing and subsequent isolation reduces onward transmission to generation t+1.
Individuals in generation t+1 are then traced and quarantined (and subsequently isolated, if the contact is a suspected or confirmed case) to reduce onward transmission from those who may be infected.
Fig 3
Fig 3
Improvements to case isolation and contact quarantine: Impact of case isolation timing (x-axis) and completeness (line colors) on the effective reproductive number (y-axis) for (A) a highly effective contact tracing program and (B) a less effective contact tracing program. (C) Heat map of the effective reproductive number across a range of case isolation timing (y-axis) and completeness (x-axis) scenarios, assuming that contact tracing is highly effective. Impact of contact tracing timing (x-axis) and completeness (line colors) on the effective reproductive number (y-axis) for (D) a widespread and rapid case isolation scenario and (E) a less effective and slower case isolation scenario. (F) Heat map of the effective reproductive number across a range of contact tracing timing (y-axis) and completeness (x-axis) scenarios, assuming that detection and isolation of index cases is widespread and rapid. For all panels, the open shapes mark example scenarios with highly effective contact tracing (70% quarantined on average 4 days after case symptom onset) in contrast to the filled shapes of a less effective contact tracing scenario (30% quarantined after 8 days). Circles mark example scenarios with widespread and rapid case isolation (50% isolated on average 4 days after case symptom onset) in contrast to squares, which have limited and slower case isolation (10% isolated after 7 days). Shapes display consistent scenarios across all panels in the figure.
Fig 4
Fig 4
Isolation strategies (timing and completeness) capable of achieving R<1 when a given proportion of contacts (50% to 100%) are quarantined on the same day as case isolation. These strategies are shown for 4 possible baseline values of R, assuming other nonpharmaceutical interventions (NPIs) are in effect to reduce transmission from the uncontrolled scenario, R = 2.5.
Fig 5
Fig 5. Relationship between R and the proportion of detected infections among traced contacts.
Each position along a line shows a single test-trace-isolate strategy, with a fixed delay from case symptom onset to isolation (shown in the numbers at the top) and 90% of contacts quarantined on the same day as case isolation. Points are colored by the proportion of infections detected and isolated through testing. When isolation timing remains constant, higher case isolation completeness corresponds with increases in the proportion of detected infections among traced contacts and reductions in R (Arrow 1). However, increases in the proportion of detected infections among traced contacts could indicate an increase in R, if the delay to case isolation is also increasing, thus leading to more secondary cases among traced contacts (Arrow 2).

References

    1. Zheng Q, Jones FK, Leavitt SV, Ung L, Labrique AB, Peters DH, et al.. HIT-COVID, a global database tracking public health interventions to COVID-19. Scientific Data. 2020;7(1):286. 10.1038/s41597-020-00610-2 - DOI - PMC - PubMed
    1. Desvars-Larrive A, Dervic E, Haug N, Niederkrotenthaler T, Chen J, Di Natale A, et al.. A structured open dataset of government interventions in response to COVID-19. Scientific Data. 2020;7(1):285. 10.1038/s41597-020-00609-9 - DOI - PMC - PubMed
    1. Nicola M, Alsafi Z, Sohrabi C, Kerwan A, Al-Jabir A, Iosifidis C, et al.. The socio-economic implications of the coronavirus pandemic (COVID-19): A review. Int J Surg. 2020;78:185–93. 10.1016/j.ijsu.2020.04.018 - DOI - PMC - PubMed
    1. United Nations. Policy Brief: The Impact of COVID-19 on children; 2020. Available from: https://unsdg.un.org/resources/policy-brief-impact-covid-19-children.
    1. Wenham C, Smith J, Morgan R. COVID-19: the gendered impacts of the outbreak. Lancet. 2020;395(10227):846–8. 10.1016/S0140-6736(20)30526-2 - DOI - PMC - PubMed

Publication types