. 2021 Apr 30;17(4):e1009560.
doi: 10.1371/journal.ppat.1009560. eCollection 2021 Apr.

Mutational pressure by host APOBEC3s more strongly affects genes expressed early in the lytic phase of herpes simplex virus-1 (HSV-1) and human polyomavirus (HPyV) infection

Affiliations

Mutational pressure by host APOBEC3s more strongly affects genes expressed early in the lytic phase of herpes simplex virus-1 (HSV-1) and human polyomavirus (HPyV) infection

Maxwell Shapiro et al. PLoS Pathog. .

Abstract

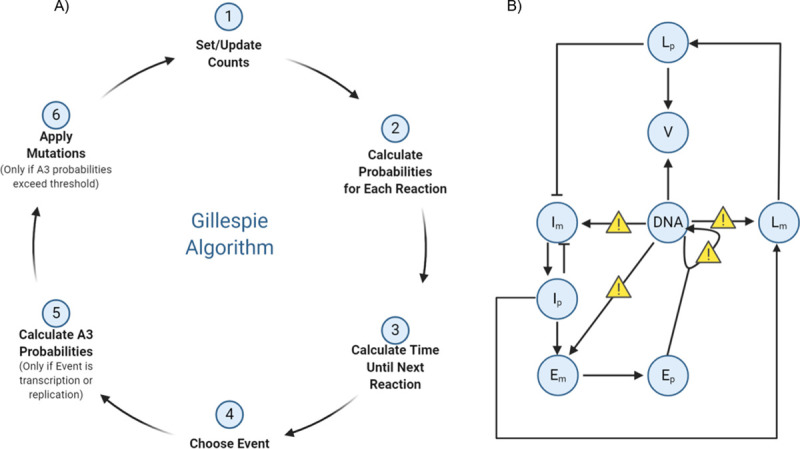
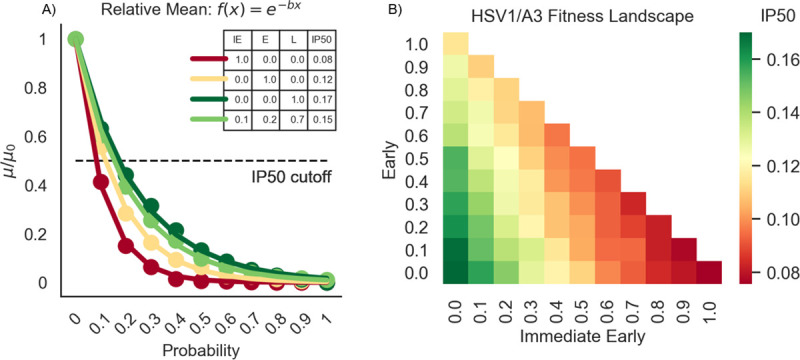
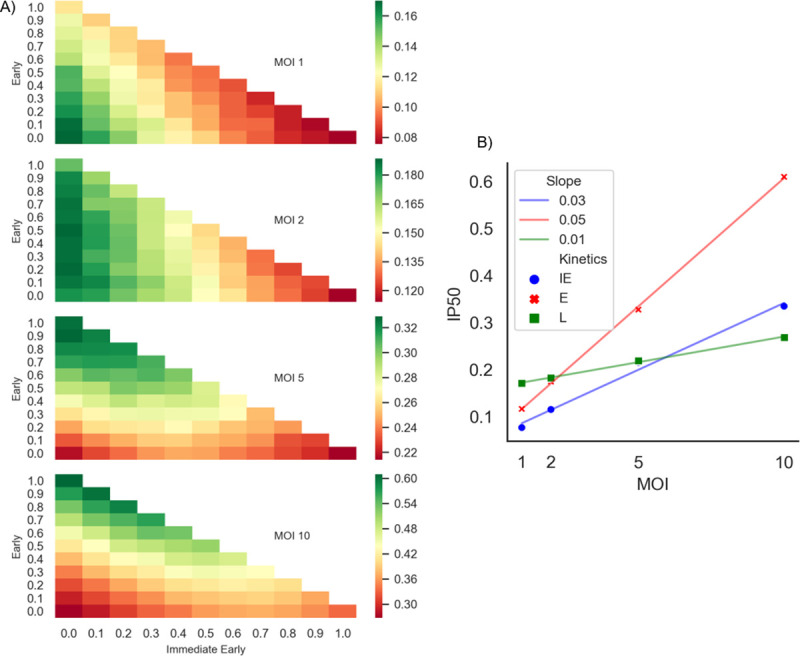
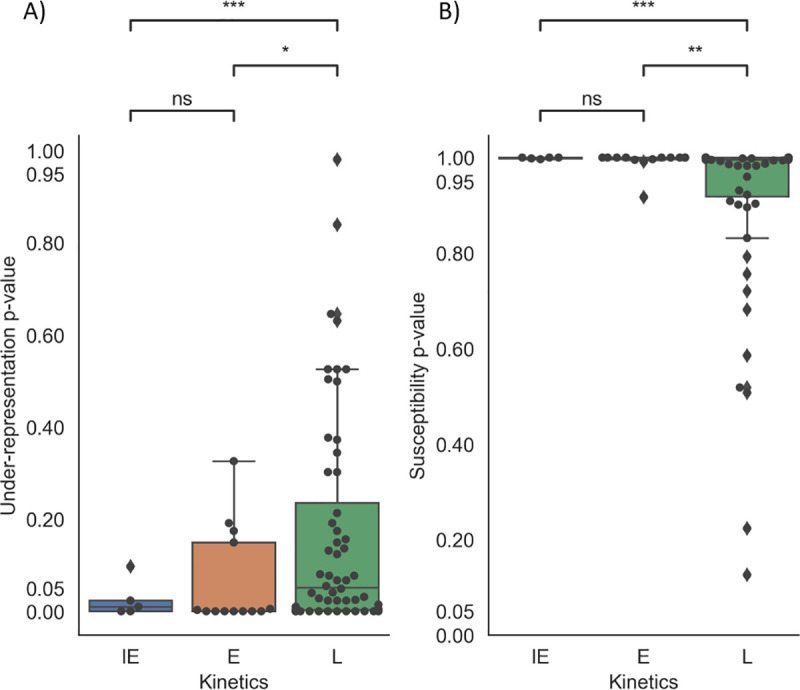
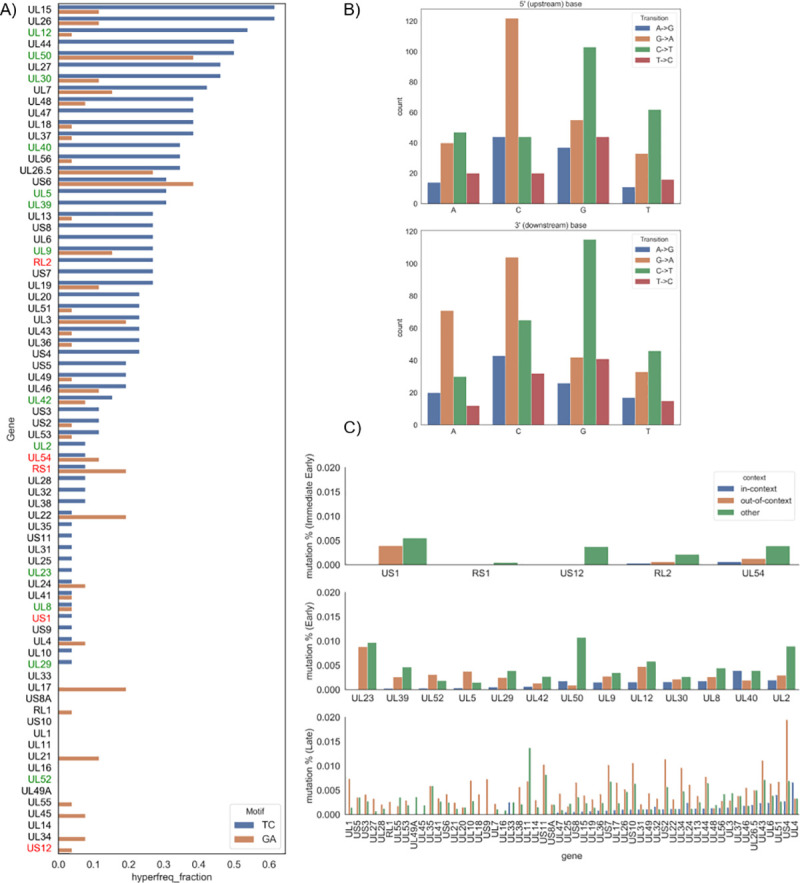
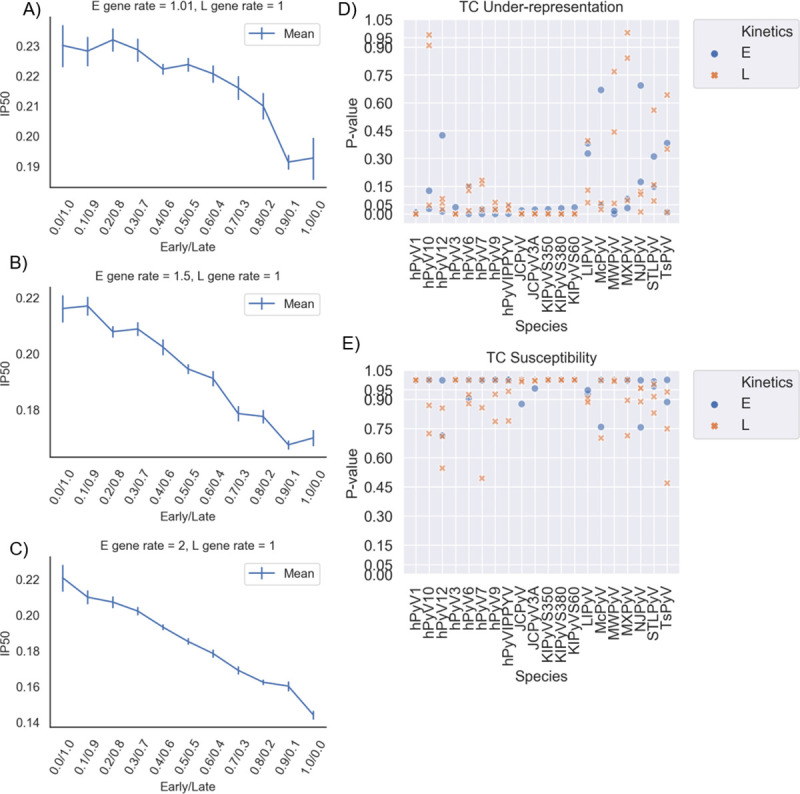
Herpes-Simplex Virus 1 (HSV-1) infects most humans when they are young, sometimes with fatal consequences. Gene expression occurs in a temporal order upon lytic HSV-1 infection: immediate early (IE) genes are expressed, then early (E) genes, followed by late (L) genes. During this infection cycle, the HSV-1 genome has the potential for exposure to APOBEC3 (A3) proteins, a family of cytidine deaminases that cause C>U mutations on single-stranded DNA (ssDNA), often resulting in a C>T transition. We developed a computational model for the mutational pressure of A3 on the lytic cycle of HSV-1 to determine which viral kinetic gene class is most vulnerable to A3 mutations. Using in silico stochastic methods, we simulated the infectious cycle under varying intensities of A3 mutational pressure. We found that the IE and E genes are more vulnerable to A3 than L genes. We validated this model by analyzing the A3 evolutionary footprints in 25 HSV-1 isolates. We find that IE and E genes have evolved to underrepresent A3 hotspot motifs more so than L genes, consistent with greater selection pressure on IE and E genes. We extend this model to two-step infections, such as those of polyomavirus, and find that the same pattern holds for over 25 human Polyomavirus (HPyVs) genomes. Genes expressed earlier during infection are more vulnerable to mutations than those expressed later.


Conflict of interest statement

The authors have declared that no competing interests exist.

Figures

Fig 1
Fig 1. Gillespie Model implementation.
The model is based on the ordinary differential equations (ODEs) in Eqs 1–8 (see Methods). A) Schematic diagram of Gillespie algorithm implementation. Starting with molecule counts, we calculate probabilities of a certain “reaction” event such as transcription of IE, E, or L genes; translation of mRNA; replication; or virion creation, among others. Next, we update time, and then randomly choose which event occurs from the previously calculated probabilities. Next, if a chosen event is a transcription or replication event susceptible to A3 mutation (here we consider transcription and replication), we set another probability of whether mutation from A3 occurs. Finally, we update the counts and repeat until a certain time threshold or a pre-defined number of cycles have passed. B) Components and interactions in the viral life cycle model. Where mutations may occur are denoted by yellow signs. Im, Ip denote IE gene mRNA and protein, respectively; similarly for Em,Ep,Lr, and Lp. V is virion.
Fig 2
Fig 2. Non-linear least squares analysis and subsequent fitness landscape of HSV-1 IE, E and L genes show that IE and E genes are more vulnerable to A3 mutation than L genes.
A) Relative mean, defined as the ratio of means (μ) from each increasing mutation probability versus the mean when the mutation probability is zero (μ0). For each baseline probability, these values are fit to an exponential curve f(x) = e-bx using non-linear least squares. The numbers for each stratification in the legend denotes the half-maximal inhibitory probability (IP50) for that stratum. The IP50 is analogous to the half-maximal inhibitory concentration–it measures how high of a mutation probability we need to reduce μ/μ0 by 50%, calculated by ln(2)b. Shown here are the strata: IE/E/L = .1/.2/.7 (light green), IE/E/L = 1/0/0 (dark red), IE/E/L = 0/1/0 (yellow), and IE/E/L = 0/0/1 (dark green). B) A heatmap of all strata. The gradient up the x-axis denotes a higher proportion of pressure on IE genes. The gradient up the y-axis denotes a higher proportion of pressure on E genes. Finally, the gradient down both the x-axis and y-axis denotes a higher proportion of pressure on L genes. The intensity of each color reflects the IP50 for that stratification–redder indicates a higher A3 pressure (low IP50), and greener indicates a lesser A3 pressure (high IP50). Note that the line colors in A) correspond to the heatmap intensities of those strata in B).
Fig 3
Fig 3. Increasing MOI alleviates pressure on IE and E genes, while A3 pressure on L genes remains more constant.
A) Heatmap for MOI = 1 (top) as described in Fig 2B is compared to heatmaps for MOIs of 2,5 and 10. The intensity of colors represents the IP50 values calculated for each of the MOI categories. The relative A3 related pressures on E genes are alleviated as we increase the MOI, while there is nominal increase in the L genes. For each MOI, a different scale is used to highlight the relative IP50 changes. B) A regression of IE (blue), E (red), and L (green) describing how much the IP50 changes as we increase MOI on the three extreme stratifications. L gene IP50 values has a negligible change, as shown its slope (0.01).
Fig 4
Fig 4. CDUR analysis on HSV-1 strain 17 shows that IE and E genes are significantly under more A3-related evolutionary pressure relative to L genes.
A) Under-Representation and B) Susceptibility results for HSV-1 reference strain 17. We performed a pairwise comparison the IE, E and L genes using Welch’s t-test. There was no significance between IE and E under-representation, but there were significant differences between IE/L and E/L genes. *: P< 0.05, **: P<0.01, ***: P<0.001, ns:not significant. CDUR results for all genes were subjected to FDR correction using the Benjamini-Hochberg method.
Fig 5
Fig 5. Hypermutation and SNV analysis shows that IE genes yield fewer mutations during HSV-1 infection.
A) hyperfreq, a Bayesian analysis tool to determine hypermutation, was used on the 26-genome alignment from [54]. The hyperfreq_fraction measure describes the fraction of analyzed genomes that were shown to be hypermutated in TC (blue) or GA (orange) motifs. This was run for each gene in HSV-1. Red is for IE genes, green for E genes, and black for L genes. B) SNVs determined from 10 clinical samples using a threshold for allelic fraction using bcftools (see Methods). Shown are transitions: A>G in blue, G>A in orange, C>T in green, and T>C in red. The x-axis in the top plot shows the 5-prime context for a given SNV, while the bottom shows the 3-prime context. C) The SNV counts were mapped to each gene and normalized by the gene length to determine the mutation % for Immediate Early genes (top), Early genes (middle), and Late genes (bottom).
Fig 6
Fig 6. Results from two-step PyV Gillespie model and subsequent CDUR results show a similar pattern to HSV-1 of A3-related evolutionary pressure, under-representation, and susceptibility.
A-C) Each plot represents particular gene expression rates for E and L expression. Blue lines represent the IP50 corresponding to the weights b from the least squares results when we fit the relative means of the simulations into the exponential decay equation f(x) = e-bx. Note that, as opposed to the HSV-1 case that had three categories of gene kinetics, here a two-dimensional graph for IP50 was sufficient. D-E) CDUR P-values for 20 NCBI RefSeq genomes (see Methods) for E and L genes. (D) shows the values for under-representation, while (E) shows susceptibility for TC hotspots. Since there are only 5 genes in each genome, the P values were not FDR corrected.

References

    1. Chi CC, Wang SH, Delamere FM, Wojnarowska F, Peters MC, Kanjirath PP. Interventions for prevention of herpes simplex labialis (cold sores on the lips). Vol. 2015, Cochrane Database of Systematic Reviews. John Wiley and Sons Ltd; 2015. - PMC - PubMed
    1. Whitley RJ. Herpes simplex encephalitis: Adolescents and adults. Vol. 71, Antiviral Research. Elsevier; 2006. p. 141–8. 10.1016/j.antiviral.2006.04.002 - DOI - PubMed
    1. Kennedy PG. Herpes simplex virus type 1 and Bell’s palsy—a current assessment of the controversy. J Neurovirol [Internet]. 2010. February [cited 2017 Aug 29];16(1):1–5. Available from: http://link.springer.com/10.3109/13550280903552446 - DOI - PMC - PubMed
    1. Fields BN, Knipe DM, Howley PM. Fields Virology. 6th ed. Philadelphia: Wolters Kluwer Health/Lippincott Williams & Wilkins; 2013.
    1. Koonin E V., Krupovic M, Yutin N. Evolution of double-stranded DNA viruses of eukaryotes: From bacteriophages to transposons to giant viruses. Ann N Y Acad Sci [Internet]. 2015. Apr 1 [cited 2021 Mar 12];1341(1):10–24. Available from: /pmc/articles/PMC4405056/ 10.1111/nyas.12728 - DOI - PMC - PubMed

Publication types

MeSH terms

LinkOut - more resources