Investigating whole-brain metabolite abnormalities in the chronic stages of moderate or severe traumatic brain injury
- PMID: 33930238
- PMCID: PMC9212770
- DOI: 10.1002/pmrj.12623
Investigating whole-brain metabolite abnormalities in the chronic stages of moderate or severe traumatic brain injury
Abstract
Background: Evidence suggests that neurometabolic abnormalities can persist after traumatic brain injury (TBI) and drive clinical symptoms such as fatigue and cognitive disruption. Magnetic resonance spectroscopy has been used to investigate metabolite abnormalities following TBI, but few studies have obtained data beyond the subacute stage or over large brain regions.
Objective: To measure whole-brain metabolites in chronic stages of TBI.
Design: Observational study.
Setting: University.
Participants: Eleven men with a moderate or severe TBI more than 12 months prior and 10 age-matched healthy controls completed whole-brain spectroscopic imaging.
Main measures: Ratios of N-acetylaspartate (NAA), choline (CHO), and myo-inositol (MI) to creatine (CR) were measured in whole-brain gray and white matter as well as 64 brain regions of interest. Arterial spin labeling (ASL) data were also collected to investigate whether metabolite abnormalities were accompanied by differences in cerebral perfusion.
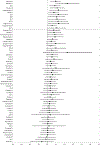
Results: There were no differences in metabolite ratios within whole-brain gray and white matter regions of interest (ROIs). Linear regression showed lower NAA/CR in the white matter of the left occipital lobe but higher NAA/CR in the gray matter of the left parietal lobe. Metabolite abnormalities were observed in several brain regions in the TBI group including the corpus callosum, putamen, and posterior cingulate. However, none of the findings survived correction for multiple comparison. There were no differences in cerebral blood flow between patients and controls.
Conclusion: Higher MI/CR may indicate ongoing gliosis, and it has been suggested that low CHO/CR at chronic time points may indicate cell death or lack of healthy turnover and repair. However, with the small sample size of this study, we caution against the over interpretation of our results. None of the findings within ROIs survived correction for multiple comparison. Thus, they may be considered possible avenues for future research in this area.
© 2021 American Academy of Physical Medicine and Rehabilitation.
Figures


References
-
- Centers for Disease Control and Prevention. Report to Congress on Traumatic Brain Injury in the United States: Epidemiology and Rehabilitation. Atlanta, GA: Centers for Disease Control and Prevention; 2014. - PubMed
-
- Zaloshnja E, Miller T, Langlois JA, Selassie AW. Prevalence of long-term disability from traumatic brain injury in the civilian population of the United States, 2005. J Head Trauma Rehabil. 2008;23(6):394–400. - PubMed
-
- Selassie AW, Zaloshnja E, Langlois JA, Miller T, Jones P, Steiner C. Incidence of long-term disability following traumatic brain injury hospitalization, United States, 2003. J Head Trauma Rehabil. 2008;23(2):123–131. - PubMed
-
- Thurman DJ, Alverson C, Dunn KA, Guerrero J, Sniezek JE. Traumatic brain injury in the United States: a public health perspective. J Head Trauma Rehabil. 1999;14(6):602–615. - PubMed

