. 2021 Jun 14;39(6):866-882.e11.
doi: 10.1016/j.ccell.2021.03.012. Epub 2021 Apr 29.

Promotion of cholangiocarcinoma growth by diverse cancer-associated fibroblast subpopulations

Affiliations

Promotion of cholangiocarcinoma growth by diverse cancer-associated fibroblast subpopulations

Silvia Affo et al. Cancer Cell. .

Erratum in

  • Promotion of cholangiocarcinoma growth by diverse cancer-associated fibroblast subpopulations.
    Affo S, Nair A, Brundu F, Ravichandra A, Bhattacharjee S, Matsuda M, Chin L, Filliol A, Wen W, Song X, Decker A, Worley J, Caviglia JM, Yu L, Yin D, Saito Y, Savage T, Wells RG, Mack M, Zender L, Arpaia N, Remotti HE, Rabadan R, Sims P, Leblond AL, Weber A, Riener MO, Stockwell BR, Gaublomme J, Llovet JM, Kalluri R, Michalopoulos GK, Seki E, Sia D, Chen X, Califano A, Schwabe RF. Affo S, et al. Cancer Cell. 2021 Jun 14;39(6):883. doi: 10.1016/j.ccell.2021.05.010. Cancer Cell. 2021. PMID: 34129825 Free PMC article. No abstract available.

Abstract

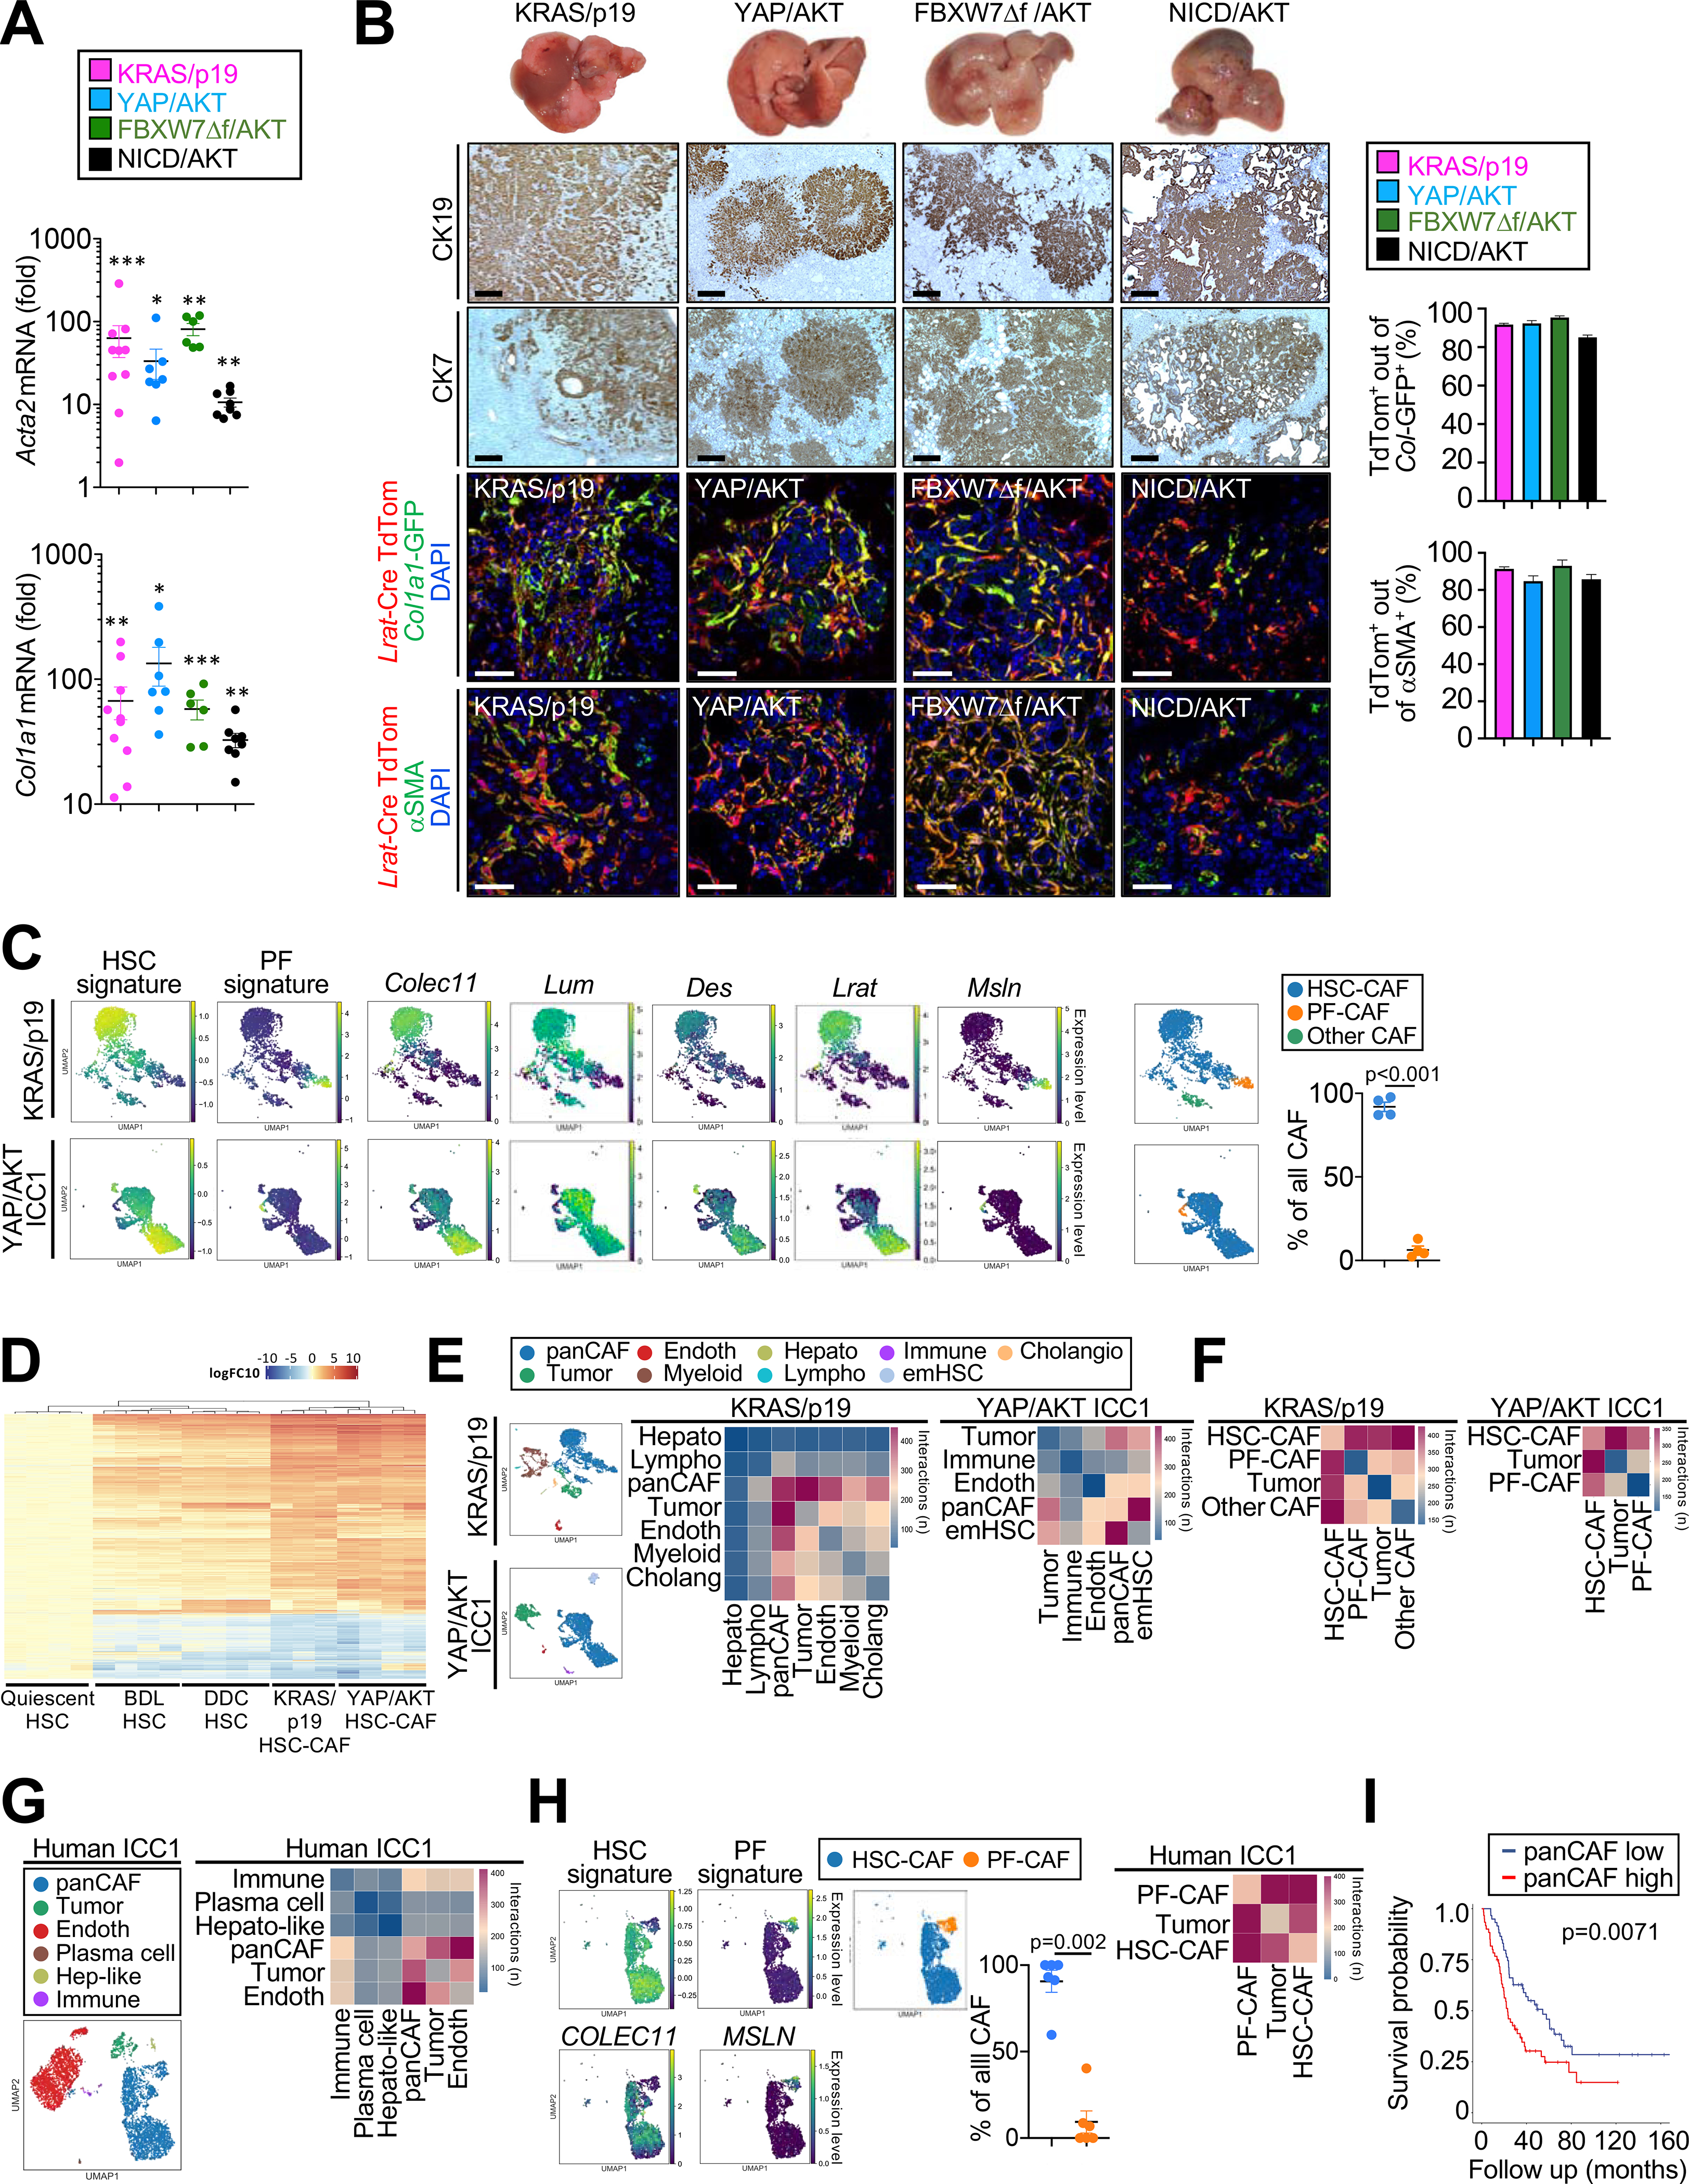
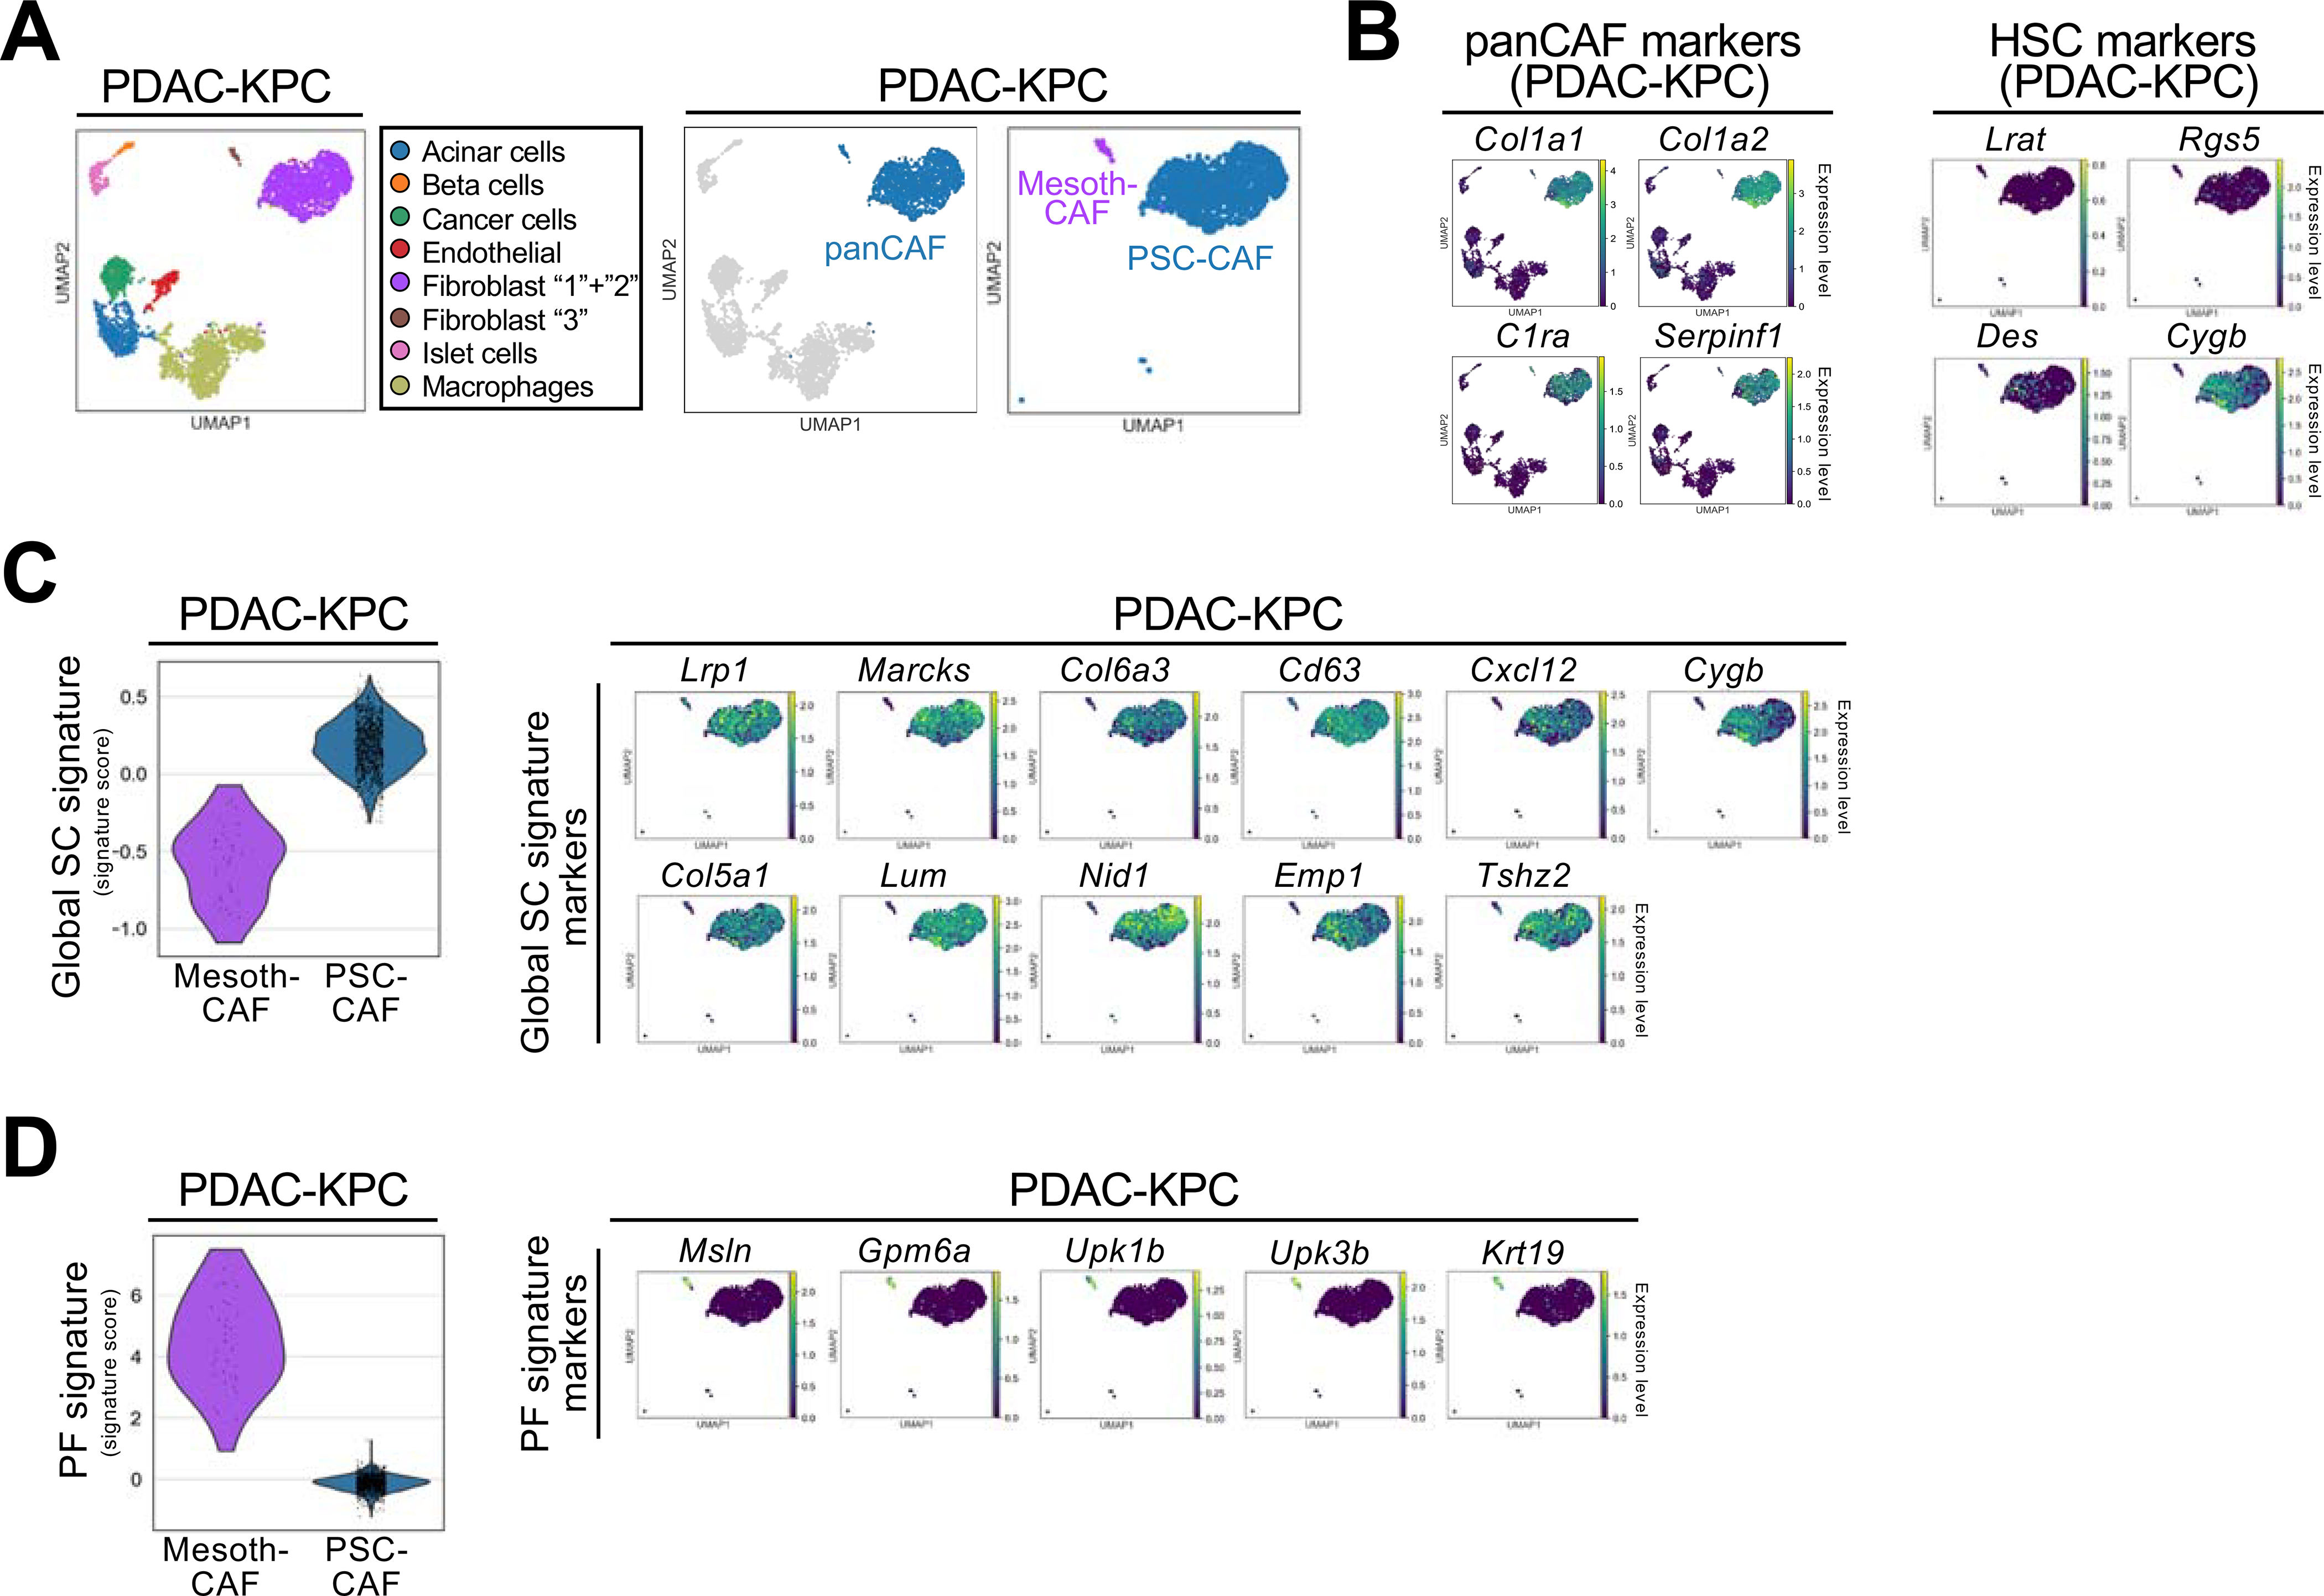
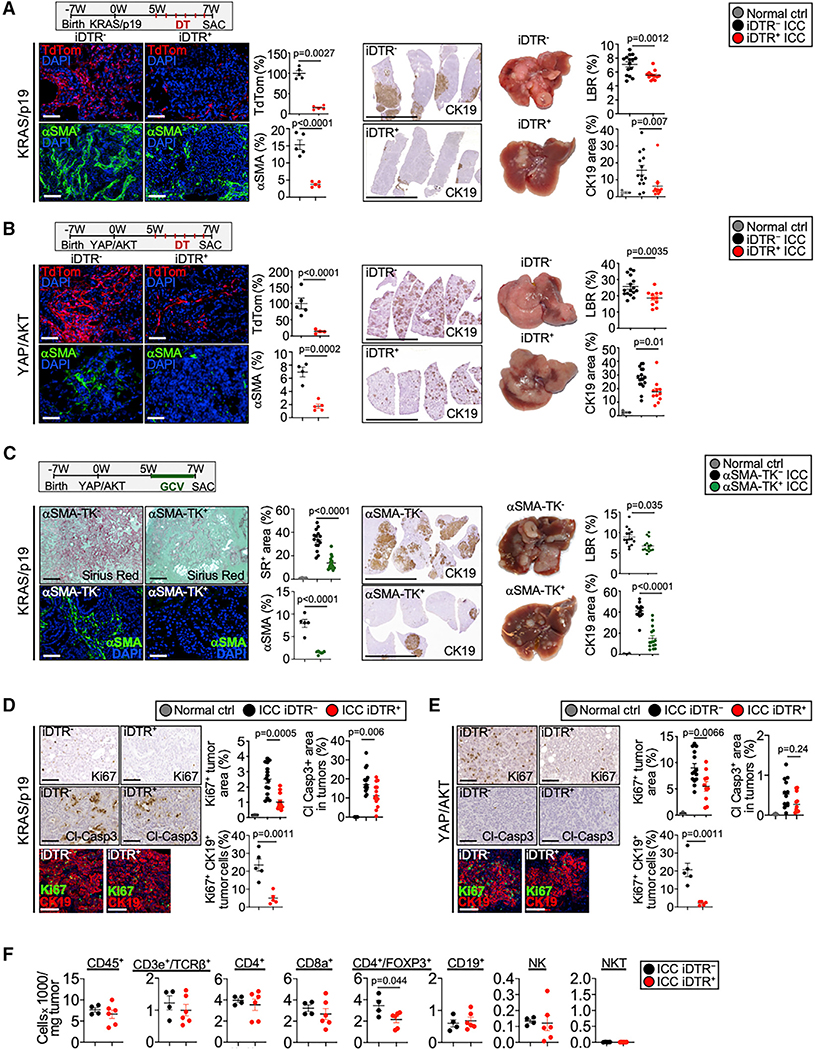
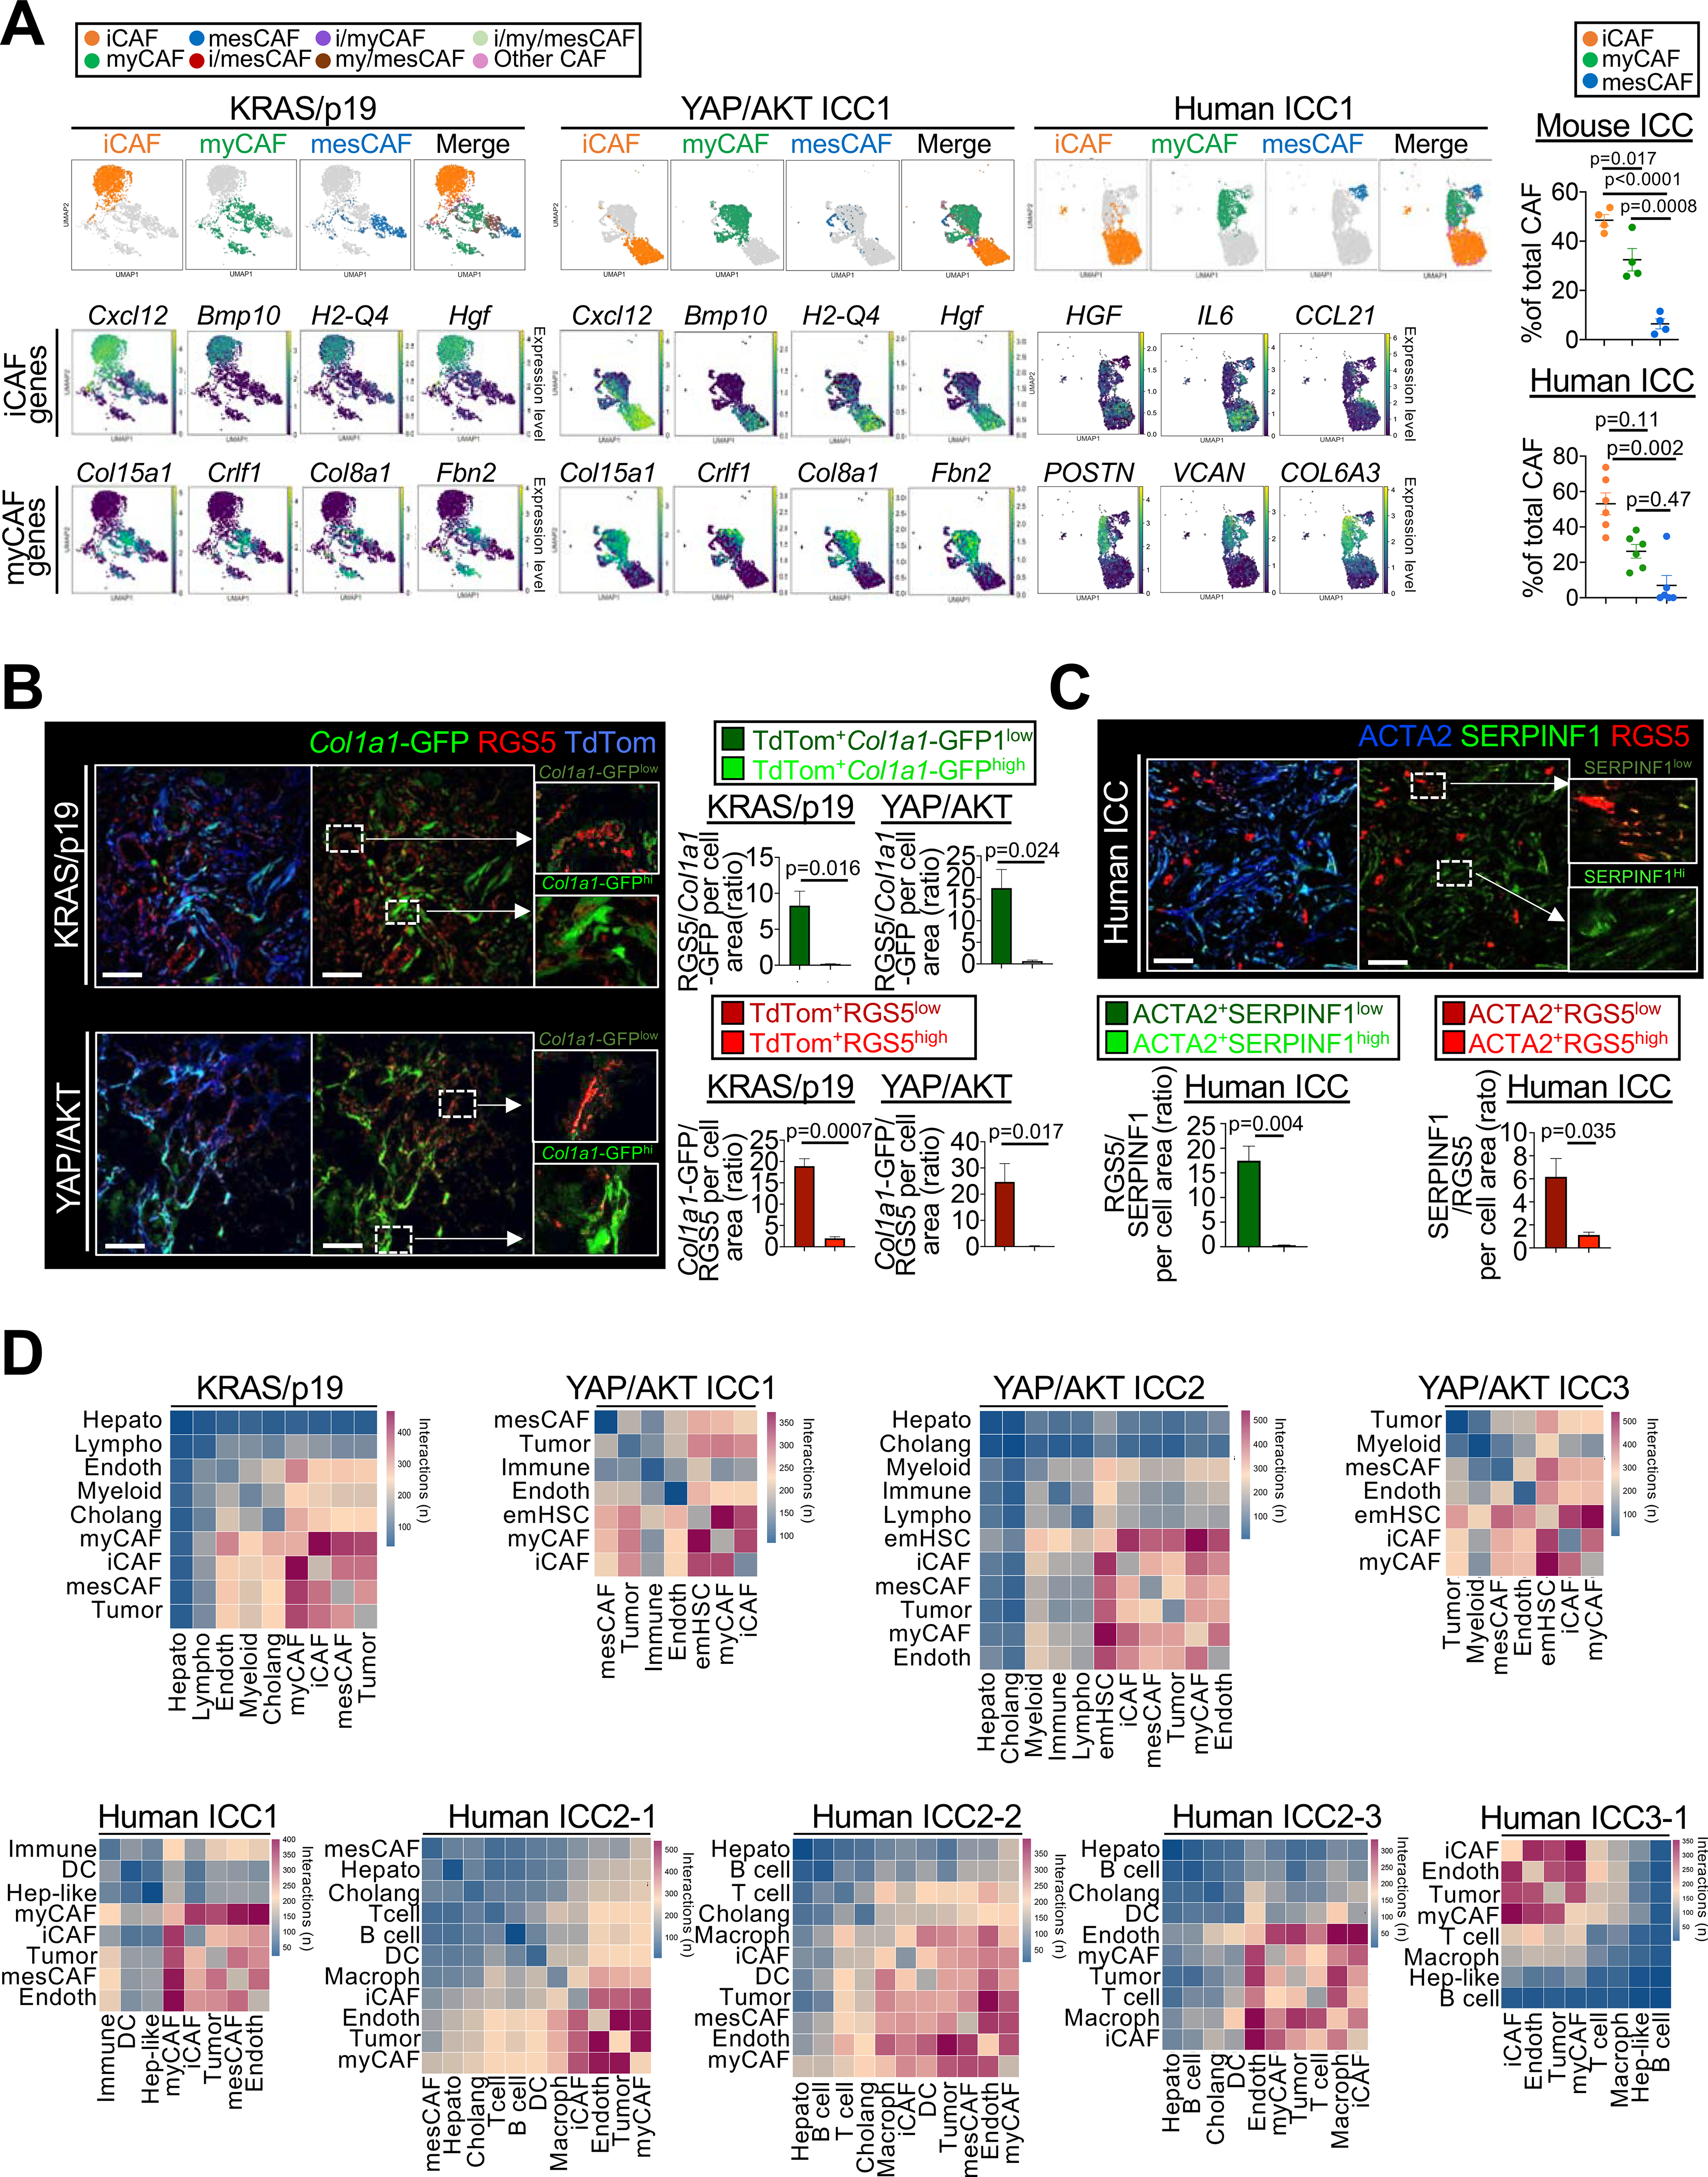
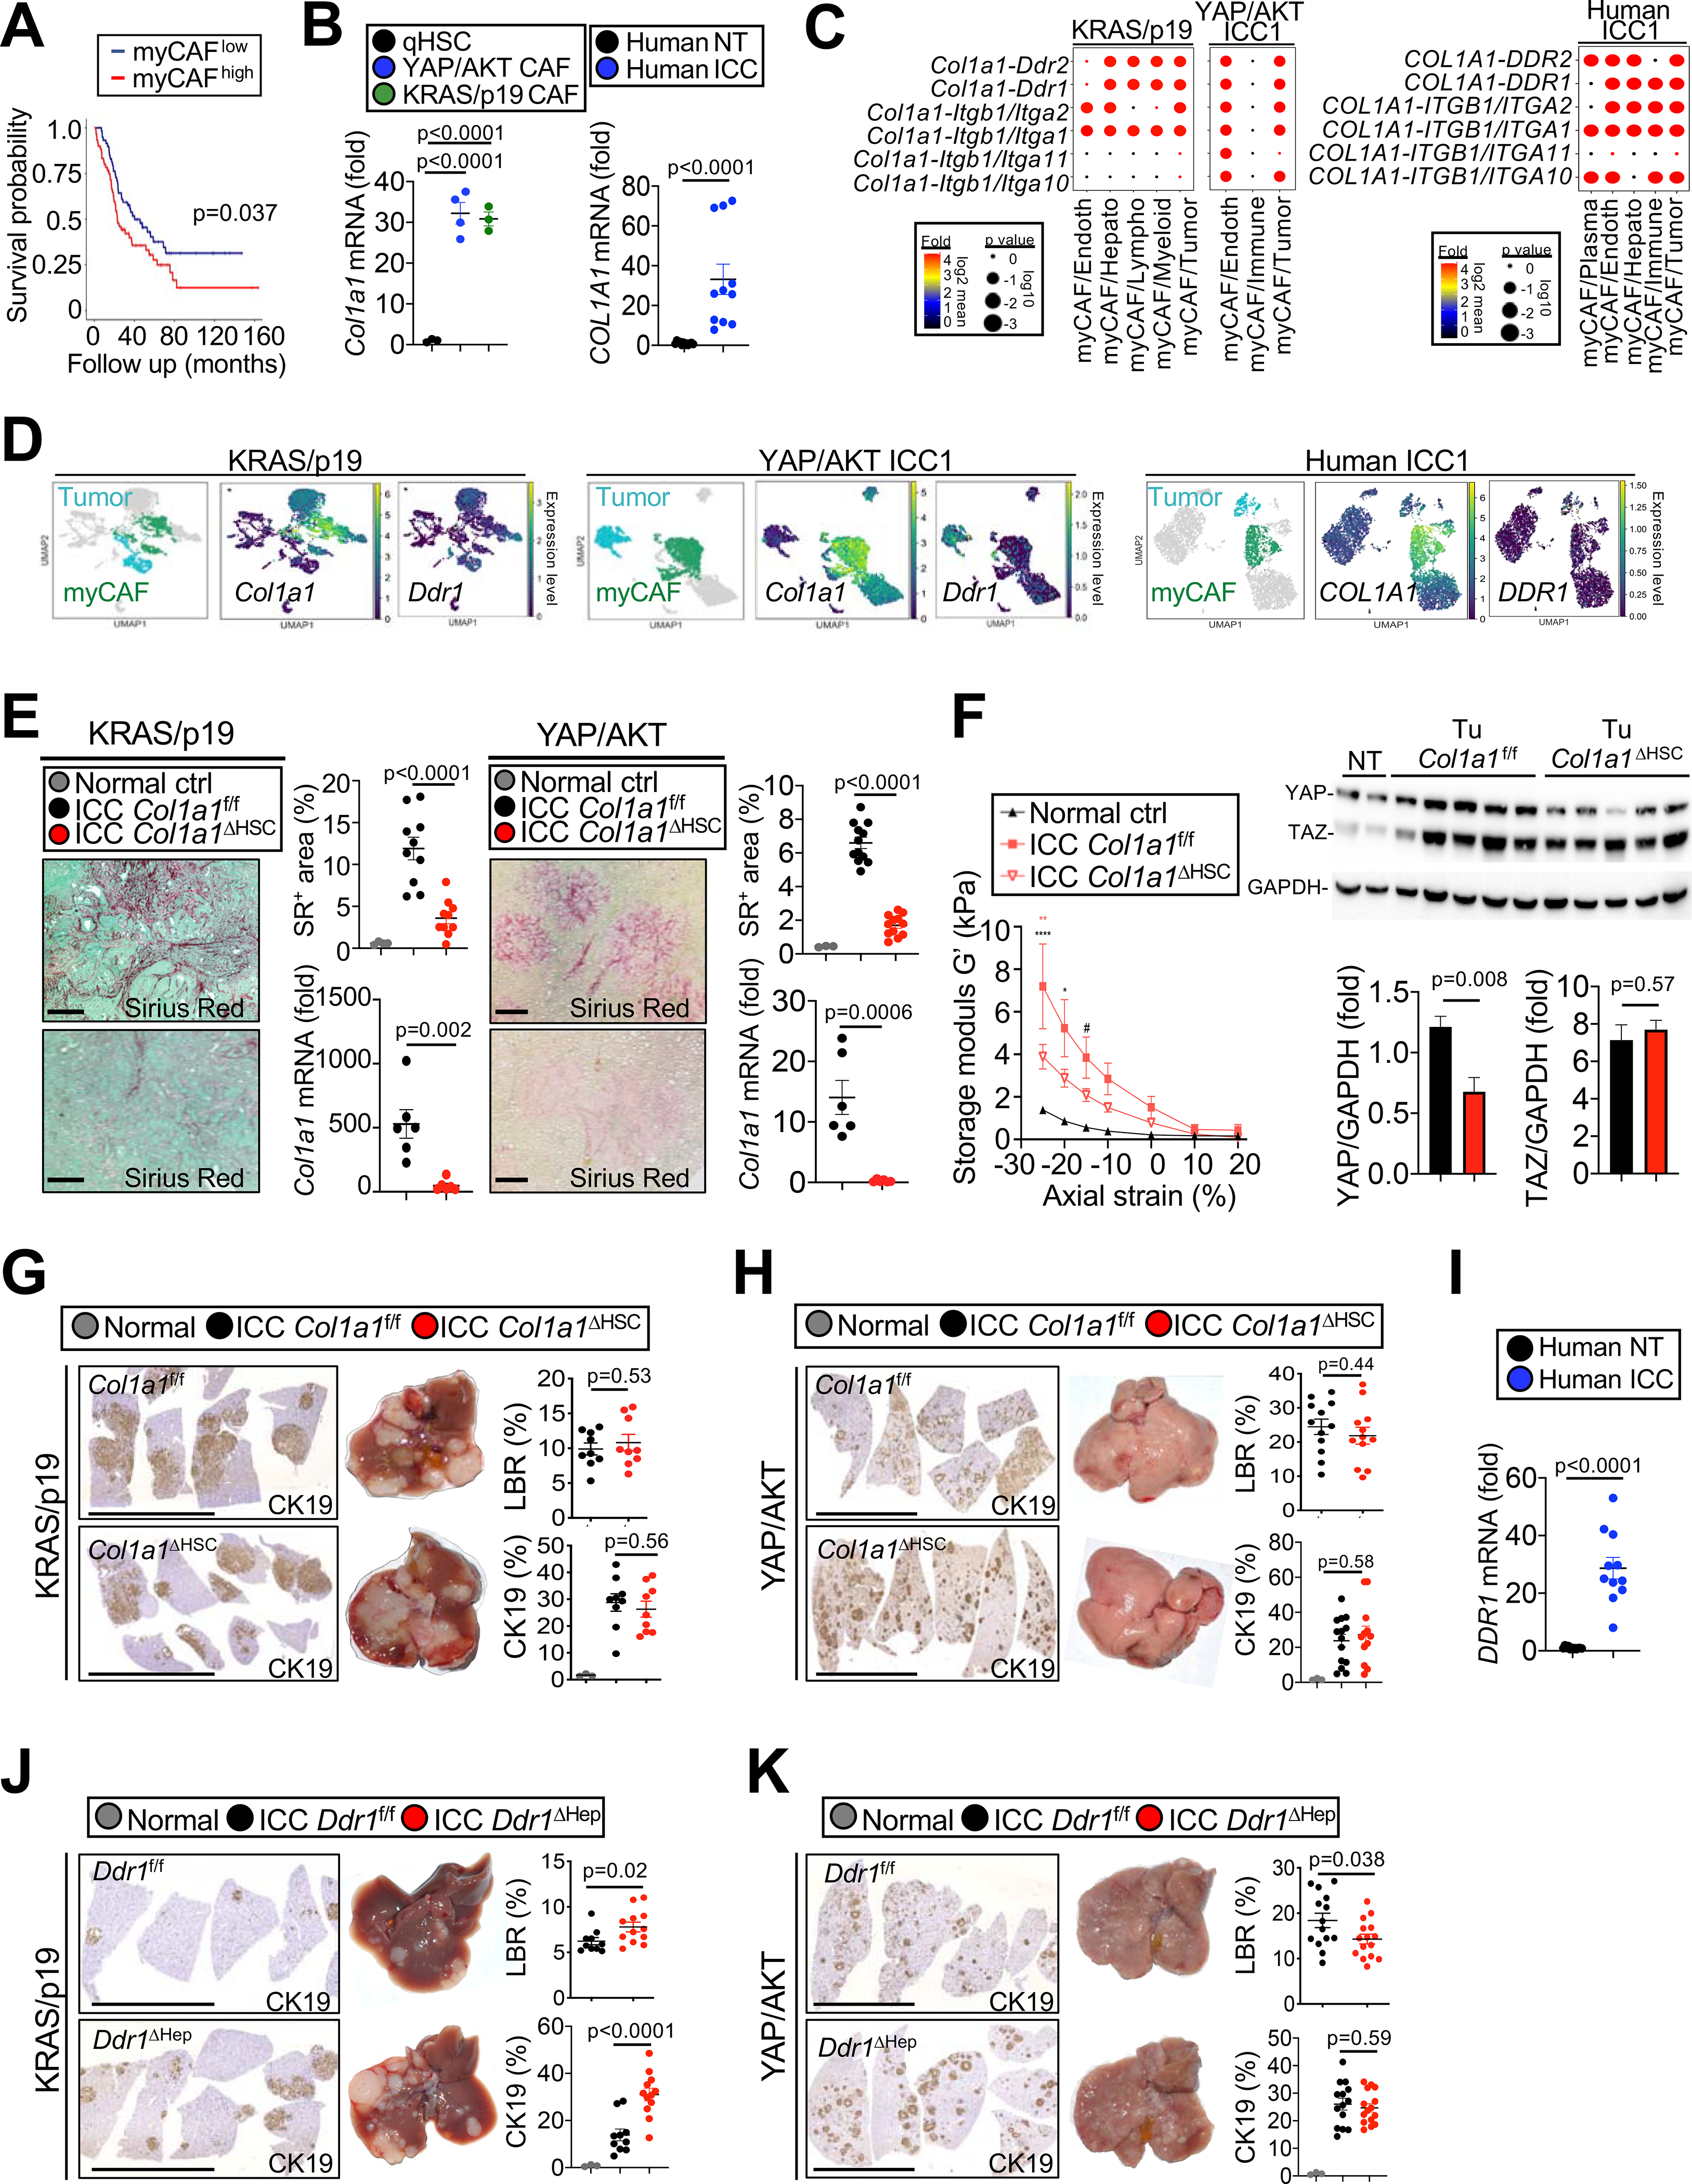
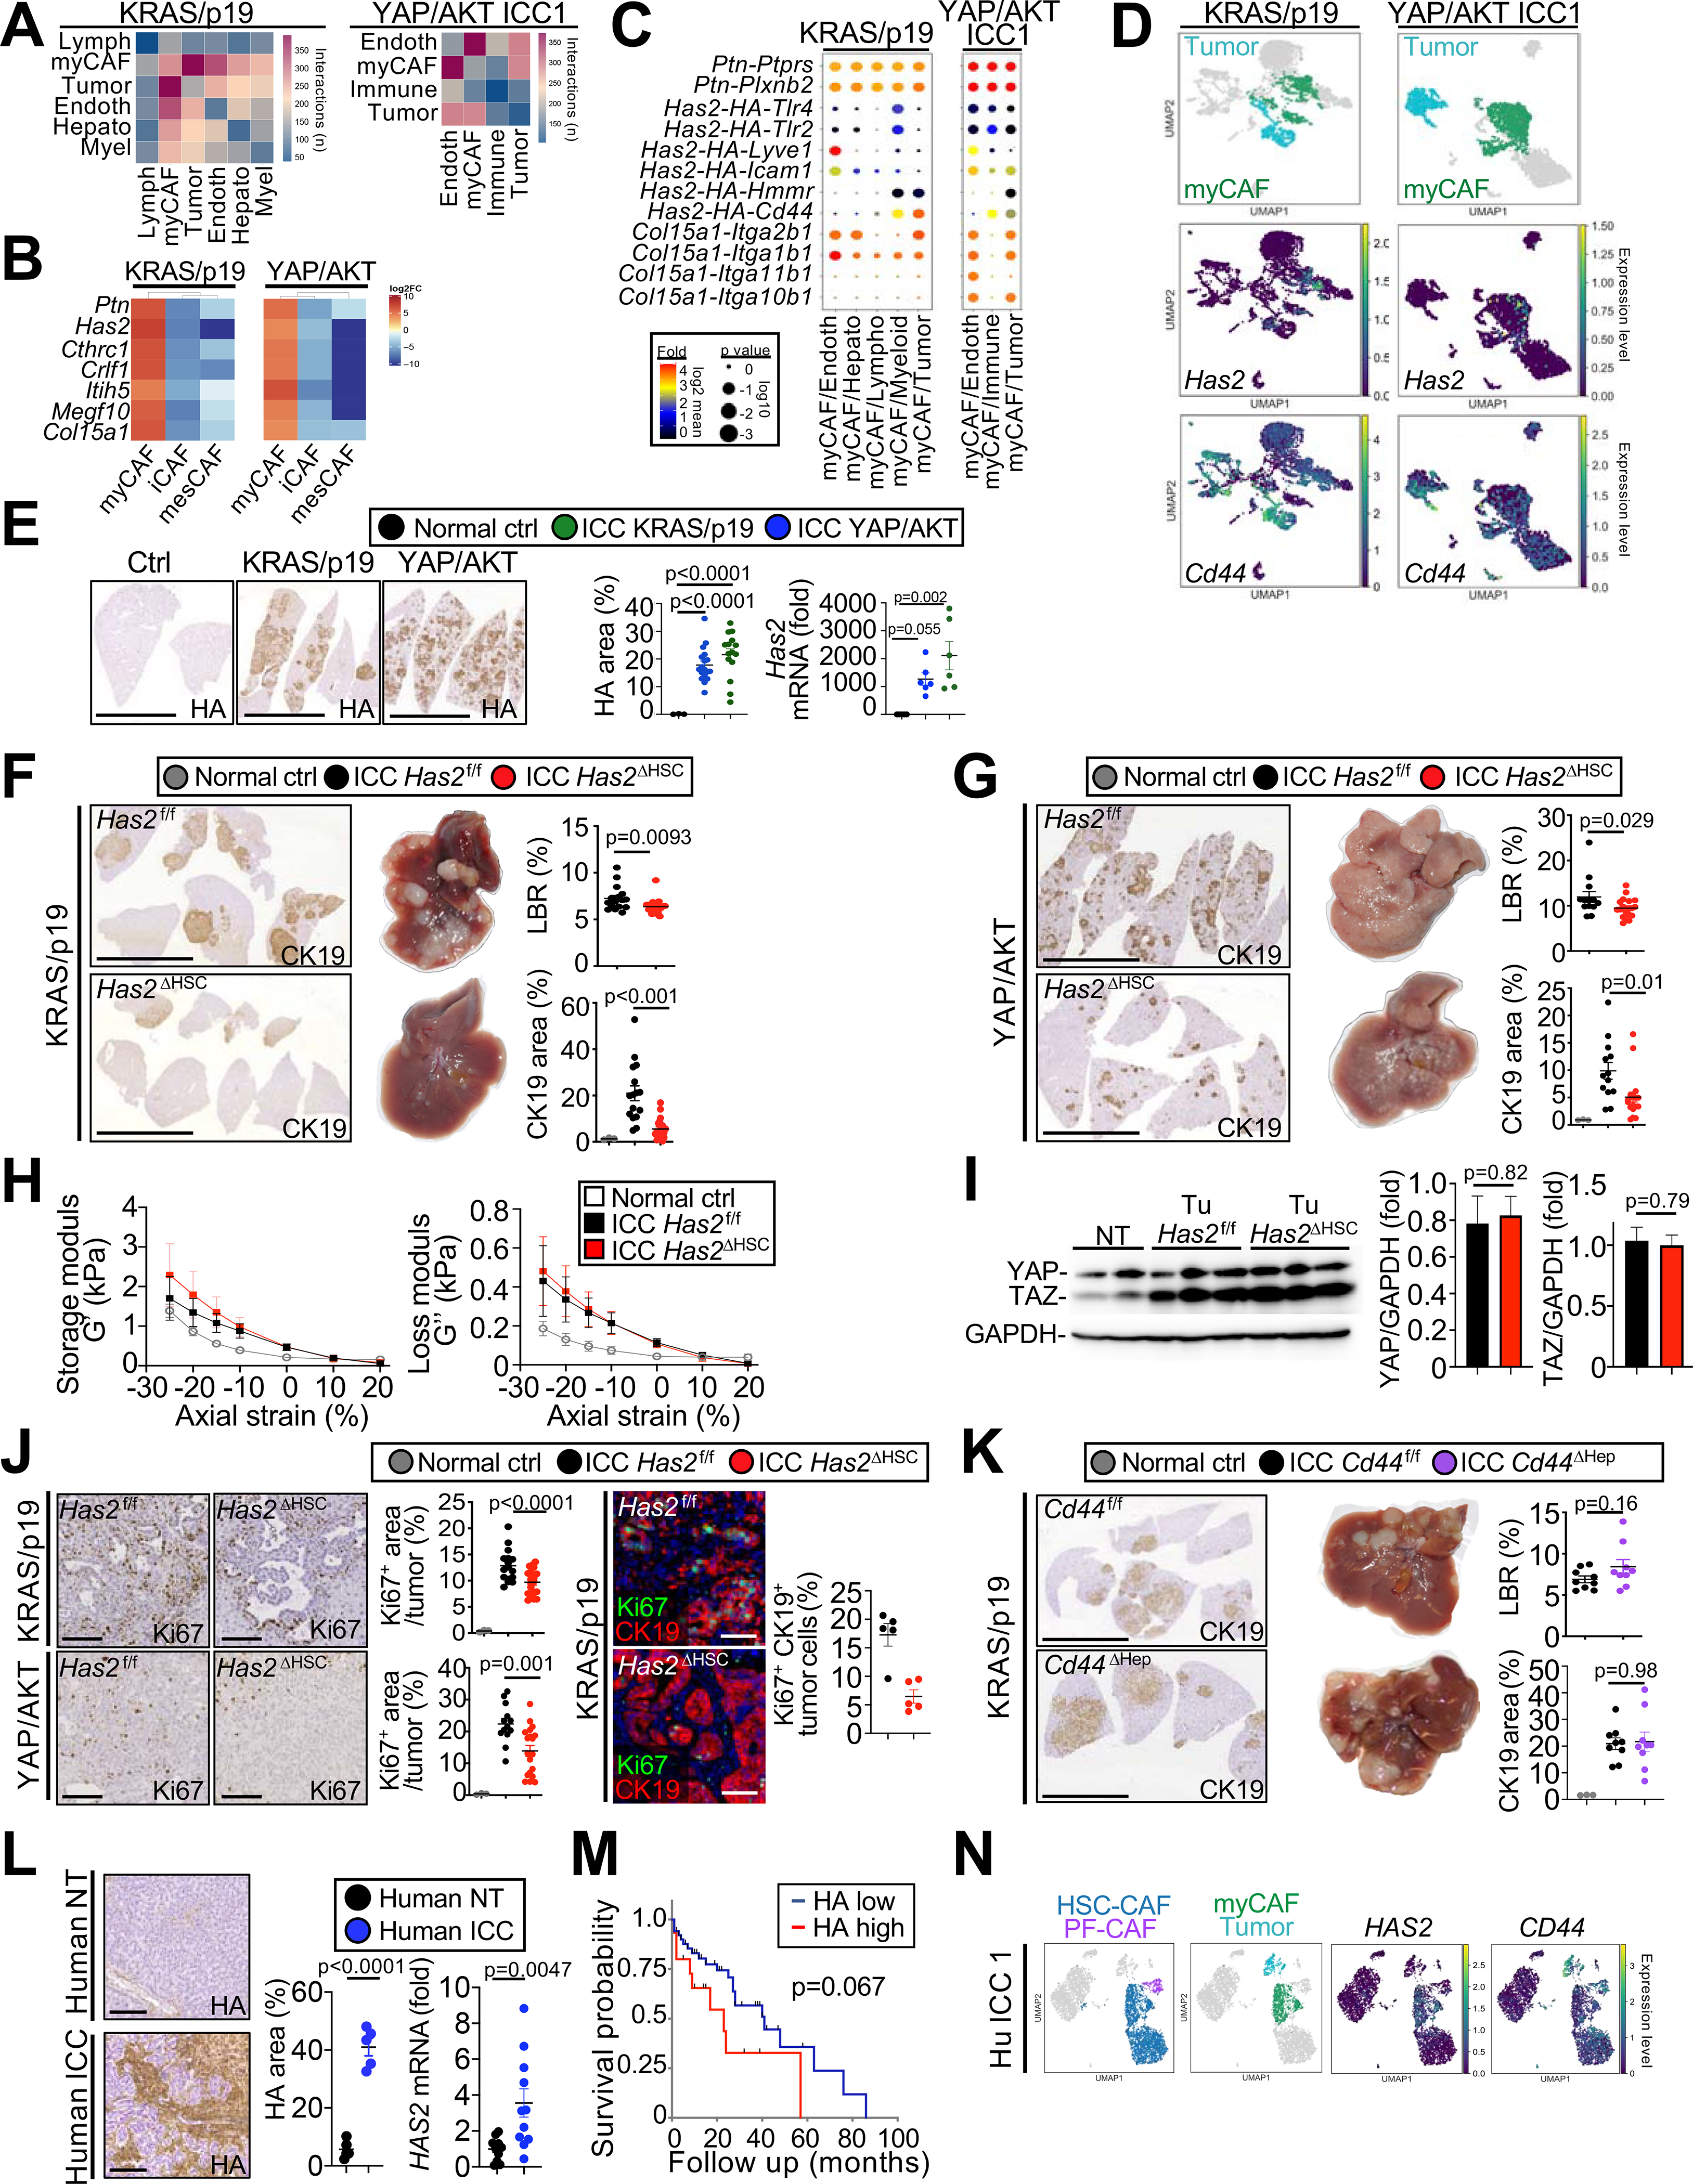
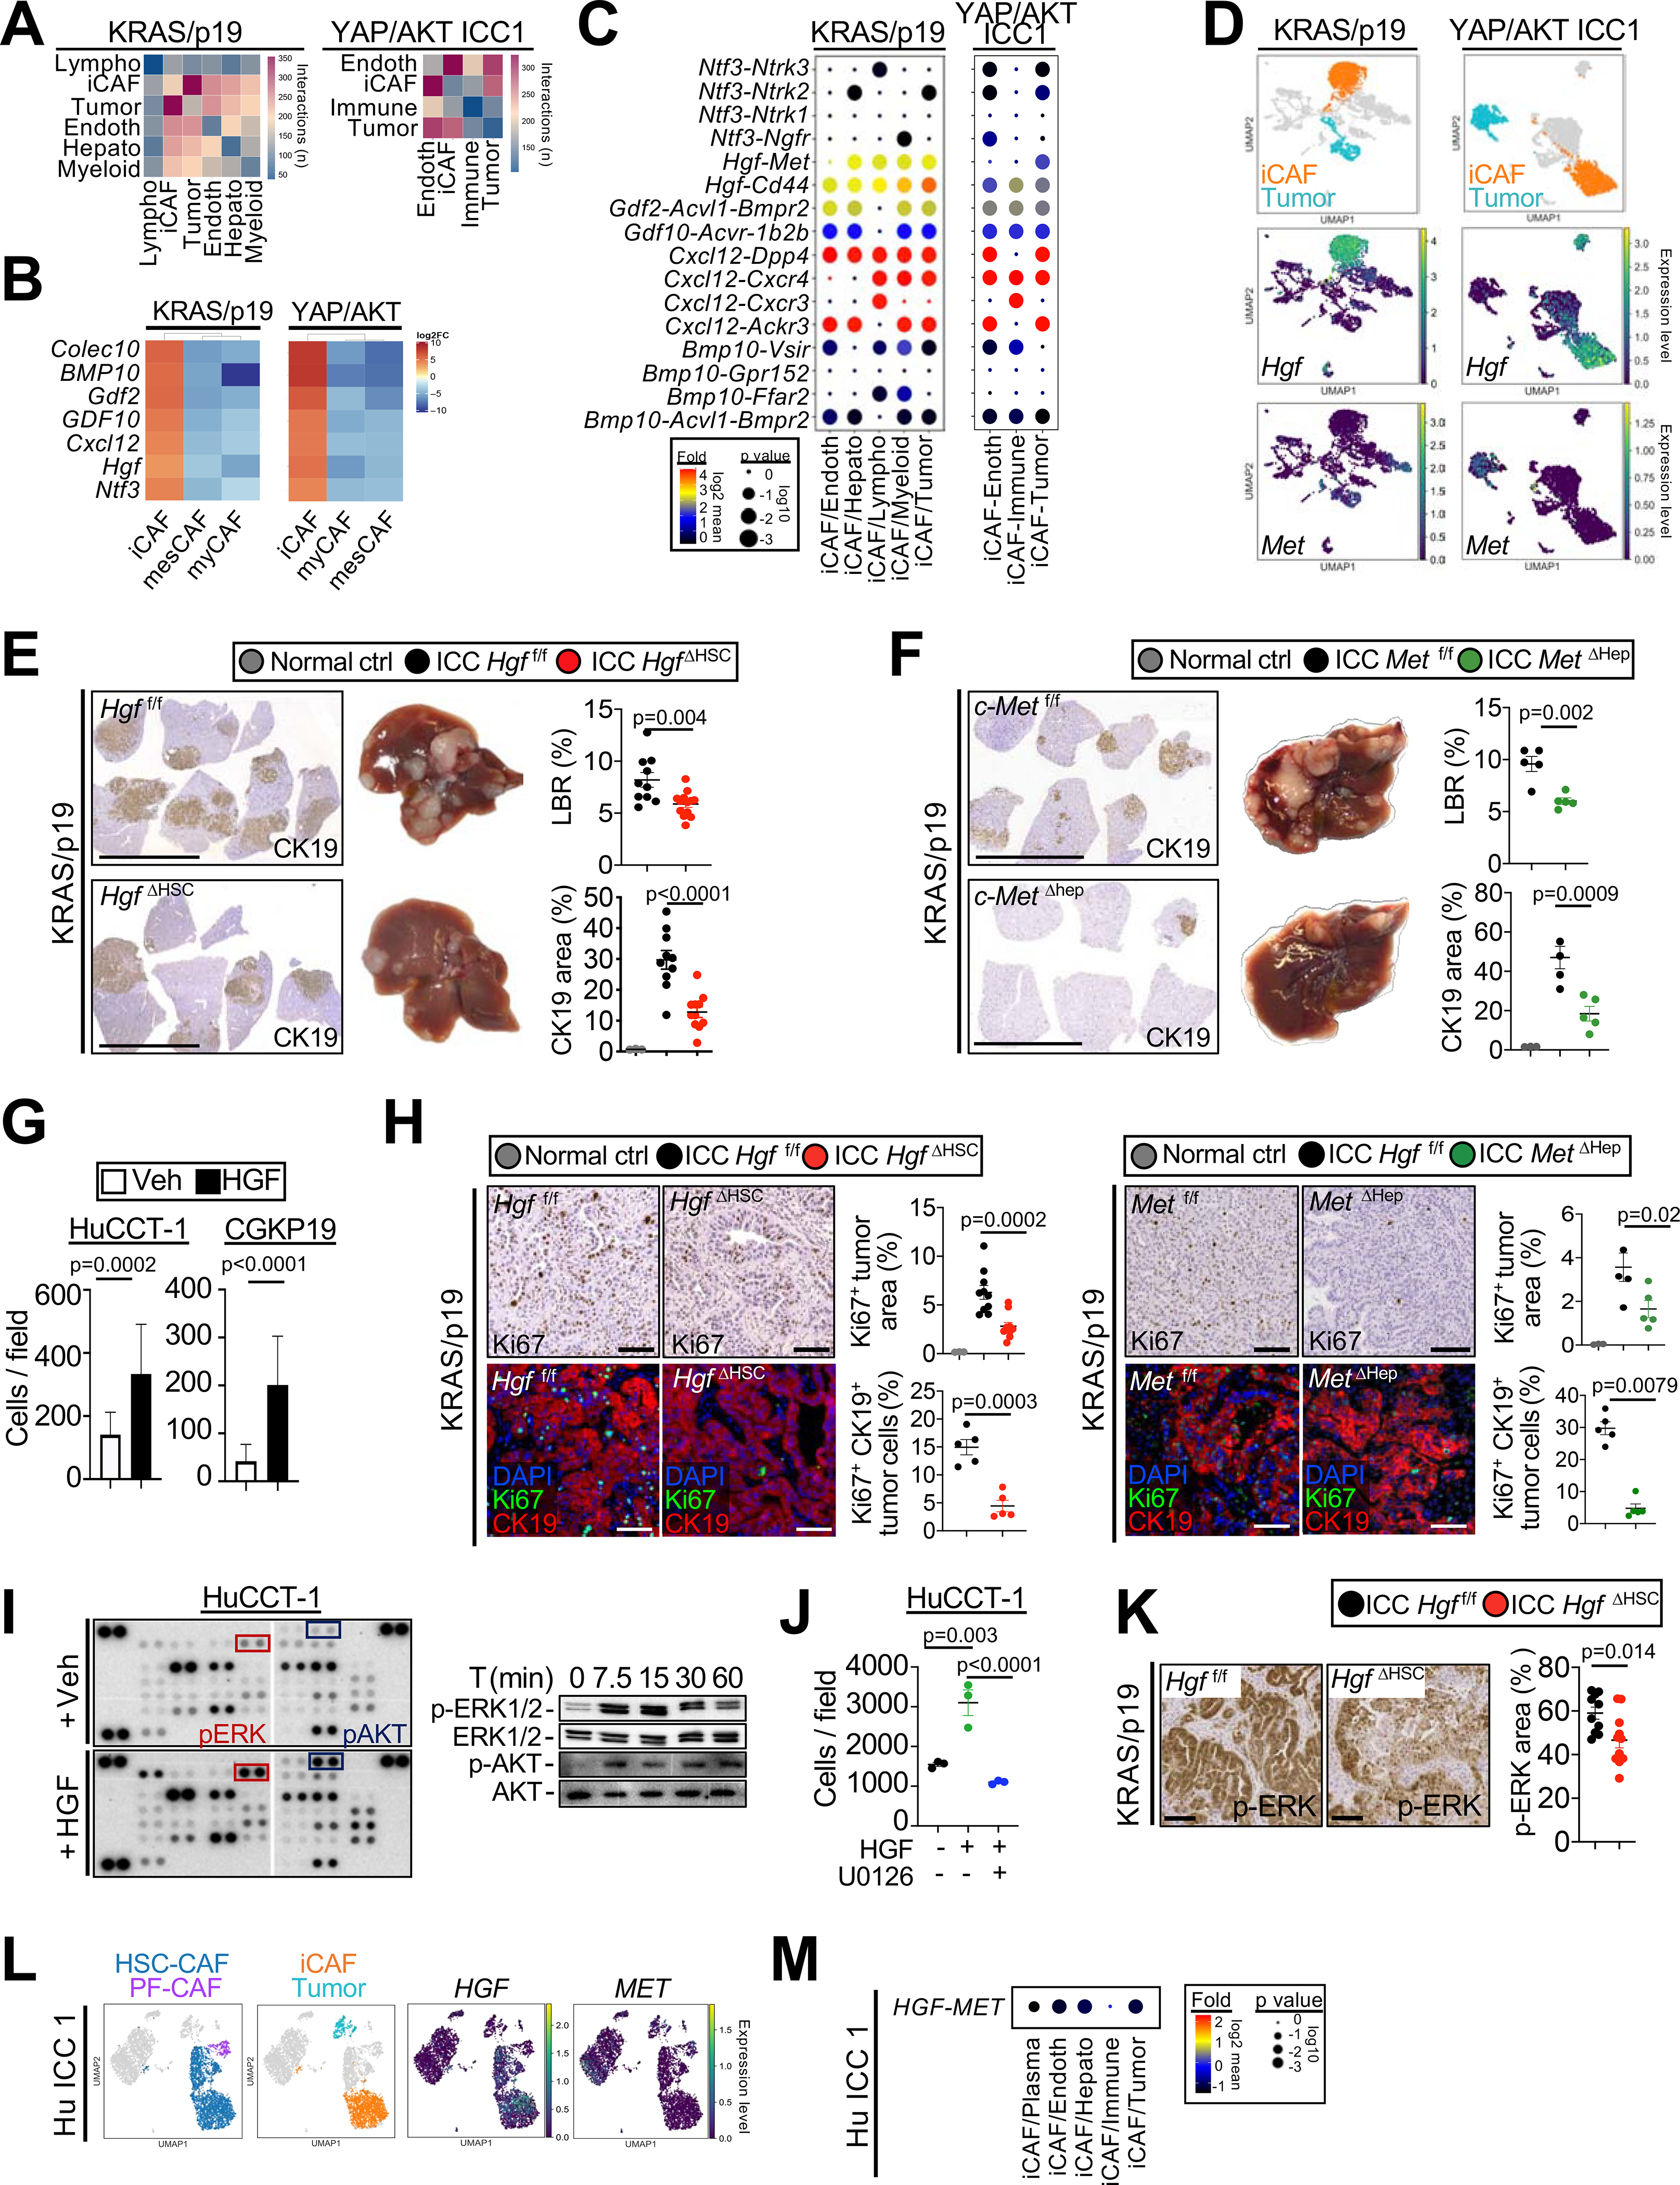
Cancer-associated fibroblasts (CAF) are a poorly characterized cell population in the context of liver cancer. Our study investigates CAF functions in intrahepatic cholangiocarcinoma (ICC), a highly desmoplastic liver tumor. Genetic tracing, single-cell RNA sequencing, and ligand-receptor analyses uncovered hepatic stellate cells (HSC) as the main source of CAF and HSC-derived CAF as the dominant population interacting with tumor cells. In mice, CAF promotes ICC progression, as revealed by HSC-selective CAF depletion. In patients, a high panCAF signature is associated with decreased survival and increased recurrence. Single-cell RNA sequencing segregates CAF into inflammatory and growth factor-enriched (iCAF) and myofibroblastic (myCAF) subpopulations, displaying distinct ligand-receptor interactions. myCAF-expressed hyaluronan synthase 2, but not type I collagen, promotes ICC. iCAF-expressed hepatocyte growth factor enhances ICC growth via tumor-expressed MET, thus directly linking CAF to tumor cells. In summary, our data demonstrate promotion of desmoplastic ICC growth by therapeutically targetable CAF subtype-specific mediators, but not by type I collagen.

Keywords: CellPhoneDB; HGF; KRAS; YAP; cholangiocarcinoma; immune; mechanosensitive; single cell; stiffness; tumor microenvironment.


Conflict of interest statement

Declaration of interests A.C. is founder, equity holder, and consultant of DarwinHealth. Columbia University is an equity holder in DarwinHealth.

Figures

Figure 1 |
Figure 1 |
The majority of CAF are HSC derived and closely interact with tumor cells in ICC. (A) Acta2 and Col1a1 mRNA expression in murine ICC. Data are shown as mean±SEM. Significance for each model was calculated by two-sided unpaired T-test or Mann-Whitney test vs its own control, *p<0.05; ** p<0.01; ***p<0.001. (B) Representative photographs, CK19 and CK7 IHC confocal microscopy and quantifications, showing colocalization of Lrat-Cre induced TdTom with CAF markers Col1a1-GFP and αSMA in four murine ICC models (n=3/model) in Lrat-Cre+ TdTom+Col1a1-GFP+ mice. Scale bars, 50 μm. Data shown as mean±SEM. (C) Representative UMAPs of scRNA-seq HSC and PF signature scores HSC markers Colec11, Lum, Des and Lrat, and PF marker Msln in KRAS/p19 (n=1) and YAP/AKT-induced ICC (n=3) and the percentage of CAF populations. (D) Heatmap of genes from bulk RNA-seq with > 2log fold change and p-value <0.01 in quiescent HSC (n=4), HSC from bile duct ligation (BDL) (n=4), HSC from 0.1% DDC diet (n=4), HSC-CAF from YAP/AKT (n=4) and KRAS/p19 (n=3) when compared to qHSC (n=4). (E,F) CellphoneDB analysis showing the number of ligand–receptor interactions between (E) all cell populations and (F) HSC-CAF and PF-CAF with tumor cells in KRAS/p19- and YAP/AKT-induced ICC. (G-H) Representative UMAPs and heatmaps of scRNA-seq showing (G) cell populations and the number of ligand–receptor interactions between all cells, (H) HSC and PF signature scores and percentage (n=6); and number of ligand–receptor interactions (n=5) in human ICC. Data shown as mean±SEM. Significance calculated by Mann-Whitney test. (I) Overall survival in 119 ICC patients with low (n=59) and high (n=60) panCAF signature. See also Figure S1, Table S1, S2, S3.
Figure 2 |
Figure 2 |
Comparison of CAF from ICC and PDAC. (A) UMAPs showing cell populations detected by scRNA-seq in KPC-induced mouse PDAC from Hosein et al. (B) UMAPs showing the normalized expression levels of panCAF and HSC markers in PDAC-KPC. (C,D) Violin plot showing the global SC signature (C) and PF signature (D) scores and UMAPs for each gene of these signatures. For C,D, the width of each violin plot indicates the kernel density of the expression values. See also Figure S2.
Figure 3.
Figure 3.. HSC-derived CAF promote ICC development and tumor cell proliferation
(A and B) HSC-derived CAF were depleted in mice with (A) KRAS/p19-induced and (B) YAP/AKT-induced ICC by injecting Lrat-Cre+TdTom+iDTR+ or Lrat-Cre+TdTom+iDTR littermates with diphtheria toxin. HSC depletion was quantified by the TdTom+ and αSMA+ area (n = 4–5 mice/group). Scale bars, 100 μm. Representative images of IHC and livers, liver/body weight ratio (LBR), and CK19+ quantifications from (A) KRAS/p19-induced ICC (n = 13–15 mice/group) and (B) YAP/AKT-induced ICC (n = 11–16 mice/group) show reduced ICC in HSC-CAF-depleted mice. Scale bars, 1 cm. (C) CAF were depleted by injecting ganciclovir in αSMA-TK mice with KRAS/p19-induced ICC. CAF depletion was quantified by αSMA IHC (n = 5–7 mice/group) and Sirius red (n = 15 mice/group). Scale bars, 100 μm. Representative images of CK19 IHC, livers, LBR, and quantifications from KRAS/p19 ICC in αSMA-TK mice (n = 15 mice/group). Scale bars, 1 cm. (D and E) Representative pictures and quantifications of Ki67 and cl-caspase3 IHC and confocal imaging and quantifications of Ki67+CK19+ cells in (D) KRAS/p19 and (E) YAP/AKT ICC in CAF-depleted iDTR+ and control iDTR mice. Scale bars, 100 μm. (F) Flow cytometry of indicated immune cells in tumors from KRAS/p19 ICC in iDTR (n = 4) and iDTR+ (n = 6) mice. Data shown as mean ± SEM. Significance determined by two-sided unpaired t test (groups of two) (A, B, D, F), by one-way ANOVA and Sidak’s post hoc test (C, E: Ki67 panel), or by Kruskal-Wallis test with Dunn’s post hoc test (A, B, D, E: Cl-Casp3 panel) (groups of three). See also Figure S3.
Figure 4 |
Figure 4 |
CAF subpopulations and their ligand-receptor interactome in ICC. (A) Representative UMAPs of indicated genes, CAF subpopulations and their percentages in KRAS/p19 (n=1), YAP/AKT-induced (n=3) and human ICC (n=6). Data shown as mean±SEM, significance determined by one-way ANOVA followed by Sidak’s posthoc test (mouse) or Kruskal-Wallis test with Dunn’s posthoc test (human). (B) Representative confocal microscopy and quantifications show high RGS5 in Col1a1-GFPlow iCAF and low RGS5 in Col1a1-GFPhigh myCAF in Lrat-Cre+ TdTom+Col1a1-GFP+ mice (n=3 tumors/model). Scale bars, 50 μm. Data shown as mean±SEM, significance determined by two-sided unpaired T-test. (C) Representative confocal microscopy and quantifications show high expression of iCAF marker RGS5 in cells with low expression of myCAF marker SERPINF1 and vice versa (n=3 tumors). Scale bars, 50 μm. Data shown as mean±SEM, and significance determined by two-sided unpaired T-test. (D) Representative heatmaps of CellphoneDB analysis showing the number of ligand–receptor interactions between iCAF, myCAF and mesCAF and all other cells in KRAS/p19 (n=1) and YAP/AKT ICC (n=3), and in human ICC (n=5). See also Figure S4, Table S4, S5.
Figure 5 |
Figure 5 |
Col1a1 affects tumor stiffness but not tumor growth in ICC. (A) Overall survival in 119 ICC patients with low (n=59) and high (n=60) myCAF signature. (B) Col1a1 mRNA in quiescent HSC (n=4) and HSC-derived CAF from KRAS/p19- (n=3) and YAP/AKT-(n=4) induced ICC and COL1A1 mRNA expression in non-tumor (NT) and tumor (T) tissues (n=11) from ICC patients. (C) Ligand-receptor interactions between COL1A1-expressing myCAF and other cells in mouse and human ICC. (D) Representative UMAPs of indicated genes in KRAS/p19- and YAP/AKT- ICC, and human ICC. (E) Representative images and quantification of sirius red staining and Col1a1 qPCR in Col1a1f/f and Col1a1ΔHSC KRAS/p19 ICC (n=9 each) and YAP/AKT ICC (n=12 each). Scale bars 100 μm. (F) Storage modulus G’ (a measure of elasticity) in Col1a1f/f (n=3) and Col1a1ΔHSC (n=4) mice in a KRAS/p19 ICC and in control liver (n=2) by shear rheometry. Curves are mean±SEM. Using 2-way ANOVA: *p≤0.05, **p≤0.01, ****p≤0.0001, #0.05<p≤0.10 vs ctrl (black) or vs Col1a1ΔHSC (red). YAP and TAZ Western blot and quantifications normalized to GAPDH in Col1a1f/f and Col1a1ΔHSC (NT n=1 each, T n=5 each). (G,H) Representative images of CK19 IHC, livers, LBR and quantifications from (G) KRAS/p19 ICC (n=9 mice/group) and (H) YAP/AKT ICC (n=12–13 mice/group) in Col1a1f/f and Col1a1ΔHSC. Scale bars 1 cm. (I) DDR1 mRNA expression in NT and T (n=11 each) from ICC patients. (J,K) Representative images and quantifications of CK19 IHC, livers, LBR from (J) KRAS/p19 ICC (n=10–12 mice/group) and (K) YAP/AKT-induced ICC (n=12–14 mice/group) in Ddr1f/f and Ddr1ΔHep mice. Scale bars 1 cm. Data shown as mean±SEM, significance determined by two-sided unpaired T-test (E,F,G,H,I,K) or Mann-Whitney (B human,F,J) (groups of two); and by one-way ANOVA followed by Sidak’s posthoc test (B mouse,F) (groups of three). See also Figure S5.
Figure 6 |
Figure 6 |. myCAF-derived HAS2 mediates tumor promotion.
(A) Representative CellphoneDB showing the number of interactions between myCAF and other cells in murine ICC. (B) Heatmap of genes differentially expressed in myCAF vs iCAF and mesCAF in KRAS/p19 and YAP/AKT ICC. (C) Representative CellphoneDB ligand–receptor pairs linking myCAF to other cells. (D) Representative UMAPs of indicated genes in KRAS/p19 and YAP/AKT ICC. (E) Representative micrographs and quantifications of HA IHC and Has2 mRNA in livers of KRAS/p19 ICC (n=9–15), YAP/AKT ICC (n=16) and control mice (n=3–4). Scale bars 1 cm. (F,G) Representative images of CK19 IHC, livers, LBR and CK19+ area from KRAS/p19 ICC (n=16–20 mice/group) and YAP/AKT ICC (n=13–19 mice/group) in Has2f/f and Has2ΔHSC mice. Scale bars 1 cm. (H) Storage modulus G’ (a measure of elasticity) and loss modulus G” (a measure of viscosity) in tumors from Has2f/f and Has2ΔHSC mice (n=4 each) in KRAS/p19 ICC and control liver (n=2) by shear rheometry. Curves are mean±SEM. Using 2-way ANOVA: *p≤0.05, **p≤0.01, ****p≤0.0001, #0.05<p≤0.10 vs ctrl (black) or vs Has2ΔHSC (red). (I) YAP and TAZ western blot and quantifications normalized to GAPDH in Has2f/f and Has2ΔHSC mice (NT n=1, T n=3 each). (J) Representative Ki67 IHC from KRAS/p19 (n=16–20 mice/group) and YAP/AKT ICC (n=13–19 mice/group) and Ki67-CK19 costaining, confocal microscopy and quantification (n=5/group) in Has2f/f and Has2ΔHSC mice. Scale bars 100 μm. (K) Representative images of CK19 IHC, livers, LBR and CK19+ area from Cd44f/f (n=9) and Cd44Δhep (n=9) in KRAS/p19-induced ICC. Scale bars 1 cm. (L) Representative pictures and quantifications of HA IHC and HAS2 mRNA in human ICC (n=5) and matching non-tumor (n=5). Scale bars 100 μm. (M) Survival of CCA patients with low (n=50) or high (n=16) HA expression. (N) Representative UMAPs of HAS2 and CD44 in human ICC. Data shown as mean ±SEM (E-L). Significance determined by two-sided unpaired T-test (J,K) or Mann-Whitney (F,G) (groups of two); and by one-way ANOVA followed by Sidak’s posthoc test (E,G,J) or Kruskal-Wallis with Dunn’s posthoc (F,G) (groups of three). See also Figure S6, Table S6.
Figure 7 |
Figure 7 |. iCAF-derived HGF promotes ICC development and proliferation.
(A) Number of ligand–receptor interactions between iCAF and other cells in ICC. (B) Heatmap of genes differentially expressed in iCAF vs myCAF and mesCAF in KRAS/p19 and YAP/AKT ICC. (C) Ligand–receptor pairs linking iCAF to other cells shown as log2 mean. (D) Representative UMAPs of Hgf and Met in KRAS/p19 and YAP/AKT ICC. (E,F) Representative images of CK19 IHC, livers, LBR and CK19+ area from (E) Hgff/f and HgfΔHSC liver (n=10–11) and (F) c-Metf/f and c-MetΔHep liver (n=5 each) in KRAS/p19 ICC. Scale bars 1 cm. (G) Cell counts of ICC cells lines after HGF or vehicle treatment (n=5 each) for 48h. (H) Representative Ki67 IHC in Hgff/f and HgfΔHSC (n=10–11) and c-Metf/f and c-MetΔHep livers (n=5 each) mice and Ki67-CK19 costaining, confocal and quantification (n=5/group) in KRAS/p19-induced ICC. Scale bars 100 μm. (I) Phospho-kinase array and western blot for phospho and total ERK1/2 and AKT in HGF-treated HuCCT-1 cells. (J) Number of HuCCT-1 cells treated with HGF or vehicle for 48h, in the presence of MEK1/2 inhibitor U0126 or vehicle. (K) Phospho-ERK1/2 IHC and quantifications in KRAS/p19 ICC from Hgff/f and HgfΔHSC mice (n=10–11). (L) Representative UMAPs of HGF and MET in human ICC. (M) HGF-MET interactions linking iCAF to other populations in CellPhoneDB in one representative human ICC sample. For panels E-H,J,K data are shown as mean ±SEM. Significance determined by two-sided unpaired T-test (E-G:CGKP19 panel,K) or Mann-Whitney (G:HUCCT1 panel) (groups of two) or ANOVA test followed by Sidak’s posthoc test (E,F,H,J) (groups of three). See also Figure S7.

References

    1. Affo S, Yu LX, and Schwabe RF (2017). The Role of Cancer-Associated Fibroblasts and Fibrosis in Liver Cancer. Annu Rev Pathol 12, 153–186. - PMC - PubMed
    1. Algul H, Treiber M, Lesina M, Nakhai H, Saur D, Geisler F, Pfeifer A, Paxian S, and Schmid RM (2007). Pancreas-specific RelA/p65 truncation increases susceptibility of acini to inflammation-associated cell death following cerulein pancreatitis. J Clin Invest 117, 1490–1501. - PMC - PubMed
    1. Aparicio L BM, Blumberg AJ, Rabadan R. (2020). A Random Matrix Theory Approach to Denoise Single-Cell Data. Patterns May 4:100035. - PMC - PubMed
    1. Banales JM, Marin JJG, Lamarca A, Rodrigues PM, Khan SA, Roberts LR, Cardinale V, Carpino G, Andersen JB, Braconi C, et al. (2020). Cholangiocarcinoma 2020: the next horizon in mechanisms and management. Nat Rev Gastroenterol Hepatol. - PMC - PubMed
    1. Bankhead P, Loughrey MB, Fernandez JA, Dombrowski Y, McArt DG, Dunne PD, McQuaid S, Gray RT, Murray LJ, Coleman HG, et al. (2017). QuPath: Open source software for digital pathology image analysis. Sci Rep 7, 16878. - PMC - PubMed

Publication types

MeSH terms