. 2021 Apr 30;7(18):eaaz5803.
doi: 10.1126/sciadv.aaz5803. Print 2021 Apr.

More than 1000 rivers account for 80% of global riverine plastic emissions into the ocean

Affiliations

More than 1000 rivers account for 80% of global riverine plastic emissions into the ocean

Lourens J J Meijer et al. Sci Adv. .

Abstract

Plastic waste increasingly accumulates in the marine environment, but data on the distribution and quantification of riverine sources required for development of effective mitigation are limited. Our model approach includes geographically distributed data on plastic waste, land use, wind, precipitation, and rivers and calculates the probability for plastic waste to reach a river and subsequently the ocean. This probabilistic approach highlights regions that are likely to emit plastic into the ocean. We calibrated our model using recent field observations and show that emissions are distributed over more rivers than previously thought by up to two orders of magnitude. We estimate that more than 1000 rivers account for 80% of global annual emissions, which range between 0.8 million and 2.7 million metric tons per year, with small urban rivers among the most polluting. These high-resolution data allow for the focused development of mitigation strategies and technologies to reduce riverine plastic emissions.


Figures

Fig. 1
Fig. 1. Model framework.
Plastic emission in a river mouth ME is computed by accumulating of MPW multiplied with the probability of waste leaking into the ocean, P(E) within a river basin. P(E) is constructed with P(M), P(R), and P(O), which contain physical processes accountable for MPW transport.
Fig. 2
Fig. 2. Observations compared with modeled data for floating macrolitter emissions per river.
Regression analysis carried out with 136 records from 67 different rivers of different sizes spread across the globe. The dataset was split into a calibration (n = 52) and a validation (n = 84) dataset. The coefficient of determination of the logarithmic regression, r2, is 0.71 for the calibration and 0.74 for the validation dataset. Symbols indicate midpoints of extrapolated measurements (MT month−1) on the x axis versus our best calibrated model prediction on the y axis. The horizontal whiskers indicate the upper and lower values reported for observational data (if published), and the vertical whiskers indicate the upper and lower value of the 68% confidence interval of model predictions. The dark blue symbols correspond to data points used for calibration, and light blue symbols represent the validation data points, while the symbol (triangle, circle, and square) indicates the continent from where the location originates. The logarithm of both the measurements and the model results is presented here. The dotted gray lines represent one-order-of-magnitude deviation from the x = y line in the middle. The Kuantan and Besos rivers (indicated in red) are outliers with more than one order of magnitude difference compared with observational results.
Fig. 3
Fig. 3. Global distribution of riverine plastic emission into the ocean.
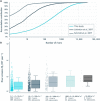
(A) Contribution of plastic emission to the ocean (ME) (y axis) is plotted against the logarithm of the number of rivers accountable for that contribution (x axis), for previous studies and this study. (B) Distribution of 1656 rivers accountable for 80% of emissions over five discharge classes (x axis). Each river is represented by a dot. Within a discharge class, the position of a river (dot) is determined by the plastic emission (y axis). The boxes contain 50% (Q1 until Q3) of the data, and the solid horizontal line in the box is the median, while the dotted horizontal line represents the average emission per river within the discharge class.
Fig. 4
Fig. 4. Global emissions of plastic into the ocean.
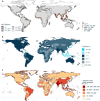
(A) The geospatial distribution of plastic entering the ocean through rivers. The 1656 rivers accountable for 80% of the total influx are presented. The gray shading indicates the probability for plastic entering the ocean [P(E)] on a 10 × 10–km resolution. (B) Total emitted plastic into the ocean ME per country divided by the national generation of MPW, globally ranging between 0 and 20%. (C) Total emitted plastic into the ocean ME (MT year−1) per country.
Fig. 5
Fig. 5. Probability maps.
(A) The Meycuayan and Tullahan river basins and river network in Manila, Philippines. (B) The distance (km) from a 3 × 3–arc sec grid cell toward the nearest river. (C) The distance (km) from each grid cell to the ocean, through the river network. (D) The probability for a grid cell to emit plastic waste into the ocean P(E), Eq. 1, for a given year, ranging from 0 to 5% for areas further away from a river up to 0.8% for areas near a river and near the coast.

References

    1. Rochman C. M., Browne M. A., Halpern B. S., Hentschel B. T., Hoh E., Karapanagioti H. K., Rios-Mendoza L. M., Takada H., Teh S., Thompson R. C., Policy: Classify plastic waste as hazardous. Nature 494, 169–171 (2013). - PubMed
    1. Lavers J. L., Bond A. L., Exceptional and rapid accumulation of anthropogenic debris on one of the world’s most remote and pristine islands. Proc. Natl. Acad. Sci. U.S.A. 114, 6052–6055 (2017). - PMC - PubMed
    1. Lebreton L., Slat B., Ferrari F., Sainte-Rose B., Aitken J., Marthouse R., Hajbane S., Cunsolo S., Schwarz A., Levivier A., Noble K., Debeljak P., Maral H., Schoeneich-Argent R., Brambini R., Reisser J., Evidence that the Great Pacific Garbage Patch is rapidly accumulating plastic. Sci. Rep. 8, 4666 (2018). - PMC - PubMed
    1. Geyer R., Jambeck J. R., Law K. L., Production, use, and fate of all plastics ever made. Sci. Adv. 3, e1700782 (2017). - PMC - PubMed
    1. Wilcox C., Van Sebille E., Hardesty B. D., Threat of plastic pollution to seabirds is global, pervasive, and increasing. Proc. Natl. Acad. Sci. U.S.A. 112, 11899–11904 (2015). - PMC - PubMed