. 2021 Apr;9(4):e002189.
doi: 10.1136/jitc-2020-002189.

Expanded antigen-experienced CD160+CD8+effector T cells exhibit impaired effector functions in chronic lymphocytic leukemia

Affiliations

Expanded antigen-experienced CD160+CD8+effector T cells exhibit impaired effector functions in chronic lymphocytic leukemia

Najmeh Bozorgmehr et al. J Immunother Cancer. 2021 Apr.

Abstract

Background: T cell exhaustion compromises antitumor immunity, and a sustained elevation of co-inhibitory receptors is a hallmark of T cell exhaustion in solid tumors. Similarly, upregulation of co-inhibitory receptors has been reported in T cells in hematological cancers such as chronic lymphocytic leukemia (CLL). However, the role of CD160, a glycosylphosphatidylinositol-anchored protein, as one of these co-inhibitory receptors has been contradictory in T cell function. Therefore, we decided to elucidate how CD160 expression and/or co-expression with other co-inhibitory receptors influence T cell effector functions in patients with CLL.

Methods: We studied 56 patients with CLL and 25 age-matched and sex-matched healthy controls in this study. The expression of different co-inhibitory receptors was analyzed in T cells obtained from the peripheral blood or the bone marrow. Also, we quantified the properties of extracellular vesicles (EVs) in the plasma of patients with CLL versus healthy controls. Finally, we measured 29 different cytokines, chemokines or other biomarkers in the plasma specimens of patients with CLL and healthy controls.

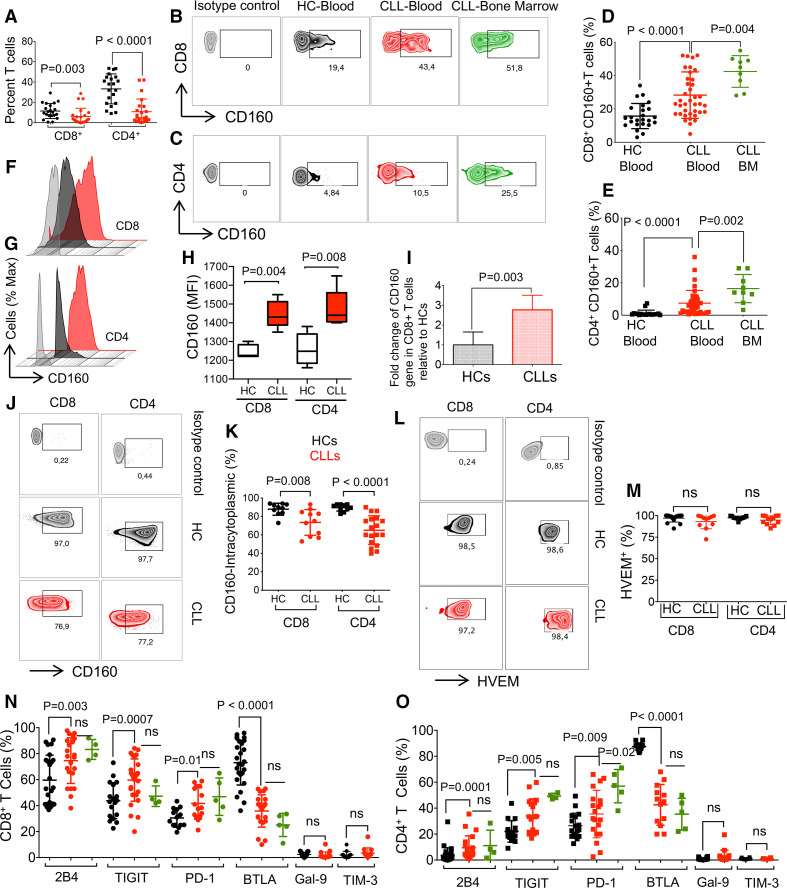
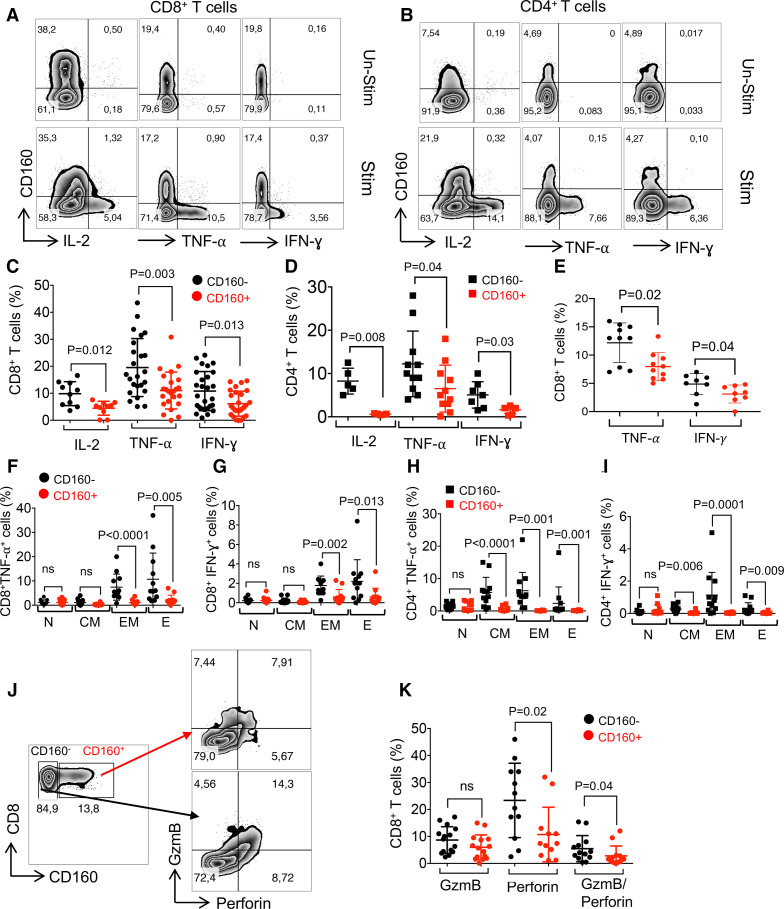
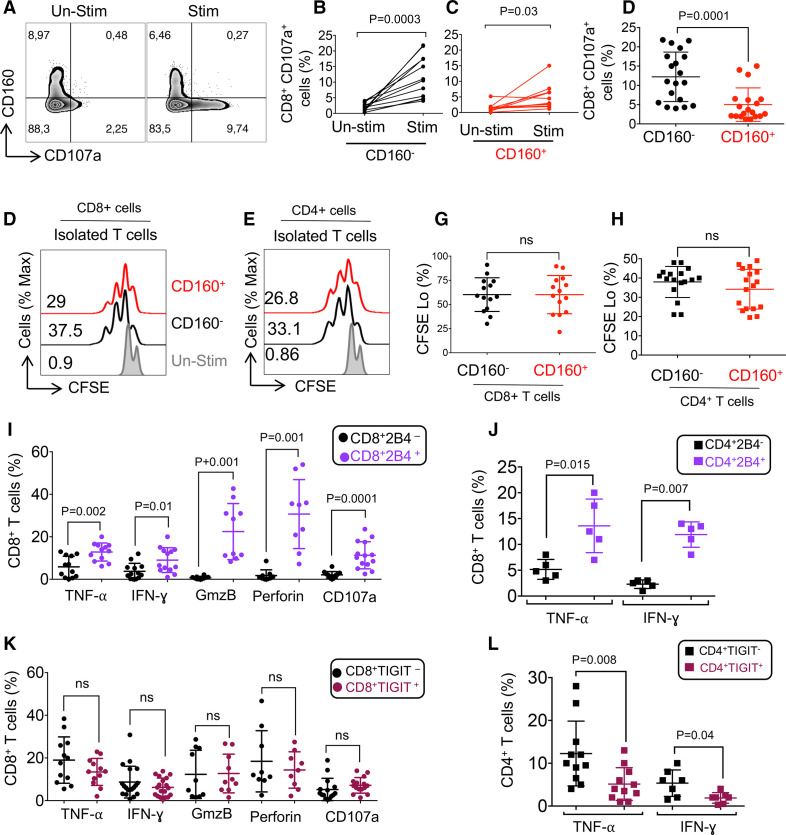
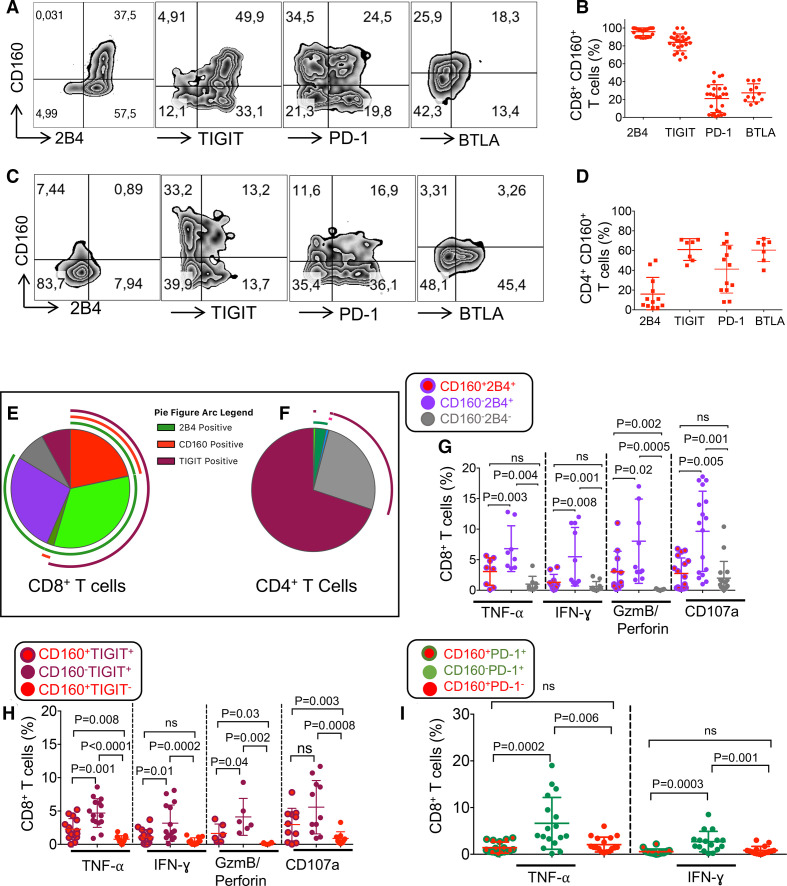
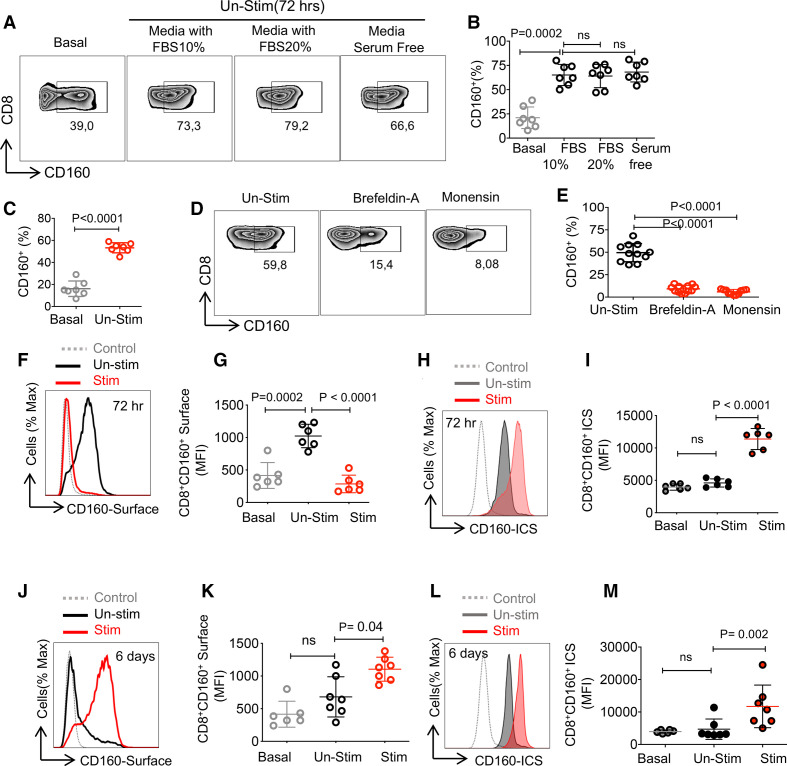
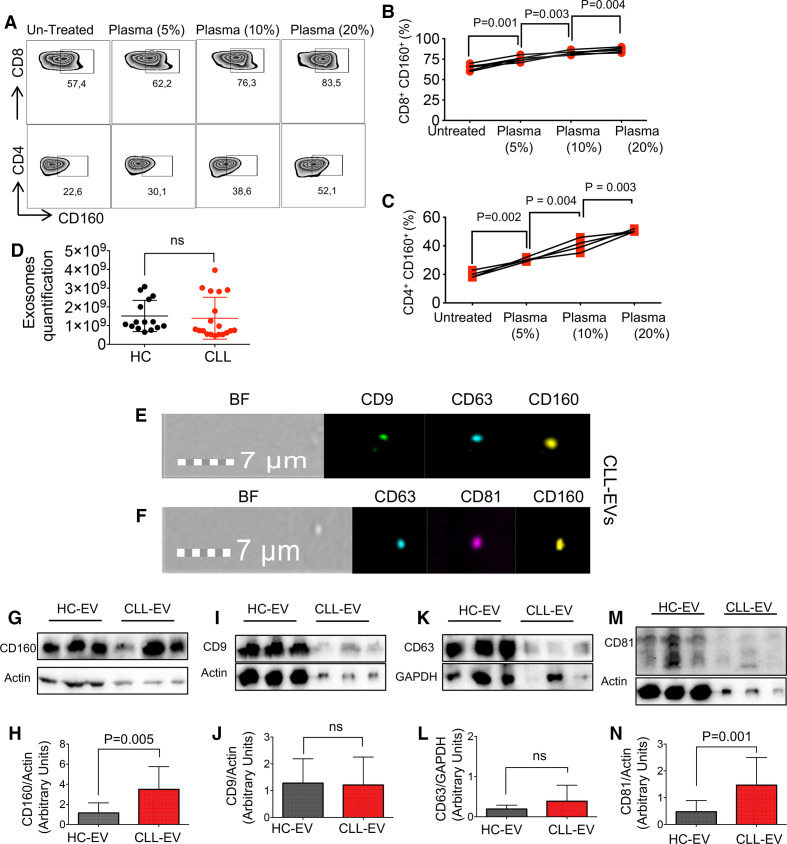
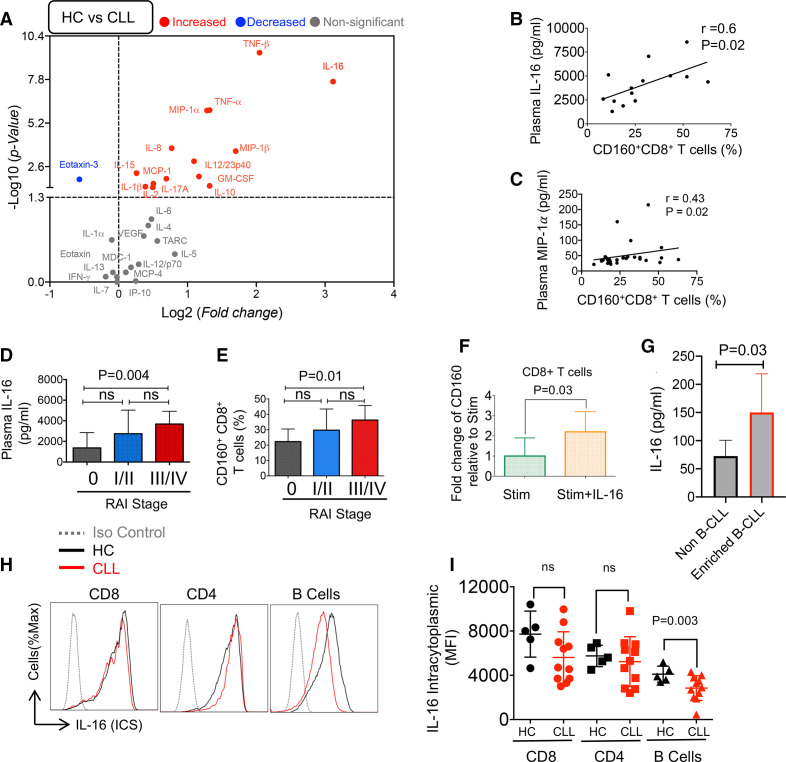
Results: We found that CD160 was the most upregulated co-inhibitory receptor in patients with CLL. Its expression was associated with an exhausted T cell phenotype. CD160+CD8+ T cells were highly antigen-experienced/effector T cells, while CD160+CD4+ T cells were more heterogeneous. In particular, we identified EVs as a source of CD160 in the plasma of patients with CLL that can be taken up by T cells. Moreover, we observed a dominantly proinflammatory cytokine profile in the plasma of patients with CLL. In particular, interleukin-16 (IL-16) was highly elevated and correlated with the advanced clinical stage (Rai). Furthermore, we observed that the incubation of T cells with IL-16 results in the upregulation of CD160.

Conclusions: Our study provides a novel insight into the influence of CD160 expression/co-expression with other co-inhibitory receptors in T cell effector functions in patients with CLL. Besides, IL-16-mediated upregulation of CD160 expression in T cells highlights the importance of IL-16/CD160 as potential immunotherapy targets in patients with CLL. Therefore, our findings propose a significant role for CD160 in T cell exhaustion in patients with CLL.

Keywords: B-lymphocytes; T-lymphocytes; cellular; costimulatory and inhibitory T-cell receptors; cytokines; immunity.


Conflict of interest statement

Competing interests: None declared.

Figures

Figure 1
Figure 1
The expression of co-inhibitory receptors on T cells. (A) Cumulative data showing percentages of CD8+ and CD4+ T cells in peripheral blood mononuclear cells (PBMCs) of patients with chronic lymphocytic leukemia (CLL) versus healthy controls (HCs). (B) Representative flow cytometry plots of CD160+CD8+ T cells, and (C) CD160+CD4+ T cells in the blood and bone marrow (BM) of patients with CLL versus HC blood. (D) Cumulative data of percentages of CD160+ among CD8+ T cells, and (E) CD4+ T cells in CLL (blood and BM) versus HC blood. (F) Histogram plots of CD160 expression on CD8+, and (G) CD4+ T cells measured by the mean fluorescence intensity (MFI), and (H) cumulative data in CD8+/CD4+T cells of patients with CLL versus HCs. (I) Expression of CD160 mRNA level in CD8+ T cells of patients with CLL (PBMCs) relative to HCs. (J) Representative flow cytometry plots, and (K) cumulative data of percentages of CD8+ and CD4+ T cells expressing intracytoplasmic (ICS) CD160 in PBMCs of patients with CLL versus HCs. (L) Representative flow cytometry plots, and (M) cumulative data of percentages of HVEM+CD8+ and HVEM+CD4+ T cells in patients with CLL versus HCs. (N) Cumulative data of percentages of CD8+, and (O) CD4+ T cells expressing surface expression of 2B4, TIGIT, PD-1, BTLA, Galectin-9 (GAL-9) and TIM-3 on CD8+ T cells in patients with CLL (blood and BM) versus HC blood. Each dot represents data from a single patient with CLL or HC. Figure 1H and 1L from six human subjects/group. BTLA, B- and T-lymphocyte attenuator; HVEM, herpesvirus entry mediator; TIGIT, T cell immunoreceptor with Ig and ITIM domains; TIM-3, T-cell immunoglobin ad mucin-domain containing-3.
Figure 2
Figure 2
Impaired cytokine production and cytolytic activity of CD160+ T cells in patients with chronic lymphocytic leukemia (CLL). (A) Representative flow cytometry plots of interleukin-2 (IL-2), tumor necrosis factor-α (TNF-α) and interferon-γ (IFN-γ) expression in CD8+CD160- and CD8+CD160+, and (B) CD4+CD160- versus CD4+CD160+ T cells. (C) Cumulative data of percentages of IL-2, TNF-α and IFN-γ expressing cells among CD8+CD160- and CD8+CD160+, and (D) CD4+CD160- and CD4+CD160+ T cells after 5 hours of in vitro stimulation with anti-CD3/CD28 antibodies. (E) Cumulative data of percentages of TNF-α and IFN-γ expressing cells among CD8+CD160- and CD8+CD160+ T cells in healthy controls (HCs). (F) Cumulative data of percentages of TNF-α, and (G) IFN-γ expressing cells in CD8+CD160- versus CD8+CD160+ T cells of patients with CLL defined as (N: naive; CM: central memory; EM: effector memory; E: effector). (H) Cumulative data of percentages of TNF-α, and (I) IFN-γ expressing cells in CD4+CD160- versus CD4+CD160+ T cells in different T cell subsets as shown. (J) Representative flow cytometry plots, and (K) cumulative data of percentages of granzyme-B (GzmB) and perforin expressing cells in CD8+CD160- versus CD8+CD160+ T cells in patients with CLL. For TNF-α and IFN-γ analysis, peripheral blood mononuclear cells (PBMCs) were stimulated with the anti-CD3 (3 μg/mL) and anti-CD28 (1 μg/mL) in the presence of protein transporter inhibitor (1:1000) for 5 hours. Each dot represents data from a single patient with CLL.
Figure 3
Figure 3
The impact of CD160, 2B4 and TIGIT expression on T cell effector functions in patients with chronic lymphocytic leukemia (CLL). (A) Representative flow cytometry plots, and (B–D) cumulative data of percentages of CD107a expressing cells among CD8+CD160- and CD160+CD8+ T cells in unstimulated versus stimulated peripheral blood mononuclear cells (PBMCs) with anti-CD3/CD28 antibodies for 5 hours. (E) Representative flow cytometry plot of percentages of CFSElo (proliferated) CD8+CD160- and CD8+CD160+, and (F) CD4+CD160- and CD4+CD160+ T cells. (G) Cumulative data of percentages of CFSElo CD8+CD160- versus CD8+CD160+, and (H) CD4+CD160- versus CD4+CD160- T cells after stimulation of PBMCs from CLL patients with anti-CD3/CD28 antibodies for 3 days. (I) Cumulative data of percentages of tumor necrosis factor-α (TNF-α), interferon-γ (IFN-γ), granzyme-B (GzmB), perforin and CD107a expressing cells among 2B4-/2B4+CD8+ T cells. (J) Cumulative data showing percentages of TNF-α and IFN-γ expressing cells among 2B4-/2B4+ CD4+ T cells of patients with CLL. (K) Cumulative data showing percentages of TNF-α, IFN-γ, GzmB, perforin and CD107a expressing cells among TIGIT-/TIGIT+ CD8+ T cells. (L) Cumulative data showing percentages of TNF-α and IFN-γ expressing cells among TIGIT-/TIGIT+ CD4+ T cells of patients with CLL. For TNF-α and IFN-γ and CD107a analysis, PBMCs were stimulated with the anti-CD3 (3 μg/mL) and the anti-CD28 (1 μg/mL) antibody in the presence of protein transporter inhibitor (1:1000) for 5 hours. Each dot represents data from a single patient with CLL. TIGIT, T cell immunoreceptor with Ig and ITIM domains.
Figure 4
Figure 4
Co-expression of CD160 with other co-inhibitory receptors on T cells in patients with lymphocytic leukemia (CLL). (A) Representative flow cytometry plots, and (B) cumulative data showing percentages of CD160 co-expression with 2B4, TIGIT, PD-1, and BTLA in CD8+ T cells. (C) Representative flow cytometry plots, and (D) cumulative data showing percentages of CD160 co-expression with 2B4, TIGIT, PD-1, and BTLA in CD4+ T cells. (E) The pie chart showing percentages of CD8+ T cells co-expressing CD160, 2B4, and TIGIT, simultaneously. (F) The pie chart showing percentages of CD4+ T cells co-expressing CD160, 2B4, and TIGIT, simultaneously. (G) Cumulative data showing percentages of tumor necrosis factor-α (TNF-α), interferon-γ (IFN-γ), granzyme-B (GzmB), perforin and CD107a expressing cells among CD160+2B4+/CD160-2B4+/CD160-2B4- CD8+ T cells. (H) Cumulative data showing percentages of TNF-α, IFN-γ, GzmB, perforin and CD107a expressing cells among CD160+TIGIT+/CD160-TIGIT+/CD160+TIGIT- CD8+ T cells. (I) Cumulative data showing percentages of TNF-α, IFN-γ expressing cells among CD160+PD-1+/CD160-PD-1+/CD160+PD-1- CD8+ T cells. Each dot represents data from a single patient with CLL. BTLA, B- and T-lymphocyte attenuator; PD-1, programmed cell death protein-1; TIGIT, T cell immunoreceptor with Ig and ITIM domains.
Figure 5
Figure 5
Prolonged T cell stimulation upregulates CD160 expression. (A) Representative flow cytometry plots, and (B) cumulative data showing percentages of CD8+ T cells expressing CD160 at the baseline, in the presence of 10%, 20% (fetal bovine serum (FBS)) or in the absence of FBS after 72 hours in vitro culture of total peripheral blood mononuclear cells (PBMCs) from patients with chronic lymphocytic leukemia (CLL). (C) Cumulative data showing percentages of isolated CD8+ T cells expressing CD160 at the baseline and after 72 hours in vitro culture. (D) Representative flow cytometry plots, and (E) cumulative data of percentages of CD8+ T cells expressing CD160 in the absence or presence of Brefeldin A and Monensin after 6-hour culture of peripheral blood mononuclear cells (PBMCs). (F) Representative histogram, and (G) cumulative data of the mean fluorescence intensity (MFI) of surface CD160 expression on CD8+ T cells stimulated with anti-CD3/CD28 antibodies (stim) versus unstimulated (Un-stim) for 72 hours. (H) Representative histogram, and (I) cumulative data of intracytoplasmic CD160 expression in CD8+ T cells unstimulated versus stimulated with anti-CD3/CD28 for 72 hours. (J) Representative histogram, and (K) cumulative data of MFI for the surface expression of CD160 in CD8+ T cells, unstimulated versus stimulated with anti-CD3/CD28 after 6 days of in vitro culture. (L) Representative histogram, and (M) cumulative data of MFI for the intracytoplasmic expression of CD160 in CD8+ T cells, unstimulated versus stimulated with anti-CD3/CD28 after 6 days of in vitro culture. Each dot represents data from a single study subject. ICS, intracytoplasmic staining.
Figure 6
Figure 6
Plasma-derived extracellular vesicles (EVs) contain CD160. (A) Representative flow cytometry plots of CD160 expression in CD8+ and CD4+ T cells untreated versus treated with the plasma from patients with chronic lymphocytic leukemia (CCL) (using 5%, 10% and 20% plasma) after 72 hours of in vitro culture. (B) Cumulative data of percentages of CD160 expressing cells among CD8+, and (C) CD4+ T cells either untreated or treated with indicated plasma concentrations after 72 hours. (D) Quantification of EV numbers isolated from the plasma of CLLs versus healthy controls (HCs) by Exocet ELISA kit. (E) ImageStream plots of plasma-derived EVs showing the expression of CD9, CD63 and CD160, bright field (BF). (F) ImageStream plots of plasma-derived EVs showing expression of CD63, CD81 and CD160. (G) Representative western blot (WB) images of plasma-derived EVs from HCs and patients with CLL depicting CD160 presence. (H) Cumulative data showing normalized arbitrary units of CD160/actin in plasma-derived EVs in HCs versus patients with CLL. (I) Representative WB images of plasma-derived EVs depicting CD9 expression, and (J) cumulative data showing normalized arbitrary units of CD9/actin in plasma-derived EVs in HCs versus patients with CLL. (K) Representative WB images of plasma-derived EVs depicting CD63 expression, and (L) cumulative data showing normalized arbitrary units of CD63/GAPDH in plasma-derived EVs in HCs versus patients with CLL. (M) Representative WB images of plasma-derived EVs depicting CD81 expression, and (N) cumulative data showing normalized arbitrary units of CD160/actin in plasma-derived EVs in HCs versus patients with CLL. Actin was used as a loading control to normalize protein amounts of CD81, CD9, and CD160, and GAPDH was used as a loading control to normalize protein amount of CD63. Each dot/band represents data from a subject.
Figure 7
Figure 7
The plasma cytokines/chemokines in the plasma of patients with chronic lymphocytic leukemia (CLL) versus healthy controls (HCs). (A) The volcano plot illustrating the magnitude and significance of differences in cytokine/chemokines plasma concentrations (measured by the Mesoplex assay) in patients with CLL versus HCs. (B) Scatter plot of the correlation between percentages of CD160+CD8+ T cells in peripheral blood mononuclear cells (PBMCs) with the interleukin-16 (IL-16), and (C) MIP-1α concentrations in the plasma of patients with CLL. (D) Cumulative data showing IL-16 concentrations in the plasma of patients with CLL in low (0), intermediate (I/II), and high (III/IV) Rai stages, 16, 24 and 7 patients/group, respectively. (E) Cumulative data of percentages of CD160+ expressing cells among CD8+ T cells in PBMCs of patients with CLL in low (0), intermediate (I/II), and high (III/IV) Rai stages, 9, 20 and 6 patients/group, respectively. (F) Fold regulation of CD160 gene in CD8+ T cells stimulated with the anti-CD3/CD28 antibodies in the absence or presence of rh-IL-16 (500 ng/mL) for 72 hours relative to stimulated as quantified by qPCR from seven human subjects/group. (G) Cumulative data of IL-16 production in cell culture supernatants of isolated B-CLL versus non-B-CLLs after 12 hours’ culture as detected by ELISA from four patients. (H) Representative flow cytometry plots, and (I) cumulative data of intracytoplasmic IL-16 expression in CD8+, CD4+, and B cells of patients with CLL versus HCs. MIP-1α, macrophage inflammatory protein-1 alpha.

Similar articles

Cited by

References

    1. Seifert M, Sellmann L, Bloehdorn J, et al. . Cellular origin and pathophysiology of chronic lymphocytic leukemia. J Exp Med 2012;209:2183–98.10.1084/jem.20120833 - DOI - PMC - PubMed
    1. Scarfò L, Ferreri AJM, Ghia P. Chronic lymphocytic leukaemia. Crit Rev Oncol Hematol 2016;104:169–82.10.1016/j.critrevonc.2016.06.003 - DOI - PubMed
    1. Arruga F, Gyau BB, Iannello A, et al. . Immune response dysfunction in chronic lymphocytic leukemia: dissecting molecular mechanisms and microenvironmental conditions. Int J Mol Sci 2020;21. 10.3390/ijms21051825. [Epub ahead of print: 06 Mar 2020]. - DOI - PMC - PubMed
    1. Christopoulos P, Pfeifer D, Bartholomé K, et al. . Definition and characterization of the systemic T-cell dysregulation in untreated indolent B-cell lymphoma and very early CLL. Blood 2011;117:3836–46.10.1182/blood-2010-07-299321 - DOI - PubMed
    1. Porakishvili N, Roschupkina T, Kalber T, et al. . Expansion of CD4+ T cells with a cytotoxic phenotype in patients with B-chronic lymphocytic leukaemia (B-CLL). Clin Exp Immunol 2001;126:29–36.10.1046/j.1365-2249.2001.01639.x - DOI - PMC - PubMed

Publication types

MeSH terms