. 2021 Apr 30;5(4):257-272.
doi: 10.4049/immunohorizons.2000101.

Physiology of Cultured Human Microglia Maintained in a Defined Culture Medium

Affiliations

Physiology of Cultured Human Microglia Maintained in a Defined Culture Medium

Manju Tewari et al. Immunohorizons. .

Abstract

Microglia are the primary immune cell of the CNS, comprising 5-20% of the ∼60 billion neuroglia in the human brain. In the developing and adult CNS, they preferentially target active neurons to guide synapse maturation and remodeling. At the same time, they are the first line of defense against bacterial, fungal, and viral CNS infections. Although an extensive literature details their roles in rodents, less is known about how they function in humans because of the difficulty in obtaining tissue samples and the understandable inability to extensively study human microglia in situ. In this study, we use recent advances in the study of brain microenvironments to establish cultures of primary human microglia in a serum-free medium. Postsurgical samples of human brain were enzymatically and mechanically dissociated into single cells, and microglia were isolated at high purity by positive selection using CD11b Ab-coated microbeads. The CD11b+ cells were plated on poly-l-lysine-coated surfaces and bathed in serum-free DMEM/F12 supplemented with three essential components (TGF-β, IL-34, and cholesterol). Under these conditions, microglia assumed a ramified morphology, showed limited proliferation, actively surveyed their surroundings, and phagocytosed bacterial microparticles. In the presence of LPS, they assumed a more compact shape and began production of proinflammatory cytokines and reactive oxygen species. LPS on its own triggered release of TNF-α, whereas release of IL-1β required costimulation by ATP. Thus, human microglia maintained in a defined medium replicate many of the characteristics expected of native cells in the brain and provide an accessible preparation for investigations of human microglial physiology, pharmacology, and pathophysiology.


Figures

Figure 1.
Figure 1.. Viable ramified microglia in TIC-culture.
(A) CD11b+ cells were incubated in calcein-AM and propidium iodide (PI) immediately following purification by magnetic selection. When visualized by fluorescence microscopy, viable cells retain calcein (green) and exclude PI (red). (B) Quantification of data like those shown in Panel A. Each data point indicates the percentage of live (calcein+/PI) and dead (calcein/PI+) cells in one of 15 fields of view. Box designates the 25% and 75% quartiles. The dotted lines are the median values. (C,D) Photomicrographs of two samples of CD11b+ cells maintained on poly-l-lysine coated glass coverslips in TIC medium for 21 days shown at 10X (C) and 40X (D) magnifications. (E) Confocal image of microglia showing the secondary branches. The ramified morphology suggests a microglia lineage.
Figure 2.
Figure 2.. CD11b+ cells show positive staining for two specific microglial markers.
CD11b+ cells purified by positive selection were co-stained with a nuclear stain (DAPI) to count cells, a positive marker of cells of myeloid origin (Iba1), and one of two positive markers for microglia (P2Y12R (A) or TMEM119 (B)). In both cases, composite images (rightmost panels of A and B) show near complete overlap of staining for Iba1 and the microglial markers.
Figure 3.
Figure 3.. Microglia do not proliferate in TIC medium.
Cultures incubated in the absence of FBS (row A) show fewer cells and less Ki-67 staining than those incubated in the presence of 10% FBS (row B). (C) Each point indicates the total number of cells in the field of view at 20X magnification for cultures maintained in the absence (−FBS) or presence (+FBS) of serum. The addition of serum to the TIC medium resulted in greater cell numbers. The dotted line is the median number of cells per field of view. (D) Percentage of Ki-67+ cells in the absence (−FBS) and presence (+FBS) of serum. The percentage was calculated by dividing the number of cells showing positive staining for Ki-67 stained by the number cells stained by DAPI.
Figure 4.
Figure 4.. Gene expression of human microglia in TIC-cultures.
Tissue sample from a GBM patient. The graph shows the log2-fold change in transcripts for 10 genes from cells maintained eight days in culture by comparison to cells maintained 1 day in culture.
Figure 5.
Figure 5.. TIC-cultured microglia phagocytosis in the absence of serum.
(A) Confocal images captured 10 (right panel) and 310 (left panel) min after addition of pHrodo bioparticles (20 μg/ml) to TIC-cultured microglia. Images were extracted from Supplemental Movie 2. (B) Microglia show extensive phagocytosis of pHrodo conjugated E. coli bioparticles seen as red fluorescence in the absence of serum (left panel). In a separate experiment, addition of ATP (5 mM) results in less phagocytosis (right panel). (C) Phagocytosis is quantified as the CFTC in RFUs (see Methods for details) for cells incubated in the absence of serum (control) and the presence of 5 mM ATP, 20 μM of a P2X7R antagonist (A804598), or both (ATP + A804598).
Figure 6.
Figure 6.. LPS induces a proinflammatory phenotype in TIC-cultured human microglia.
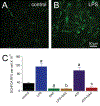
Microglia were cultured for seven days in TIC medium before introduction of LPS (10 μg/ml) for 24 hr. (A) Naïve microglia show a ramified morphology with rod-shaped cell bodies and radial extensions. (B) Cells incubated for 24 hr in LPS show larger somas and fewer extensions than control cells, suggesting that LPS has induced a proinflammatory phenotype. (C) The graph plots the number of amoeboid cells divided by the number of total cells x 100%. LPS increased the percentage of cells adopting an amoeboid shape. (D) ATP (5 mM) evokes inward current in a voltage-clamped microglia held at −60mV. This resulting current is cation non-selective (inset). (E) ATP (5 mM; n = 53 cells) and BzATP (300 μM; n = 28) increased [Ca2+]i, seen as a change in background-subtracted intracellular Fluo-4 fluorescence measured in arbitrary units (AU). The increase in [Ca2+]i was blocked by the P2X7R antagonist A804598 (20 μM; n = 31). The cyan bar indicates the period of agonist application. (F) qPCR data from cells treated with LPS for 6 hr. LPS caused upregulation of proinflammatory transcripts. (G) Incubation in LPS for 6 hr facilitated the change in [Ca2+]i caused by ATP (5 mM, n = 39) and BzATP (300 μM, n = 139).
Figure 7.
Figure 7.. LPS stimulates production of proinflammatory cytokines.
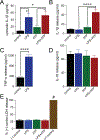
(A) LPS (10 μg/ml) for 4 hr but not ATP (5 mM) for 30 min results in production of intracellular IL-1β. (B) ATP (5 mM) evokes IL-1β release after LPS stimulation. (C) LPS stimulates TNF-α release in the absence of a DAMP. (D) Neither LPS nor ATP evoke release of IL-18. (E) LDH quantified by comparison to release evoked by lysis buffer. # indicates a significant difference (p < 0.01) from control.
Figure 8.
Figure 8.. LPS and ATP stimulate ROS production.
TIC-cultured human microglia show a baseline production of ROS (A) that is enhanced by a 1 hr incubation in LPS (B). (C) ROS production is measured as CTCF in RFUs for control cells (control) and those incubated alone or in combination with LPS, NAC, and ATP. LPS (10 μg/ml) and ATP (5 mM) applied for 1 hr stimulate ROS production (n = 43–60 for each drug paradigm); in both cases, the stimulation is prevented by preincubation with NAC (40 mM) for 30 min. Relevant significant differences between groups are designated with letters as follows: “a” indicates a significant difference from control. “b” indicates significant difference from LPS. “c” indicates a significant difference from ATP.

Similar articles

Cited by

References

    1. Wolf SA, Boddeke HW, and Kettenmann H. 2017. Microglia in Physiology and Disease. Annu Rev Physiol 79: 619–643. - PubMed
    1. Nimmerjahn A, Kirchhoff F, and Helmchen F. 2005. Resting microglial cells are highly dynamic surveillants of brain parenchyma in vivo. Science 308: 1314–1318. - PubMed
    1. Fu R, Shen Q, Xu P, Luo JJ, and Tang Y. 2014. Phagocytosis of microglia in the central nervous system diseases. Mol. Neurobiol. 49: 1422–1434. - PMC - PubMed
    1. Hanisch UK, and Kettenmann H. 2007. Microglia: active sensor and versatile effector cells in the normal and pathologic brain. Nat Neurosci 10: 1387–1394. - PubMed
    1. Carroll JA, and Chesebro B. 2019. Neuroinflammation, Microglia, and Cell-Association during Prion Disease. Viruses 11. - PMC - PubMed

Publication types