

Threshold accumulation of a constitutive protein explains E. coli cell-division behavior in nutrient upshifts
- PMID: 33931503
- PMCID: PMC8106335
- DOI: 10.1073/pnas.2016391118
Threshold accumulation of a constitutive protein explains E. coli cell-division behavior in nutrient upshifts
Abstract
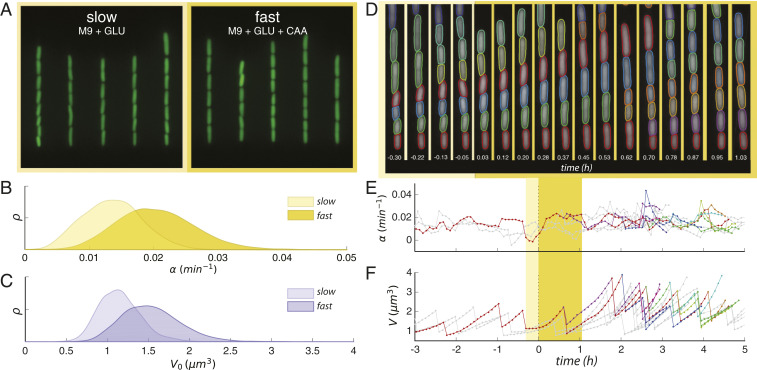
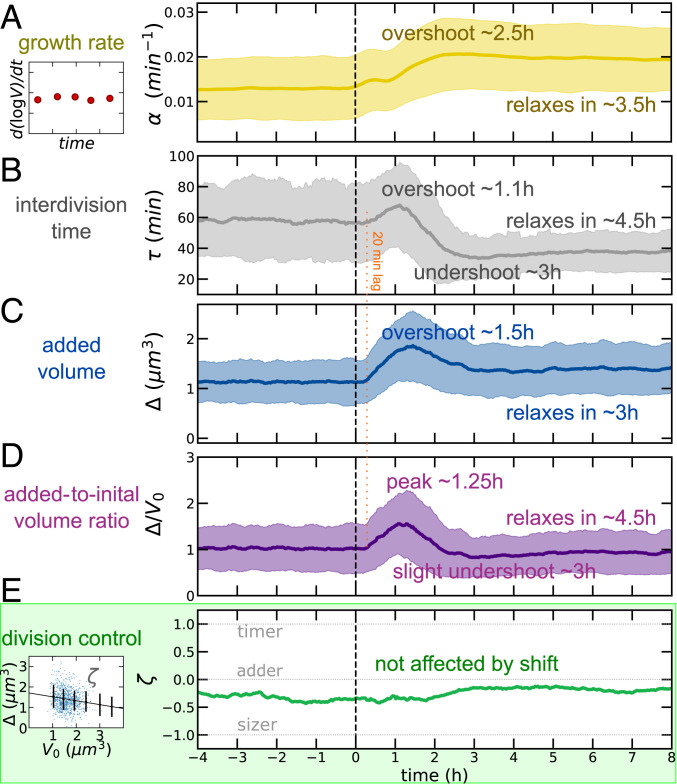
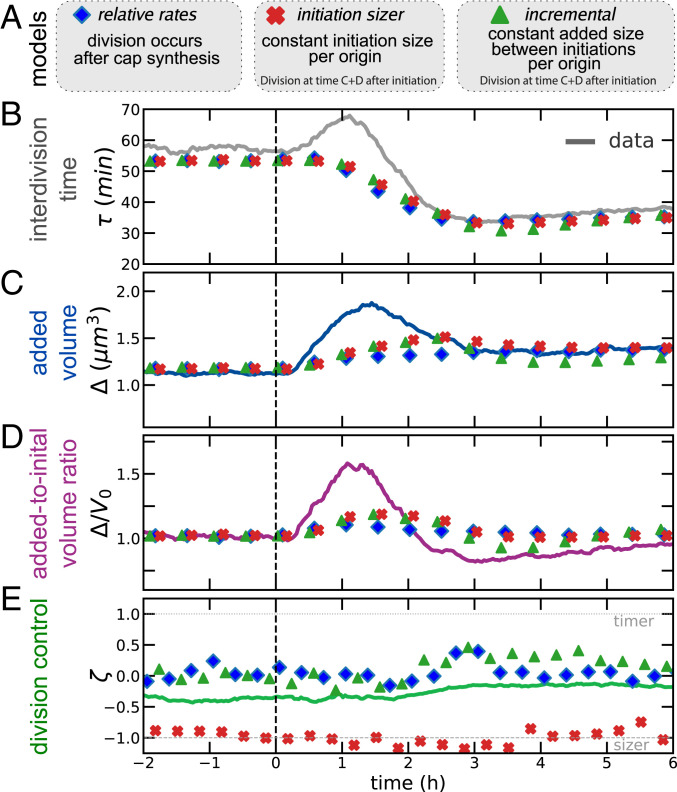
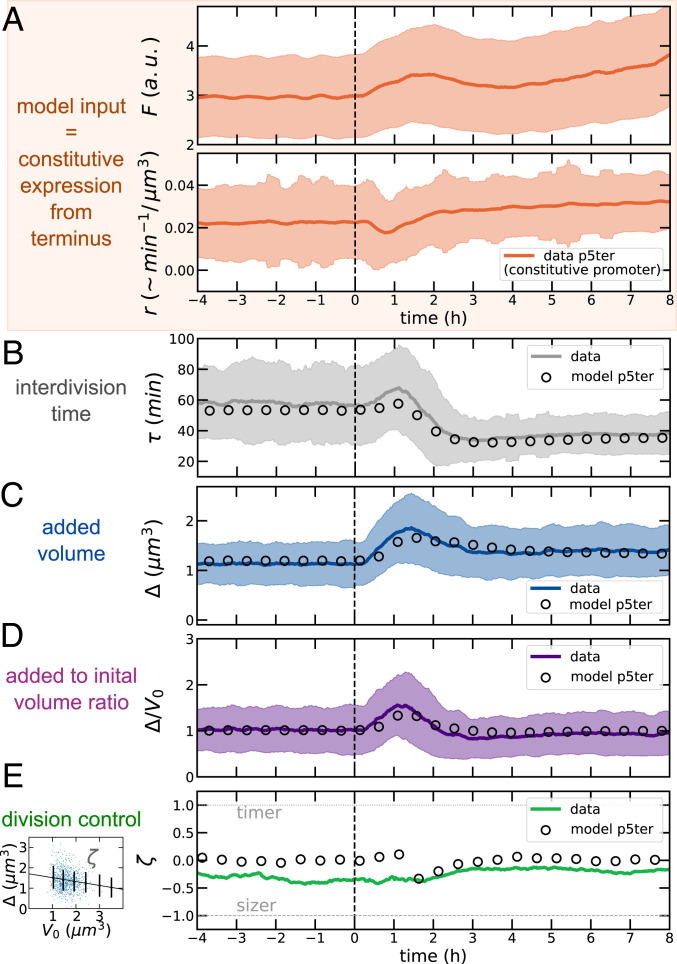
Despite a boost of recent progress in dynamic single-cell measurements and analyses in Escherichia coli, we still lack a mechanistic understanding of the determinants of the decision to divide. Specifically, the debate is open regarding the processes linking growth and chromosome replication to division and on the molecular origin of the observed "adder correlations," whereby cells divide, adding roughly a constant volume independent of their initial volume. In order to gain insight into these questions, we interrogate dynamic size-growth behavior of single cells across nutrient upshifts with a high-precision microfluidic device. We find that the division rate changes quickly after nutrients change, much before growth rate goes to a steady state, and in a way that adder correlations are robustly conserved. Comparison of these data to simple mathematical models falsifies proposed mechanisms, where replication-segregation or septum completions are the limiting step for cell division. Instead, we show that the accumulation of a putative constitutively expressed "P-sector divisor" protein explains the behavior during the shift.
Keywords: E. coli; cell division; cell growth; mathematical modeling; single-cell biology.
Conflict of interest statement
The authors declare no competing interest.
Figures
Similar articles
-
Initiation of chromosome replication controls both division and replication cycles in E. coli through a double-adder mechanism.Elife. 2019 Nov 11;8:e48063. doi: 10.7554/eLife.48063. Elife. 2019. PMID: 31710292 Free PMC article.
-
Concurrent processes set E. coli cell division.Sci Adv. 2018 Nov 7;4(11):eaau3324. doi: 10.1126/sciadv.aau3324. eCollection 2018 Nov. Sci Adv. 2018. PMID: 30417095 Free PMC article.
-
Dissecting the Control Mechanisms for DNA Replication and Cell Division in E. coli.Cell Rep. 2018 Oct 16;25(3):761-771.e4. doi: 10.1016/j.celrep.2018.09.061. Cell Rep. 2018. PMID: 30332654
-
Co-ordinate regulation of the Escherichia coli cell cycle or The cloud of unknowing.Mol Microbiol. 2001 May;40(4):779-85. doi: 10.1046/j.1365-2958.2001.02439.x. Mol Microbiol. 2001. PMID: 11401685 Review.
-
When size matters - coordination of growth and cell cycle in bacteria.Acta Biochim Pol. 2019 Apr 10;66(2):139-146. doi: 10.18388/abp.2018_2798. Acta Biochim Pol. 2019. PMID: 30970043 Review.
Cited by
-
Incoherent feedback from coupled amino acids and ribosome pools generates damped oscillations in growing E. coli.Nat Commun. 2025 Mar 29;16(1):3063. doi: 10.1038/s41467-025-57789-4. Nat Commun. 2025. PMID: 40157904 Free PMC article.
-
Fundamental limits on the rate of bacterial growth and their influence on proteomic composition.Cell Syst. 2021 Sep 22;12(9):924-944.e2. doi: 10.1016/j.cels.2021.06.002. Epub 2021 Jul 1. Cell Syst. 2021. PMID: 34214468 Free PMC article.
-
Cellular resource allocation strategies for cell size and shape control in bacteria.FEBS J. 2022 Dec;289(24):7891-7906. doi: 10.1111/febs.16234. Epub 2021 Oct 30. FEBS J. 2022. PMID: 34665933 Free PMC article. Review.
-
Minorities drive growth resumption in cross-feeding microbial communities.Proc Natl Acad Sci U S A. 2023 Nov 7;120(45):e2301398120. doi: 10.1073/pnas.2301398120. Epub 2023 Oct 30. Proc Natl Acad Sci U S A. 2023. PMID: 37903278 Free PMC article.
-
Energy allocation theory for bacterial growth control in and out of steady state.bioRxiv [Preprint]. 2024 Jan 10:2024.01.09.574890. doi: 10.1101/2024.01.09.574890. bioRxiv. 2024. PMID: 38260684 Free PMC article. Preprint.
References
-
- Cadart C., Venkova L., Recho P., Lagomarsino M. C., Piel M., The physics of cell-size regulation across timescales. Nat. Phys. 15, 993–1004 (2019).
-
- Willis L., Huang K. C., Sizing up the bacterial cell cycle. Nat. Rev. Microbiol. 15, 606–620 (2017). - PubMed
-
- Osella M., Tans S. J., Lagomarsino M. C., Step by step, cell by cell: Quantification of the bacterial cell cycle. Trends Microbiol. 25, 250–256 (2017). - PubMed
