. 2021 Apr 30;12(5):426.
doi: 10.1038/s41419-021-03718-4.

GSTZ1 sensitizes hepatocellular carcinoma cells to sorafenib-induced ferroptosis via inhibition of NRF2/GPX4 axis

Affiliations

GSTZ1 sensitizes hepatocellular carcinoma cells to sorafenib-induced ferroptosis via inhibition of NRF2/GPX4 axis

Qiujie Wang et al. Cell Death Dis. .

Abstract

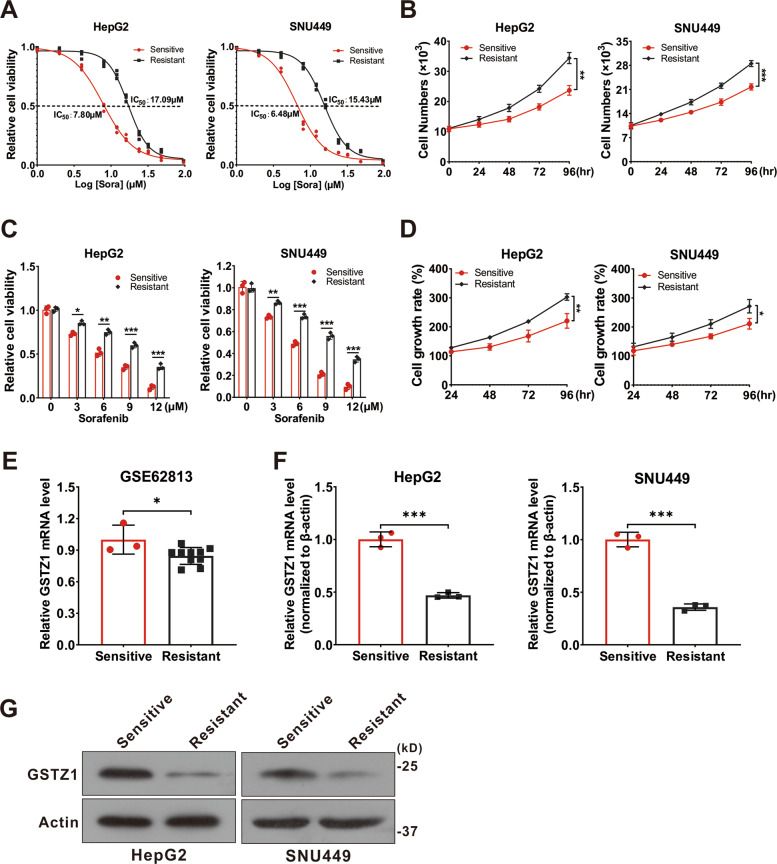
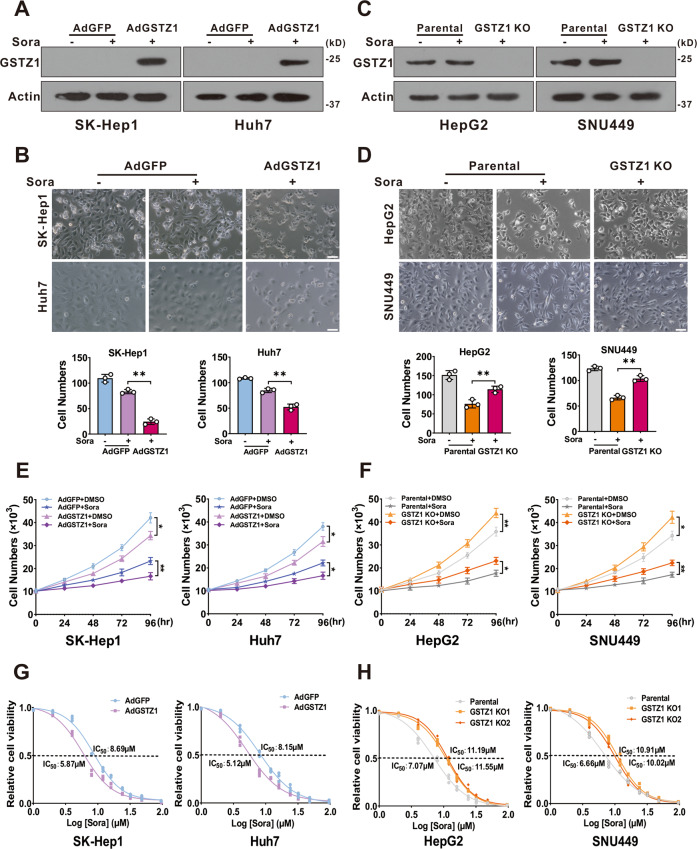
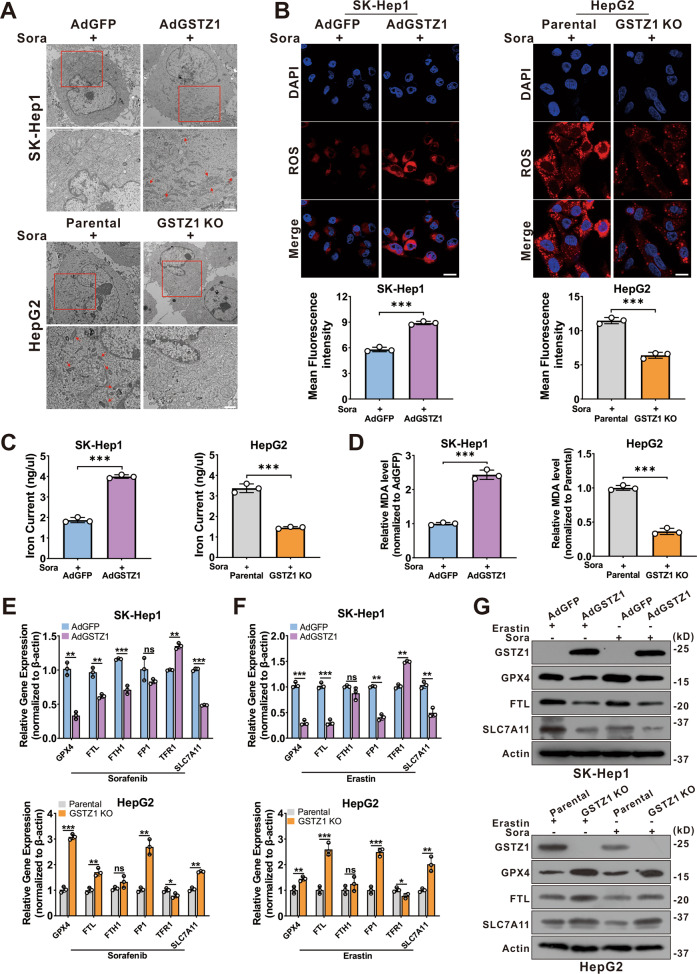
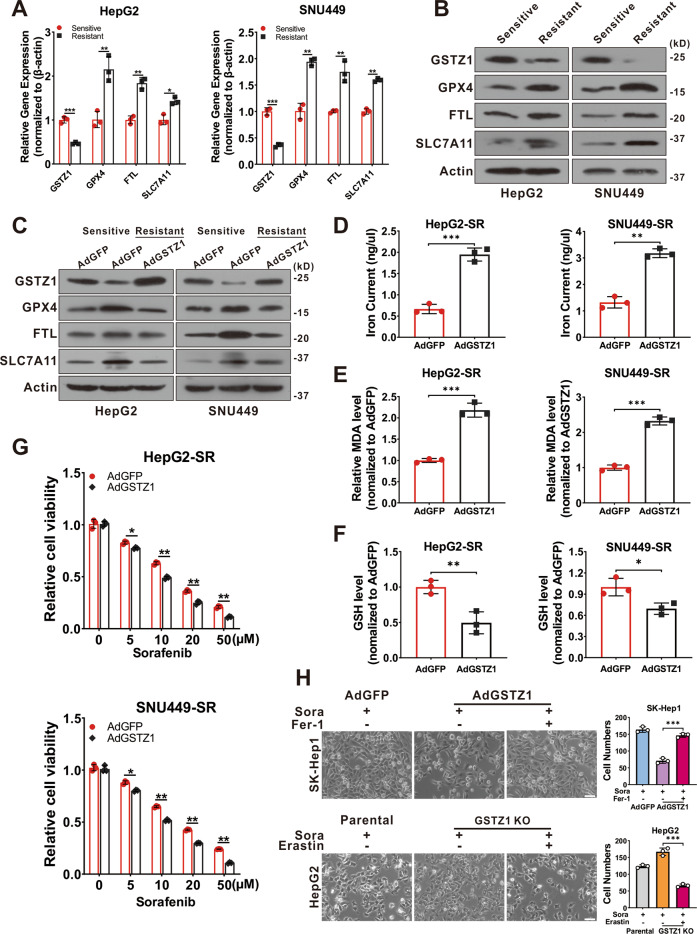
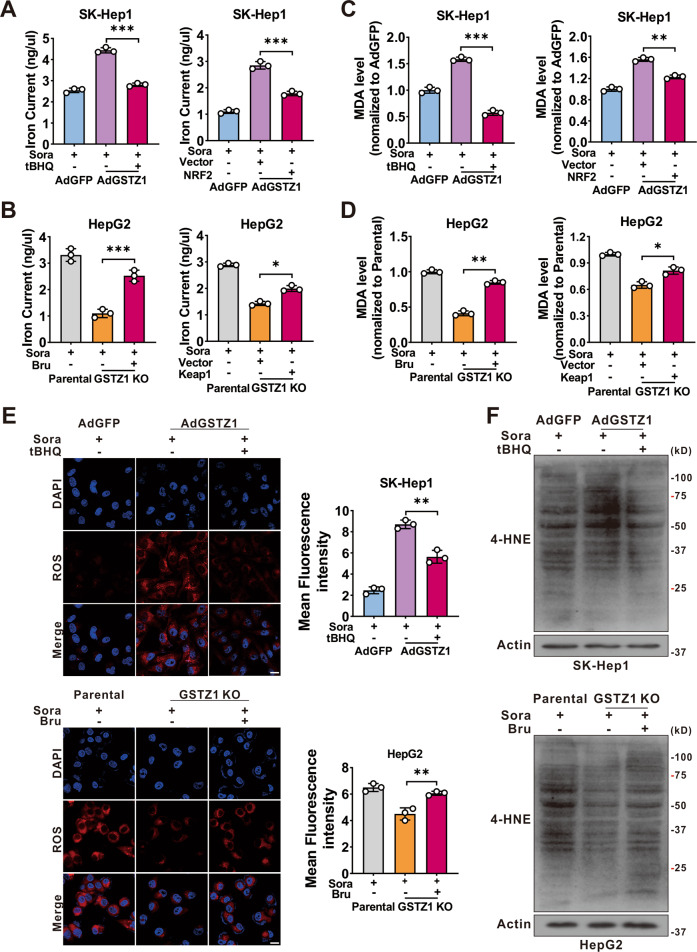
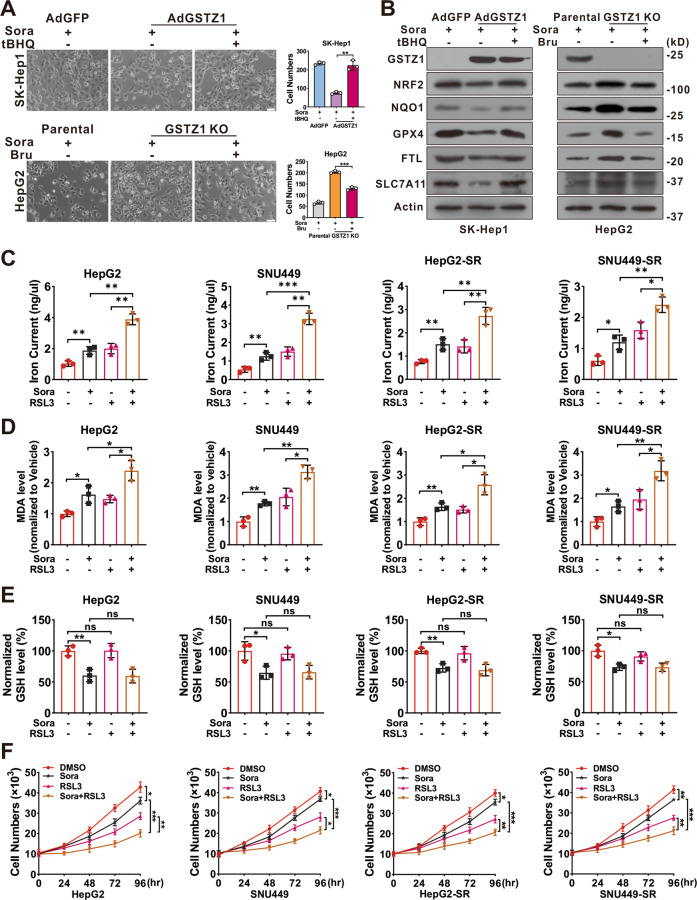
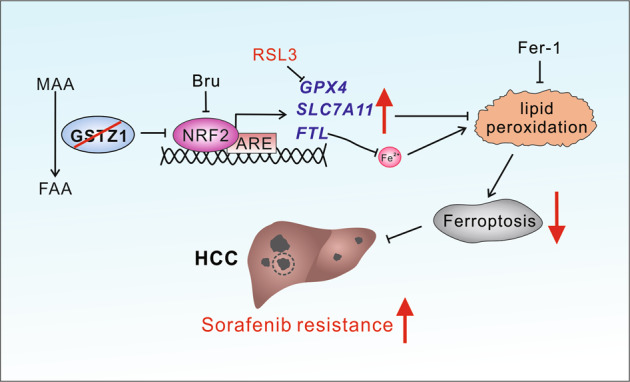
Increasing evidence supports that ferroptosis plays an important role in tumor growth inhibition. Sorafenib, originally identified as an inhibitor of multiple oncogenic kinases, has been shown to induce ferroptosis in hepatocellular carcinoma (HCC). However, some hepatoma cell lines are less sensitive to sorafenib-induced ferroptotic cell death. Glutathione S-transferase zeta 1 (GSTZ1), an enzyme in the catabolism of phenylalanine, suppresses the expression of the master regulator of cellular redox homeostasis nuclear factor erythroid 2-related factor 2 (NRF2). This study aimed to investigate the role and underlying molecular mechanisms of GSTZ1 in sorafenib-induced ferroptosis in HCC. GSTZ1 was significantly downregulated in sorafenib-resistant hepatoma cells. Mechanistically, GSTZ1 depletion enhanced the activation of the NRF2 pathway and increased the glutathione peroxidase 4 (GPX4) level, thereby suppressing sorafenib-induced ferroptosis. The combination of sorafenib and RSL3, a GPX4 inhibitor, significantly inhibited GSTZ1-deficient cell viability and promoted ferroptosis and increased ectopic iron and lipid peroxides. In vivo, the combination of sorafenib and RSL3 had a synergic therapeutic effect on HCC progression in Gstz1-/- mice. In conclusion, this finding demonstrates that GSTZ1 enhanced sorafenib-induced ferroptosis by inhibiting the NRF2/GPX4 axis in HCC cells. Combination therapy of sorafenib and GPX4 inhibitor RSL3 may be a promising strategy in HCC treatment.


Conflict of interest statement

The authors declare no competing interests.

Figures

Fig. 1
Fig. 1. GSTZ1 is downregulated in sorafenib-resistant HCC cells.
A The IC50 values of sorafenib-sensitive and sorafenib-resistant HCC cells treated with sorafenib. B Cell growth curve. C These sorafenib-sensitive and sorafenib-resistant HCCs (HepG2, SNU449) were treated with indicated concentrations of sorafenib for 24 h, and cell viability was assayed using the CCK-8 assay. D Cell growth rate. E GSTZ1 mRNA level in GEO dataset GSE62813. Sorafenib-sensitive HepG2 cells (n = 3) and sorafenib-resistant HepG2 cells (n = 10). FG mRNA and protein levels of GSTZ1 in sorafenib-sensitive and -resistant cells. For western blotting, 50 μg protein was loaded per well. HCC hepatocellular carcinoma. Values represent the mean ± standard deviation (SD) (n = 3). The qRT-PCR data determined from three independent experiments. *p < 0.05, **p < 0.01, ***p < 0.001, Student’s t-test (two groups).
Fig. 2
Fig. 2. GSTZ1 knockout promotes sorafenib resistance in HCC cells.
A Overexpression of GSTZ1 was confirmed by immunoblot assay. B Morphological phase-contrast images (top) and quantification (bottom) of GSTZ1-OE cells after treatment with or without sorafenib (10 μM) for 24 h. C Knockout of GSTZ1 was confirmed by immunoblot assay. D Morphological phase-contrast images (top) and quantification (bottom) of GSTZ1-KO cells after treatment with or without sorafenib (10 μM) for 24 h. Scale bar = 10 μm. E, F Cell growth curve. GSTZ1-OE (E) and GSTZ1-KO (F) cells were treated with or without sorafenib (10 μM). G, H The IC50 of GSTZ1-OE (G) and GSTZ1-KO (H) cells were determined using the CCK-8 assay. For western blotting, 50 μg protein was loaded per well. DMSO: dimethyl sulfoxide, Sora: sorafenib. Values represent the mean ± SD (n = 3). *p < 0.05, **p < 0.01, Student’s t-test (two groups).
Fig. 3
Fig. 3. GSTZ1 overexpression enhances sorafenib-induced ferroptosis in HCC.
A Representative TEM images of the mitochondrial morphology in GSTZ1-OE SK-Hep1 and GSTZ1-KO HepG2 cells treated with 10 μM sorafenib for 24 h. Red arrows indicate mitochondria. Scale bar = 1 μm. B Representative images (top) and quantification (bottom) of ROS level in GSTZ1-OE and GSTZ1-KO cells treated with sorafenib for 24 h. Scale bar = 20 μm. C, D The intracellular iron (C) and MDA (D) levels in GSTZ1-OE and GSTZ1-KO cells treated with sorafenib for 24 h. EG mRNA and protein levels of target genes associated with ferroptosis in GSTZ1-OE and GSTZ1-KO cells treated with sorafenib or erastin, determined via qRT-PCR (E, F) and western blotting (G), respectively. For western blotting, 50 μg protein was loaded per well. Values represent the mean ± SD (n = 3). The qRT-PCR data determined from three independent experiments. ns: no significant difference, *p < 0.05, **p < 0.01, ***p < 0.001, Student’s t-test (two groups).
Fig. 4
Fig. 4. GSTZ1 overexpression sensitizes hepatoma cells to sorafenib-induced ferroptosis.
A, B mRNA (A) and protein (B) levels of ferroptosis-related genes in sorafenib-sensitive and -resistant cells were assayed using qRT-PCR and western blotting, respectively. C Western blotting for assessment of protein levels of ferroptosis-related genes in sorafenib-resistant HCCs with adenoviruses expressing GFP (AdGFP) or GSTZ1 (AdGSTZ1). DF Iron (D), MDA (E) and GSH (F) levels in GSTZ1-OE sorafenib-resistant cells. G Cell viability was determined using CCK-8 assay. H Morphology (left) and quantification (right) of indicated HCC cells treated with sorafenib (10 μM for 24 h) alone or in combination with Fer-1 (1 μM for 24 h) or erastin (10 μM for 24 h). Scale bar = 10 μm. For western blotting, 50 μg protein was loaded per well. Fer-1: ferrostatin-1, SR sorafenib resistant. Values represent the mean ± SD (n = 3). The qRT-PCR data determined from three independent experiments. *p < 0.05, **p < 0.01, ***p < 0.001, Student’s t-test (two groups).
Fig. 5
Fig. 5. GSTZ1 knockout cells are insensitive to sorafenib-induced ferroptosis through the activation of NRF2.
AD Levels of iron (A, B), and MDA (C, D) were assayed. GSTZ1-OE cells were treated with sorafenib alone or in combination with tBHQ (100 μM for 3 h) (left). GSTZ1-KO cells were treated with sorafenib alone or in combination with Bru (40 nM for 24 h) (left). Expressing Flag-KEAP1 plasmid was transfected into GSTZ1-OE cells with sorafenib treatment (right). Expressing Myc-NRF2 plasmid was transfected into GSTZ1-KO cells with sorafenib treatment (right). E Representative images (top) and quantification (bottom) of ROS level in GSTZ1-OE cells treated with sorafenib alone or in combination with tBHQ (top) and GSTZ1-KO cells treated with sorafenib alone or in combination with Bru (bottom). Scale bar = 20 μm. F 4-HNE-induced protein modification was examined. For western blotting, 50 μg protein was loaded per well. tBHQ: tertiary butylhydroquinone, Bru brusatol, 4-HNE 4-hydroxy-2-nonenal. Values represent the mean ± SD (n = 3). *p < 0.05, **p < 0.01, ***p < 0.001, Student’s t-test (two groups).
Fig. 6
Fig. 6. RSL3 enhances the sensitivity of GSTZ1-KO and sorafenib-resistant cells to sorafenib.
A, B Morphological changes (A) and protein level (B) of ferroptosis-related genes. GSTZ1-OE SK-Hep1 cells were treated with sorafenib alone or in combination with tBHQ (top). GSTZ1-KO HepG2 cells were treated with sorafenib alone or in combination with Bru (bottom). Scale bar = 10 μm. CE Iron (C), MDA (D), and GSH (E) levels in GSTZ1-KO and sorafenib-resistant cells treated with sorafenib alone or in combination with RSL3 (500 nM for 24 h). F Cell growth curve of GSTZ1-KO and sorafenib-resistant cells treated with sorafenib alone or in combination with RSL3. RSL3: Ras-selective lethal small molecule 3, tBHQ tertiary butylhydroquinone, Bru brusatol, DMSO dimethyl sulfoxide, Sora sorafenib, MDA malondialdehyde. Values represent the mean ± SD (n = 3). *p < 0.05, **p < 0.01, ***p < 0.001, Student’s t-test (two groups).
Fig. 7
Fig. 7. RSL3 enhances the anticancer activity of sorafenib in Gstz1−/− mice.
A Schematic representation of the experimental design for mice. B Gross appearances of liver tumors. The red circles represent tumors. CE In vivo analyses of liver/body weight ratio (C), tumor numbers (D), and serum alanine aminotransferase (ALT) (E) levels of the five groups. (n = 6). FH Levels of iron (F) (n = 5), 4-HNE modification (G) (n = 3) and MDA (H) (n = 5) in mice were assayed. I, J mRNA (I) (n = 4) and protein (J) (n = 3) levels of GPX4, FTL, and SLC7A11 in the liver tumors as assessed using qRT-PCR and western blotting, respectively. K Representative H&E staining and immunohistochemistry images of GSTZ1, GPX4, and Ki67 in hepatic tumors. Scale bar = 50 μm. For western blotting, 50 μg protein was loaded per well. WT wild-type, DEN diethylnitrosamine, CCl4 carbon tetrachloride, DMSO dimethyl sulfoxide, Sora sorafenib, RSL3 Ras-selective lethal small molecule 3, ALT alanine aminotransferase, 4-HNE 4-hydroxy-2-nonenal, H&E hematoxylin and eosin. *p < 0.05, **p < 0.01, ***p < 0.001, Student’s t-test (two groups) or one-way ANOVA followed by Tukey’s tests (five groups).
Fig. 8
Fig. 8. A proposed model of the resistance of GSTZ1-deficient cells to sorafenib.
MAA maleylacetoacetate, FAA fumarylacetoacetate, Bru brusatol, ARE anti-oxidation response element, Fer-1 ferrostatin-1, HCC hepatocellular carcinoma.

References

    1. Bray F, et al. Global cancer statistics 2018: GLOBOCAN estimates of incidence and mortality worldwide for 36 cancers in 185 countries. CA. 2018;68:394–424. - PubMed
    1. Yang JD, et al. A global view of hepatocellular carcinoma: trends, risk, prevention and management. Nat. Rev. Gastroenterol. Hepatol. 2019;16:589–604. doi: 10.1038/s41575-019-0186-y. - DOI - PMC - PubMed
    1. Cheng A-L, et al. Efficacy and safety of sorafenib in patients in the Asia-Pacific region with advanced hepatocellular carcinoma: a phase III randomised, double-blind, placebo-controlled trial. Lancet Oncol. 2009;10:25–34. doi: 10.1016/S1470-2045(08)70285-7. - DOI - PubMed
    1. Raoul J-L, et al. Systemic therapy for intermediate and advanced hepatocellular carcinoma: Sorafenib and beyond. Cancer Treat. Rev. 2018;68:16–24. doi: 10.1016/j.ctrv.2018.05.006. - DOI - PubMed
    1. Dixon SJ, et al. Ferroptosis: an iron-dependent form of nonapoptotic cell death. Cell. 2012;149:1060–1072. doi: 10.1016/j.cell.2012.03.042. - DOI - PMC - PubMed

Publication types

MeSH terms