

Simulation of a flash-flood event over the Adriatic Sea with a high-resolution atmosphere-ocean-wave coupled system
- PMID: 33931687
- PMCID: PMC8087830
- DOI: 10.1038/s41598-021-88476-1
Simulation of a flash-flood event over the Adriatic Sea with a high-resolution atmosphere-ocean-wave coupled system
Erratum in
-
Author Correction: Simulation of a flash-flood event over the Adriatic Sea with a high-resolution atmosphere-ocean-wave coupled system.Sci Rep. 2025 May 23;15(1):17958. doi: 10.1038/s41598-025-00864-z. Sci Rep. 2025. PMID: 40410215 Free PMC article. No abstract available.
Abstract
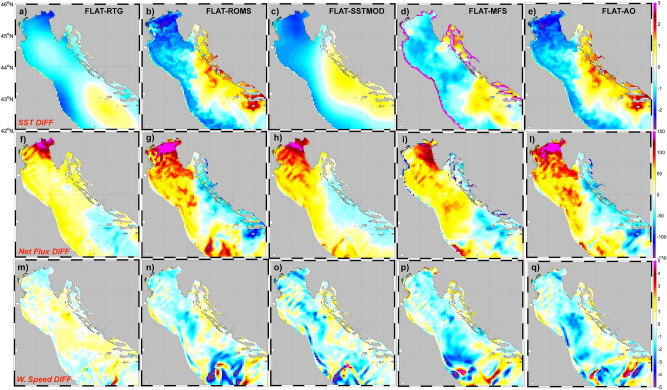
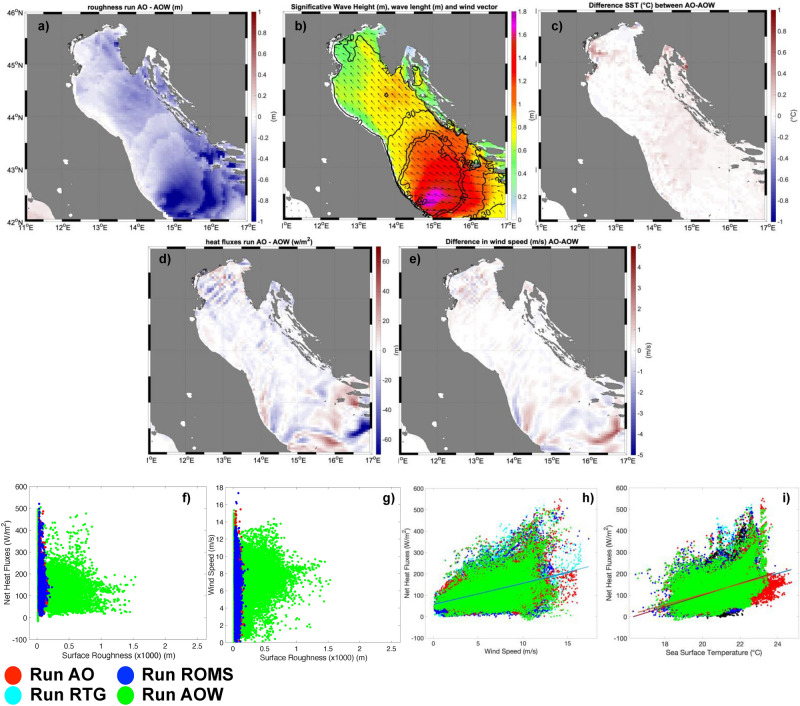
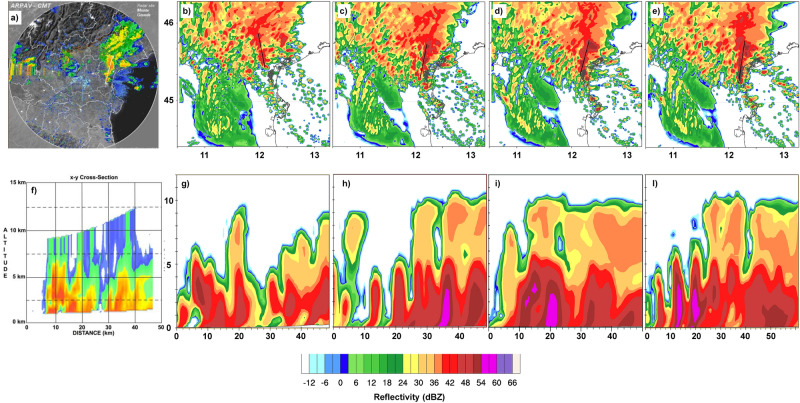
On the morning of September 26, 2007, a heavy precipitation event (HPE) affected the Venice lagoon and the neighbouring coastal zone of the Adriatic Sea, with 6-h accumulated rainfall summing up to about 360 mm in the area between the Venetian mainland, Padua and Chioggia. The event was triggered and maintained by the uplift over a convergence line between northeasterly flow from the Alps and southeasterly winds from the Adriatic Sea. Hindcast modelling experiments, using standalone atmospheric models, failed to capture the spatial distribution, maximum intensity and timing of the HPE. Here we analyze the event by means of an atmosphere-wave-ocean coupled numerical approach. The combined use of convection permitting models with grid spacing of 1 km, high-resolution sea surface temperature (SST) fields, and the consistent treatment of marine boundary layer fluxes in all the numerical model components are crucial to provide a realistic simulation of the event. Inaccurate representations of the SST affect the wind magnitude and, through this, the intensity, location and time evolution of the convergence zone, thus affecting the HPE prediction.
Conflict of interest statement
The authors declare no competing interests.
Figures


References
-
- Cassola, F., Ferrari, F., Mazzino, A. & Miglietta, M. M. The role of the sea on the flash floods events over Liguria (northwestern Italy). Geophys. Res. Lett.43(7), 3534–3542. 10.1002/2016GL068265 (2016).
-
- Meroni, A. N., Parodi, A. & Pasquero, C. Role of SST patterns on surface wind modulation of a heavy midlatitude precipitation event. J. Geophys. Res. Atmos.123, 9081–9096. 10.1029/2018JD028276 (2018).
-
- Duffourg, F. & Ducrocq, V. Origin of the moisture feeding the heavy precipitating systems over Southeastern France. Hazards Earth Syst. Sci.11, 1163–1178. 10.5194/nhess-11-1163-2011 (2011).
-
- Berthou, S. et al. Sensitivity of an intense rain event between atmosphere-only and atmosphere-ocean regional coupled models: 19 September 1996. Q. J. R. Meteorol. Soc.141(686), 258–271. 10.1002/qj.2355 (2015).
-
- LebeaupinBrossier, C. et al. Ocean mixed layer responses to intense meteorological events during HyMeX-SOP1 from a high-resolution ocean simulation. Ocean Model84, 84–103. 10.1016/J.OCEMOD.2014.09.009 (2014).
LinkOut - more resources
Full Text Sources
Other Literature Sources
