

doi: 10.1002/ctm2.357.
MicroRNAs from extracellular vesicles as a signature for Parkinson's disease
Affiliations
- PMID: 33931970
- PMCID: PMC8021010
- DOI: 10.1002/ctm2.357
Item in Clipboard
MicroRNAs from extracellular vesicles as a signature for Parkinson's disease
Clin Transl Med.
2021 Apr.
No abstract available
Conflict of interest statement
The authors declare no conflict of interest.
Figures
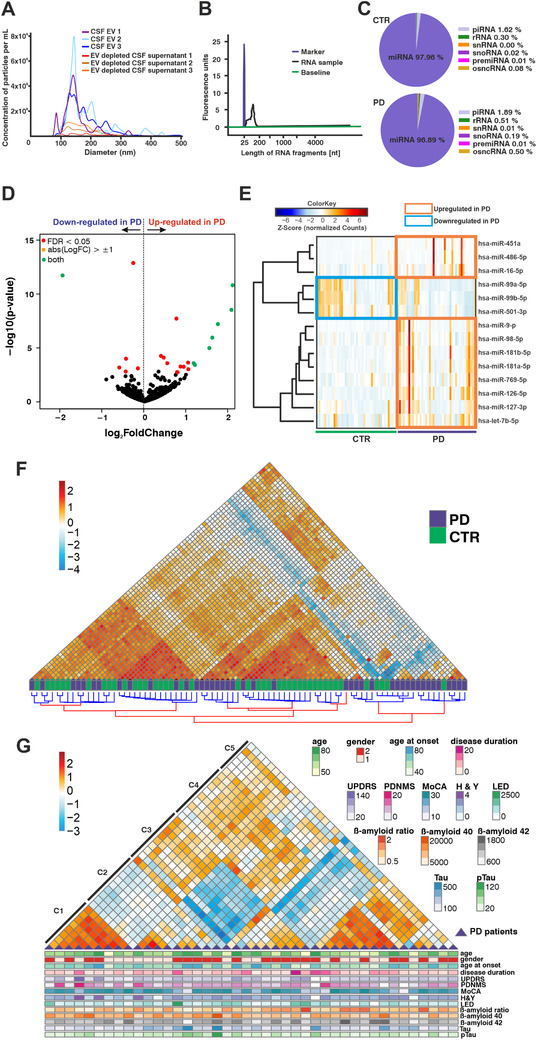
Small RNA sequencing from CSF EVs. (A) Size and particle distribution in EV‐enriched CSF and EV‐depleted supernatant fractions obtained with nanoparticle tracking analysis (NTA) after CSF ultracentrifugation. (B) Electropherogram showing the profile of RNA isolated from CSF extracellular vesicles. (C) Pie charts showing the average proportions of the different small RNA species in the small RNA libraries of CTR and PD subjects. (D) Volcano plot showing all detected miRNAs in the CSF of PD patients and CTR. Significantly different expressed miRNAs between CTR and PD are indicated in red (FDR < 0.05) and green (FDR < 0.05; log2FC > 1). (E) Heatmap with individual expression levels for significantly regulated miRNAs in the discovery cohort (PD, n = 42; CTR, n = 43). (F) Hierarchical clustering of PD patients and CTR subjects in the discovery cohort. Samples with similar miRNA expression profiles are located close to each other. (G) Unbiased hierarchical clustering of PD patients from the discovery cohort according to similar miRNA expression profiles, showing also the corresponding clinical parameters. CTR, control; PD, Parkinson's disease; CSF, cerebrospinal fluid; EVs, extracellular vesicles; NTA, nanoparticle tracking analysis; C1–C5, distinct PD sample clusters; sex: 1 = female, 2 = male; age, age at onset and disease duration given in years; UPDRS, Movement Disorders Society‐Unified Parkinson's Disease Rating Scale; PDNMS, Parkinson's Disease Non‐Motor Scale; MoCA, Montreal Cognitive Assessment; H&Y, modified Hoehn & Yahr stage; LED, levodopa equivalent dose in mg; beta‐amyloid‐(1‐40) and beta‐amyloid‐(1‐42) in pg/mL; beta‐amyloid ratio: beta‐amyloid‐(1‐42)/beta‐amyloid‐(1‐40) × 10; Tau in pg/mL; pTau: phosphorylated (181) Tau in pg/mL
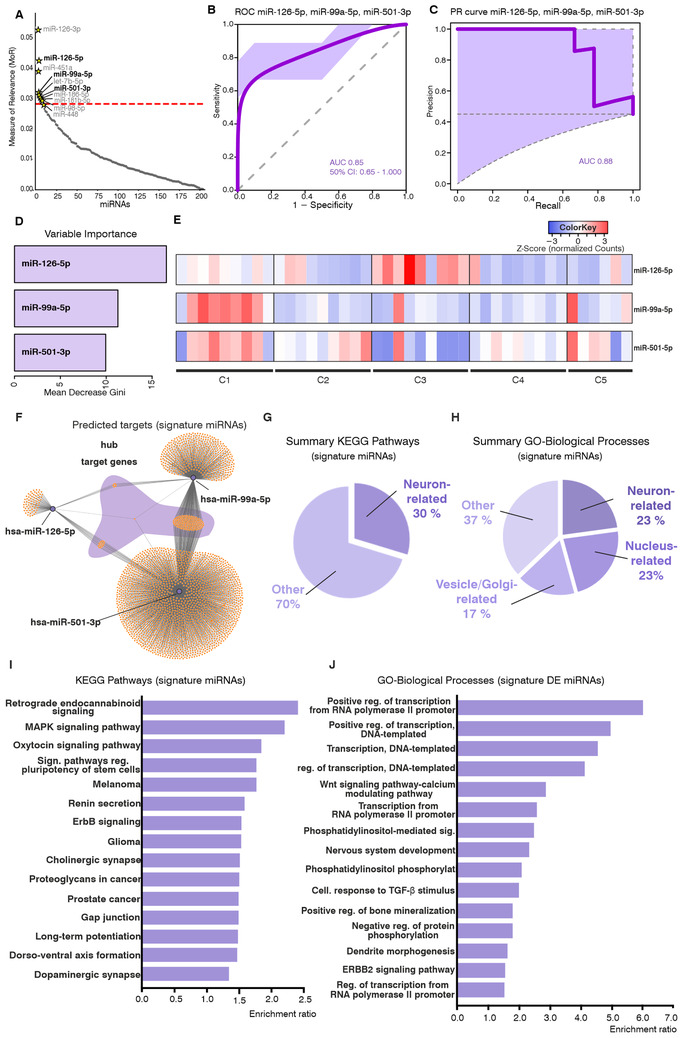
A miRNA signature identified in PD CSF. (A) MoR analysis for identification of relevant miRNAs that discriminate between PD and CTR in the discovery cohort (PD, n = 42; CTR, n = 43). The red line indicates the critical MoR value cutoff. miRNAs located above this line are considered relevant. The light‐gray miRNAs were excluded after mean score filtering in the feature selection procedure. The combination of miRNAs that was tested to discriminate PD and CTR subjects in an independent validation cohort is indicated in bold black lettering (miR‐126‐5p, miR‐99a‐5p, and miR‐501‐3p). (B) ROC curve showing the performance of the three signature miRNAs for the discrimination of PD and CTR subjects in an independent validation cohort (PD, n = 9; CTR, n = 11). Training of the model was performed on the discovery cohort with a 10‐fold cross‐validation. The lilac area indicates the 50% confidence interval; an AUC of 0.85 was obtained. (C) Precision–recall curve for the performance of the three signature miRNAs in the validation cohort with an AUC of 0.88. (D) Variable importance indicated by the mean decrease in Gini showing the relevance of the individual miRNAs in the signature. (E) Heatmap showing individual expression levels for the three signature miRNAs in the distinct PD sub‐clusters from the discovery cohort, identified by unbiased hierarchical clustering (PD, n = 42). (F–J) Differential expression and target‐gene functional annotation results for CSF small RNA sequencing. (F) Predicted targets for signature miRNAs. Hub target genes common to the three miRNAs are highlighted by the shadowing in purple. (G) Summary of enriched KEGG pathways and (H) GO‐cellular compartment categories in the functional annotation for predicted targets of the signature miRNAs. Neuron‐related pathways are enriched in the dataset. (I) Top‐15 KEGG pathways and (J) GO‐biological processes terms enriched for the predicted targets of the signature miRNAs. Bars represent the enrichment ratio results from the WEBGESTALT algorithm. CTR, control; PD, Parkinson's disease; MoR, measure of relevance; ROC, receiver operatin characteristic; AUC, area under the curve; C1–C5, distinct PD sample clusters; CSF, cerebrospinal fluid; GO, gene ontology; KEGG, Kyoto Encyclopedia of Genes and Genomes; FDR, false discovery rate
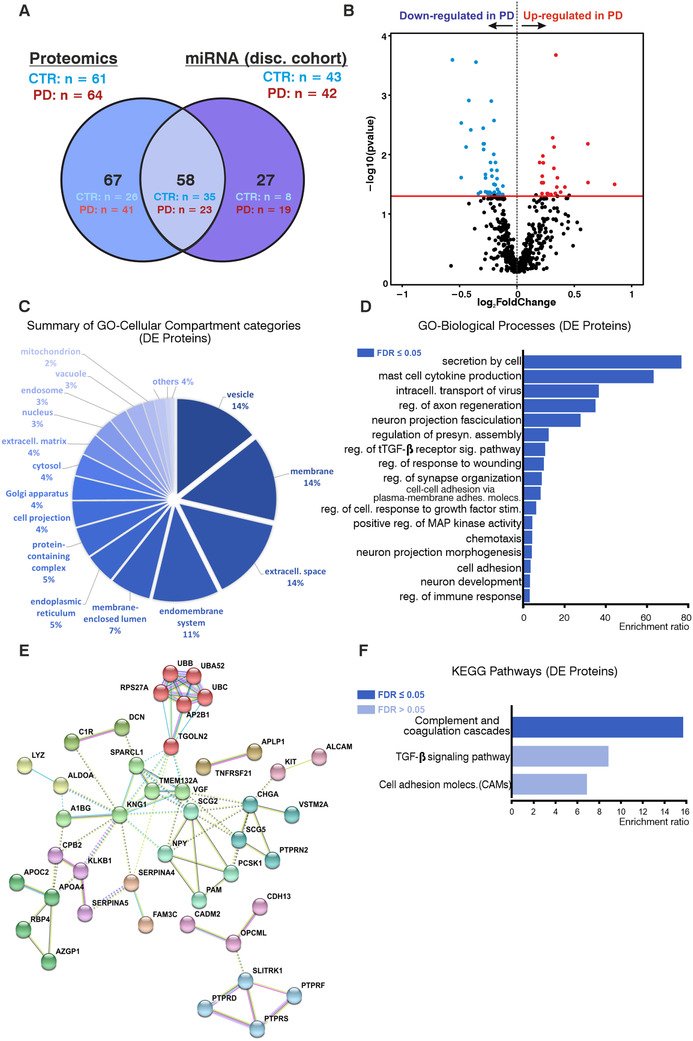
Proteomics analysis with CSF of PD and CTR subjects. (A) Venn diagram indicating the intersection between the discovery cohort from the small RNA sequencing (miRNA) studies and the subgroup of subjects analyzed by proteomics. Stratification of subjects: discovery cohort small RNA sequencing: PD, n = 42; CTR, n = 43. Proteomics: PD, n = 64; CTR, n = 61. (B) Volcano plot showing all detected proteins in the total CSF of PD patients and CTR. Differentially expressed proteins between CTR and PD are indicated in blue (downregulated in PD) and red (upregulated in PD) (FDR < 0.05). (C) Summary of enriched GO‐cellular compartment categories in the functional annotation for differentially expressed proteins. (D) Enriched GO‐biological process categories and (E) KEGG pathways in the functional annotation of differentially expressed proteins. Bars represent enrichment ratio results from the WEBGESTALT algorithm. (F) STRING analysis for the differentially expressed proteins. Clusters defined by the Markov Cluster Algorithm in STRING using default parameters. CSF, cerebrospinal fluid; PD, Parkinson disease; CTR, control subjects; GO, Gene Ontology; KEGG, Kyoto Encyclopedia of Genes and Genomes
References
-
- Schlossmacher MG, Mollenhauer B. Biomarker research in Parkinson's disease: objective measures needed for patient stratification in future cause‐directed trials. Biomarkers Med. 2010;4:647‐650. - PubMed
-
- Saba R, Schratt GM. MicroRNAs in neuronal development, function and dysfunction. Brain Res. 2010;1338:3‐13. - PubMed
-
- Yagi Y, Ohkubo T, Kawaji H, et al. Next‐generation sequencing‐based small RNA profiling of cerebrospinal fluid exosomes. Neurosci Lett. 2017;636:48‐57. - PubMed
Publication types
MeSH terms
Substances
LinkOut - more resources
Full Text Sources
Other Literature Sources
Medical
Molecular Biology Databases