

TFG binds LC3C to regulate ULK1 localization and autophagosome formation
- PMID: 33932238
- PMCID: PMC8126910
- DOI: 10.15252/embj.2019103563
TFG binds LC3C to regulate ULK1 localization and autophagosome formation
Abstract
The early secretory pathway and autophagy are two essential and evolutionarily conserved endomembrane processes that are finely interlinked. Although growing evidence suggests that intracellular trafficking is important for autophagosome biogenesis, the molecular regulatory network involved is still not fully defined. In this study, we demonstrate a crucial effect of the COPII vesicle-related protein TFG (Trk-fused gene) on ULK1 puncta number and localization during autophagy induction. This, in turn, affects formation of the isolation membrane, as well as the correct dynamics of association between LC3B and early ATG proteins, leading to the proper formation of both omegasomes and autophagosomes. Consistently, fibroblasts derived from a hereditary spastic paraparesis (HSP) patient carrying mutated TFG (R106C) show defects in both autophagy and ULK1 puncta accumulation. In addition, we demonstrate that TFG activity in autophagy depends on its interaction with the ATG8 protein LC3C through a canonical LIR motif, thereby favouring LC3C-ULK1 binding. Altogether, our results uncover a link between TFG and autophagy and identify TFG as a molecular scaffold linking the early secretion pathway to autophagy.
Keywords: ERGIC; LC3C; TFG; autophagy.
© 2021 The Authors. Published under the terms of the CC BY NC ND 4.0 license.
Conflict of interest statement
The authors declare that they have no conflict of interest.
Figures
- A
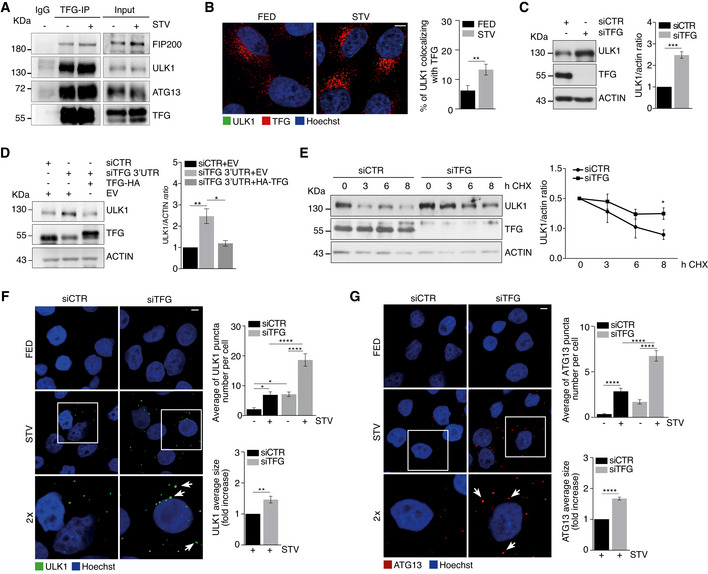
HeLa cells were cultured in complete growth or starvation (STV) media for 30’. Cell lysates were immunoprecipitated (IP) with anti‐TFG antibody or IgG as a negative control. Immunoprecipitated complexes were analysed by WB to detect TFG, ULK1, ATG13 and FIP200 as indicated.
- B
HeLa cells were cultured in complete growth (FED) or starvation (STV) media for 1 h. Cells were fixed, permeabilized and labelled with anti‐TFG (red) and anti‐ULK1 (green) antibodies, respectively. Hoechst was used to stain nuclei. Co‐localization analysis was performed by ImageJ plugin Jacop and reported in the graph (right). Values of Mander’s coefficient for ULK1 are expressed as mean ± SEM. Significance was assigned by unpaired Student’s t‐test. **P < 0.01 (n = 3 independent experiments, n = 12 fields analysed). Scale bar 5 μm.
- C
HeLa cells were transfected with specific RNAi oligonucleotides (siTFG) or unrelated oligonucleotides as a negative control (siCTR) for 48 h. Protein extracts were analysed by WB to detect ULK1, TFG and ACTIN as indicated. Densitometry analysis of ULK1 over ACTIN is shown (right). All values are mean ± SEM. Statistical analyses were performed by two‐tailed Student’s t‐test. ***P < 0.001 (n = 3 independent experiments).
- D
HeLa cells were co‐transfected with control siRNA and an empty vector (EV), or 3’UTR TFG siRNA together with an EV or HA‐TFG plasmids. Protein extracts were analysed by WB to detect ULK1, TFG and ACTIN as indicated. Densitometry analysis of ULK1 protein levels normalized over ACTIN is also reported (right). All values are expressed as the mean ± SEM. Statistical analyses were performed by one‐way ANOVA followed by Tukey’s multiple comparison test. *P < 0.05 and **P < 0.01 (n = 3 independent experiments).
- E
HeLa cells were transfected as in C), grown in the presence or not of cycloheximide (CHX) for indicated time periods. Protein extracts were analysed by WB to detect ULK1, TFG and ACTIN as indicated. Densitometry analysis of ULK1 normalized over ACTIN is also shown (right). Values are mean ± SEM Statistical analyses were performed by multiple t‐test. *P < 0.05 (n = 3 independent experiments).
- F, G
HeLa cells were treated as in B) and then fixed and stained with ULK1 (green) (F) or ATG13 (red) antibodies (G), respectively. Hoechst was used to stain nuclei. Graphs (right) show the average of both ULK1 (F) (n = 3 independent experiments, n = 11 fields analysed) and ATG13 (n = 3 independent experiments, n ≥ 16 fields analysed) (G) puncta number per cell and both ULK1 (n = 3 independent experiments) (F) and ATG13 (n = 3 independent experiments) (G) fold of increase of the average size, respectively. White arrows indicate most representative puncta of analysed conditions. All data are reported as the mean value ± SEM. Statistical analyses were performed by two‐way ANOVA followed by Tukey’s multiple comparison test. *P < 0.05 and ****P < 0.0001 or by unpaired Student’s t‐test when two groups were compared. **P < 0.01 and ****P < 0.0001. Scale bar 5 μm.
- A
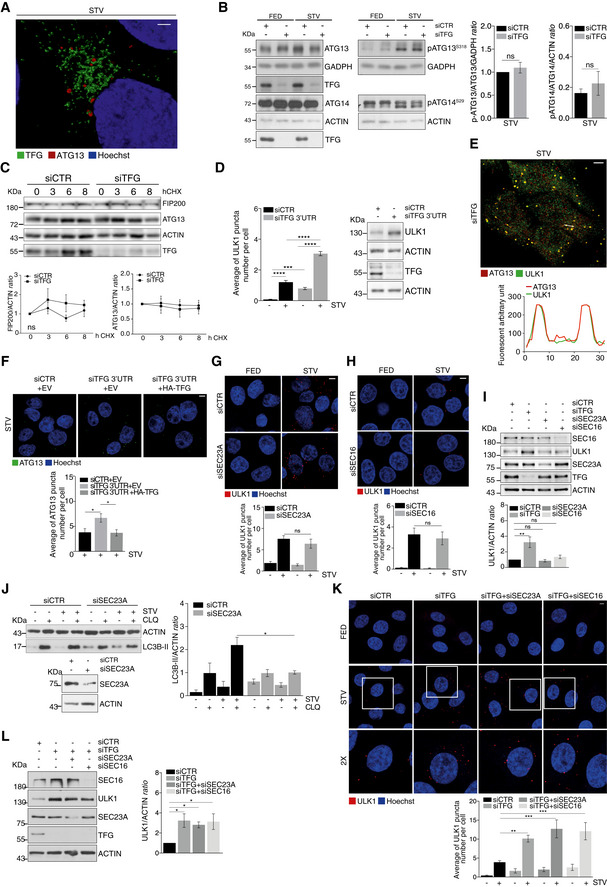
HeLa cells were grown for 1 h in starvation (STV) medium, then fixed, permeabilized and stained with TFG (green) and ATG13 (red). Hoechst was used to stain nuclei. Representative micrograph is reported. Scale bar 2 μm.
- B
HeLa cells were transfected with the indicated siRNAs and grown in nutrient complete (FED) or starvation (STV) media for 1 h. Protein extracts were analysed by WB to detect p‐ATG13, ATG13, GADPH, p‐ATG14, ATG14, ACTIN and TFG protein levels. Densitometry analysis representing p‐ATG13/ATG13 normalized over GADPH and p‐ATG14/ATG14 normalized over ACTIN of starved samples of both the conditions analysed was also reported. All data are expressed as mean ± SEM. Statistical analyses were obtained by unpaired Student’s t‐test. ns, not significant (n = 3 independent experiments).
- C
HeLa cells were transfected with the indicated siRNAs and grown in the presence or not of cycloheximide (CHX) for indicated time periods. Protein extracts were analysed by WB to detect FIP200, ATG13, TFG and ACTIN. Densitometry analysis of FIP200 over ACTIN (bottom left) and ATG13 over ACTIN (bottom right) is also displayed. Values are mean ± SEM. Statistical analyses were performed by multiple t‐test. ns, not significant (n = 4 independent experiments).
- D
Quantification of ULK1 puncta in HeLa cells transfected with the indicated siRNAs and cultured in complete growth or starvation (STV) media for 1 h is shown. TFG downregulation and ULK1 protein levels were analysed by WB as reported. All data are expressed as mean ± SEM. Statistical analysis was obtained by two‐way ANOVA followed by Tukey’s multiple comparison test ***P < 0.001 and ****P < 0.0001 (n = 3 independent experiments).
- E
HeLa cells were grown for 1 h in starvation (STV) medium, then fixed, permeabilized and stained with ATG13 (red) and ULK1 (green). Hoechst was used to stain nuclei. Representative micrograph and fluorescence plot are reported. Scale bar 5 μm.
- F
HeLa cells were co‐transfected with control siRNA and an empty vector (EV), or 3’UTR TFG siRNA together with an EV or HA‐TFG plasmids. Cells were grown for 1 h in starvation medium, then fixed, permeabilized and labelled with anti‐ATG13 (green) antibody. Hoechst was used to stain nuclei. The average of ATG13 puncta number per cell is reported (bottom). All data are expressed as mean ± SEM. Statistical analysis was obtained by two‐way ANOVA followed by Tukey’s multiple comparison test. *P < 0.05 (n = 3 independent experiments, n ≥ 13 fields analysed). Scale bars 5 μm.
- G, H
HeLa cells were transfected with SEC23A and SEC16 siRNAs (siSEC23A) and (siSEC16), respectively. Cells were cultured with nutrient complete medium (FED) or starvation medium (STV) for 1 h. HeLa cells were fixed, permeabilized and stained with ULK1 (red) antibody. Hoechst was used to stain nuclei. Graphs reporting the average of ULK1 puncta number per cell for the indicated conditions are shown (bottom) (n = 3 independent experiments, n ≥ 6 fields analysed for G; n = 3 independent experiments, n ≥ 9 fields analysed for H). Scale bars 5 μm. All values are expressed as the mean ± SEM. Statistics were performed by two‐way ANOVA followed by Tukey’s multiple comparison test. ns, not significant.
- I
HeLa cells were transfected with indicated siRNAs. Protein extracts were analysed by WB to detect SEC16, ULK1, SEC23, TFG and ACTIN protein levels. Quantification of ULK1 over ACTIN is reported in the graph (right). Data are mean ± SEM. Statistics were performed by one‐way ANOVA followed by Tukey’s multiple comparison test. **P < 0.01 and ns, not significant (n = 3 independent experiments).
- J
HeLa cells were transiently transfected with the indicated siRNAs and grown in complete or starvation (STV) media, in the presence or absence of CLQ for 1 h. Protein extracts were analysed by WB to detect LC3B‐II and ACTIN protein levels and SEC23A downregulation as indicated. Densitometry analysis of LC3B‐II normalized over ACTIN is reported (right). All data are reported as mean ± SEM. Significance was assigned by two‐way ANOVA followed by Tukey’s multiple comparison test. *P < 0.05 (n = 3 independent experiments).
- K
HeLa cells were transfected with indicated siRNAs, fixed and immunolabelled with ULK1 (red) antibody. Hoechst was used to stain nuclei. ULK1 puncta number was quantitated and reported in the graph (bottom). All data are mean ± SEM. Statistics were performed by two‐way ANOVA followed by Tukey’s multiple comparison test. **P < 0.01; ***P < 0.001 (n = 3 independent experiments, n ≥ 7 fields analysed). Scale bar 5 μm.
- L
HeLa cells were transfected with indicated siRNAs. Protein extracts were analysed by WB for indicated antibodies. ULK1 over ACTIN protein levels is reported in the graph (right). All values are expressed as the mean ± SEM. Statistics were performed by one‐way ANOVA followed by Dunnett’s multiple comparison test. *P < 0.05 (n = 3 independent experiments).
- A–D
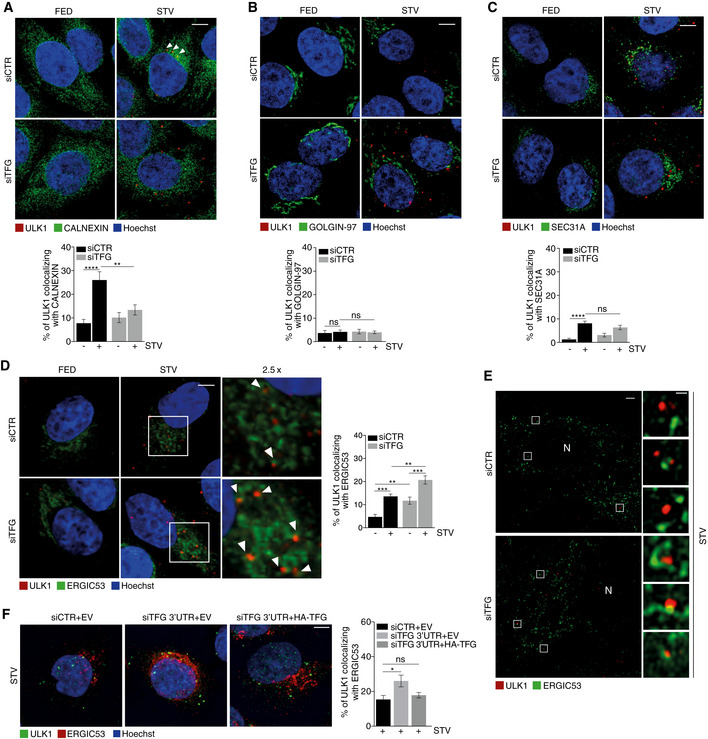
HeLa cells were transfected with specific RNAi oligonucleotides (siTFG) or unrelated oligonucleotides as a negative control (siCTR) and grown in fed or starved conditions for 1 h. Cells were fixed and co‐labelled with ULK1 (red) antibody and (A) anti‐CALNEXIN (green) antibody to highlight ER structures (n = 3 independent experiments, n ≥ 16 fields analysed), (B) GOLGIN‐97 (green) antibody to label GOLGI complex (n = 3 independent experiments, n = 12 fields analysed), (C) SEC31A (green) to point out COPII vesicles (n = 3 independent experiments, n ≥ 16 fields analysed) and (D) ERGIC53 (green) to mark ERGIC compartment (n = 3 independent experiments, n ≥ 14 fields analysed). Analysis of ULK1 localization with each compartment is reported in each graph. Co‐localization analyses were performed by ImageJ plugin Jacop. Values of Mander’s coefficient for ULK1 are expressed in percentage as mean ± SEM. Statistical analyses were performed by two‐way ANOVA followed by Tukey’s multiple comparison test. **P < 0.01; ***P < 0.001; ****P < 0.0001; and ns, not significant. Scale bars 5 μm. White arrowheads point at ULK1 puncta associated with the analysed markers.
- E
HeLa cells were transfected as in A), labelled with the indicated antibodies and imaged by SIM microscope. Scale bar in large panels, 5 μm; in small panels, 1 μm. N, nucleus.
- F
HeLa cells were co‐transfected with control siRNA and an empty vector (EV), or 3’UTR TFG siRNA together with an EV or HA‐TFG plasmids. Cells grown for 1 h in starvation medium then fixed, permeabilized and labelled with anti‐ULK1 (green) and anti‐ERGIC53 (red) antibodies, respectively. Hoechst was used to stain nuclei. Co‐localization analysis was performed as in D). Values of Mander’s coefficient for ULK1, expressed as percentage, are mean ± SEM. Statistical analyses were performed by one‐way ANOVA followed by Dunnett’s multiple comparison test. *P < 0.05; ns, not significant (n = 3) (n = 3 independent experiments, n ≥ 9 fields analysed). Scale bar 5 μm.
- A
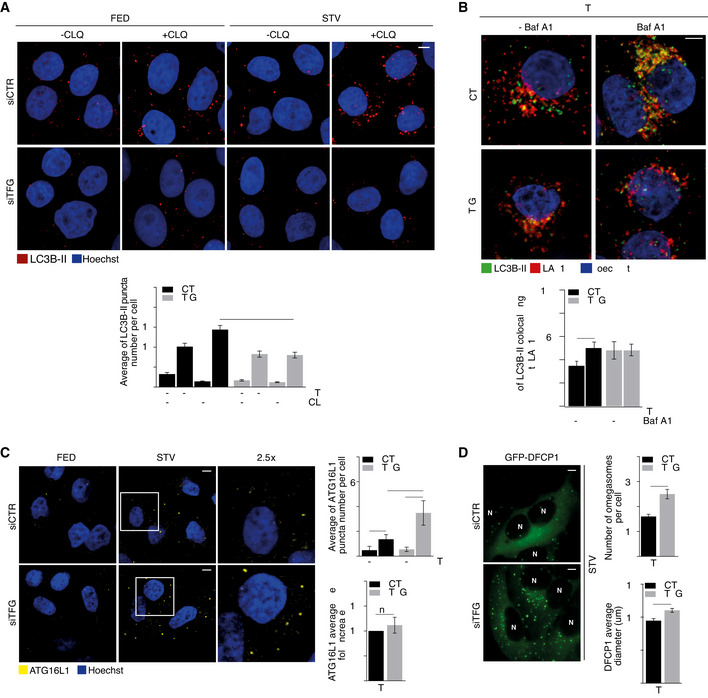
HeLa cells were transfected with specific RNAi oligonucleotides (siTFG) or unrelated oligonucleotides as a negative control (siCTR) and grown in fed (FED) or starvation conditions (STV) in the presence or absence of CLQ for 1 h. Cells were then fixed and stained using LC3B‐II (red) antibody. Analysis of LC3B‐II puncta number is reported (bottom). All data are expressed as the mean value ± SEM. Statistical analysis were performed by two‐way ANOVA followed by Tukey’s multiple comparison test. ****P < 0.0001 (n = 4 independent experiments, n ≥ 25 fields analysed). Scale bar 5 μm.
- B
HeLa cells were transfected as in A) and cultured in starvation conditions (STV) in the presence or absence of bafilomycin A1 (Baf A1) for 1 h. Cells were then fixed and stained using LC3B‐II (green) and LAMP1 (red) antibodies. Hoechst was used to mark nuclei. Co‐localization analyses were performed by ImageJ plugin Jacop. Values of Mander’s coefficient for LC3B‐II are expressed as mean ± SEM. Statistical analysis were performed by two‐way ANOVA followed by Tukey’s multiple comparison test. *P < 0.05 (n = 3 independent experiments, n ≥ 13 fields analysed). Scale bar 5 μm.
- C
HeLa cells were transfected as in A) and grown in fed (FED) or starvation conditions (STV) for 1 h. Cells were then fixed and stained using ATG16L1 (yellow) antibody. ATG16L1 puncta number (upper right) and the average size of ATG16L1 as fold increase (bottom right) were reported. All values are expressed as mean ± SEM. Statistical analyses were performed by two‐way ANOVA followed by Tukey’s multiple comparison test. **P < 0.01 and ****P < 0.0001 or by unpaired Student’s t‐test when two groups were compared. ns, not significant (n = 3 independent experiments, n ≥ 9 fields analysed). Scale bar 5 μm.
- D
HEK293 cells stably expressing GFP‐DFCP1 were transfected as in A) and cultured in starved conditions for 40’. Cells were visualized with cellSens microscope for live‐cell imaging. Pictures show the images taken at the same number of frames for each video. Analyses of the number of DFCP1 structures per cell (upper right) and the mean of omegasomes structures diameter (μm) (bottom right) were reported. N, nucleus. All values are expressed as mean ± SEM. Statistical analyses were performed by unpaired Student’s t‐test. *P < 0.05 and ***P < 0.001 (n = 3 independent experiments). Scale bar 5 μm.
- A
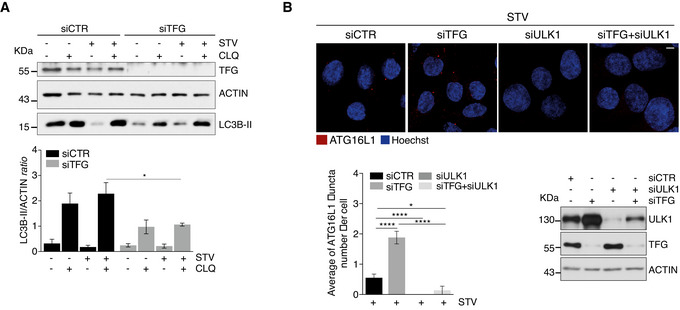
HeLa cells were transfected with indicated siRNAs and cultured in fed or starvation conditions (STV) in the presence or absence of CLQ for 1 h. Protein extracts were analysed by WB for the expression of TFG, ACTIN and LC3B‐II. Densitometry analysis of LC3B‐II over ACTIN is shown (bottom). Values are expressed as mean ± SEM. Statistical analysis was performed by Tukey’s multiple comparison test. *P < 0.05 (n = 3 independent experiments).
- B
HeLa cells were transfected with indicated siRNAs. Cells were then cultured in starvation medium for 1 h, fixed and immunolabelled with ATG16L1 (red) antibody. Hoechst was used to stain nuclei. Analysis of ATG16L1 puncta is reported in the graph (bottom left). Values are expressed as mean ± SEM. Statistical analysis was performed by one‐way ANOVA followed by Tukey’s multiple comparison test. *P < 0.05 and ****P < 0.0001. Scale bar 5 μm (n = 5 independent experiments). WB analysis to detect ULK1 and TFG downregulations is also shown (bottom right).
- A
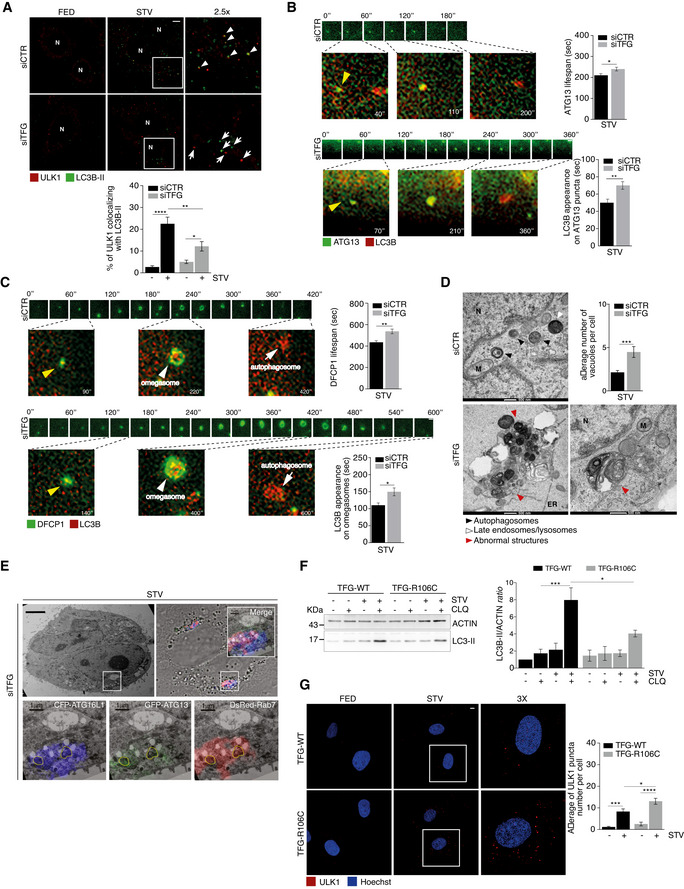
HeLa cells were transfected with specific RNAi oligonucleotides (siTFG) or unrelated oligonucleotides as a negative control (siCTR); after culturing cells in fed (FED) or starvation conditions (STV) for 1 h, cells were fixed and labelled with the indicated antibodies. Co‐localization analysis was performed by using ImageJ Jacop plugin and mean ± SEM of Mander’s coefficients of ULK1, expressed as percentage, is reported (bottom). White arrowheads point at co‐localization events between ULK1 and LC3B‐II; white arrows track puncta not co‐localizing; N, nucleus. Statistical analyses were performed by two‐way ANOVA followed by Tukey’s multiple comparison test. *P < 0.05; **P < 0.01; and ****P < 0.0001 (n = 3 independent experiments, n ≥ 16 fields analysed). Scale bar 5 μm.
- B, C
HEK293 cells stably expressing either GFP‐ATG13 (B) or GFP‐DFCP1 (C) were transiently transfected with specific RNAi oligonucleotides (siTFG) or unrelated oligonucleotides as a negative control (siCTR), together with CFP‐LC3B plasmid (visualized in red) and cultured in starved conditions for 40’. Wide‐field live‐cell imaging of starved cells was taken by cellSens microscope. Representative images of lifespan of both ATG13 (B) and (C) are reported. Images of both ATG13 (B) and DFCP1 (C) forming association with LC3B are also shown. The appearance of LC3B on ATG13 (B) (bottom right) and on DFCP1 (bottom right) (C) puncta was quantified and reported. All values are expressed in seconds (s) as mean ± SEM. Yellow arrowheads point at the DFCP1 and LC3B particles in the first frame from their onset, and white arrowheads and white arrows show omegasomes and autophagosomes as indicated. Statistical analyses were performed by unpaired Student’s t‐test. *P < 0.05 and **P < 0.01 (n = 3 independent experiments, n = 50 events/condition analysed). Scale bar 1 μm.
- D
HeLa cells were transfected as in A). Cells were imaged by TEM. Representative electron micrographs (x26500) are reported. The average number of abnormal structures per cell is shown (bottom graph). N, nucleus; M, mitochondria; and ER, endoplasmic reticulum. The average number of abnormal vacuoles per cell was evaluated (upper right). Statistical analysis was performed by unpaired Student’s t‐test. ***P < 0.001. A minimum of 50 cells were observed. Cell count was performed (n = 3 independent experiments, n ≥ 51 cells analysed). Data are presented as mean ± SEM. Scale bar 500 nm as indicated.
- E
HeLa cells stably expressing GFP‐ATG13 and CFP‐ATG16 were transiently co‐transfected with DsRed‐Rab7 and TFG siRNA (siTFG). Cells were cultured in starved conditions for 1 h. Representative electron micrographs (x3900) and merge of the three fluorophores CLEM are shown. Micrographs at higher magnification (x13500) of a region showing the three fluorophores split and merged are reported. Scale bars: 5 μm upper panels, 1 μm bottom panels.
- F
Control (TFG‐WT) and patient’s (TFG‐R106C) fibroblasts were grown in fed or starvation conditions in the presence or absence of CLQ for 1 h and then lysed. Protein extracts were analysed by WB to detect ACTIN and LC3B‐II as indicated. Densitometry analysis of LC3B‐II over ACTIN is shown (right). All data are expressed as the mean ± SEM. Statistical analysis was performed by two‐way ANOVA followed by Tukey’s multiple comparison test. *P < 0.05 and ***P < 0.001 (n = 3 independent experiments).
- G
Control (TFG‐WT) and patient’s (TFG‐R106C) fibroblasts were grown in fed or starvation conditions for 1 h. Cells were fixed, permeabilized and labelled with anti‐ULK (red) antibody. Hoechst was used to stain nuclei. The average of ULK1 puncta number per cell is shown (right). All data are expressed as the mean value ± SEM. Statistical analysis was performed by two‐way ANOVA followed by Tukey’s multiple comparison test. *P < 0.05; ***P < 0.001; and ****P < 0.0001 (n = 3 independent experiments, n ≥ 14 fields analysed). Scale bar 5 μm.
- A
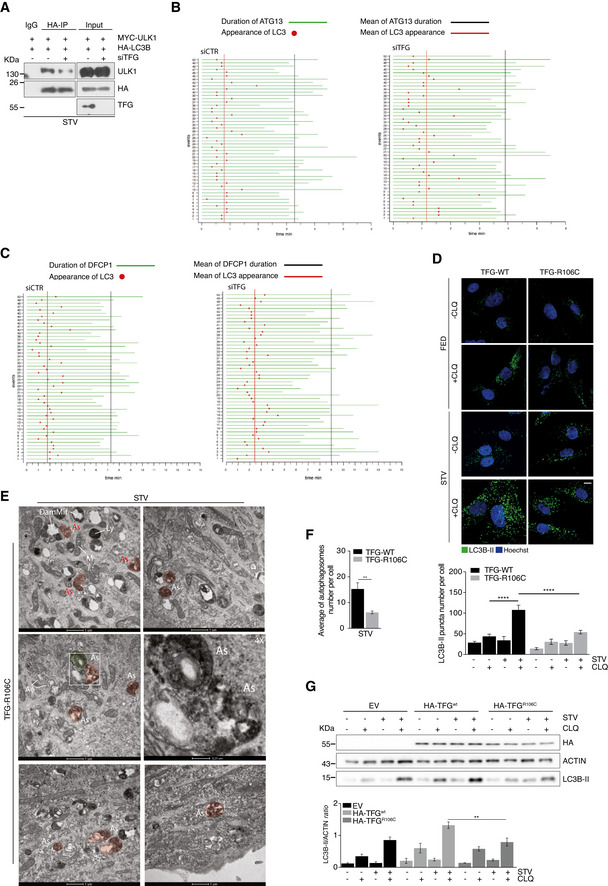
HeLa cells were co‐transfected with TFG or control siRNA together with vectors encoding for Myc‐ULK1 and HA‐LC3B. After 30’ of starvation, cells were lysed, and protein extracts were immunoprecipitated by using an anti‐HA antibody or IgG as negative control. ULK1 LC3B and TFG protein levels were analysed by WB.
- B, C
Temporal relationship of LC3B and ATG13 (B) or LC3B and DFCP1 (C). Starved HEK293 cells stably expressing GFP‐ATG13 or GFP‐DFCP1 together with CFP‐LC3B were analysed by live‐cell imaging. 50 unique events showing the moment at which LC3 appears on ATG13 (B) or DFCP1 (C) (red point) are reported; green lines depict the lifespan of ATG13 particles (B) or DFCP1 structures (C), respectively (n = 3 independent experiments, n = 50 events analysed).
- D
Control (TFG‐WT) and patient’s fibroblasts (TFG‐R106C) were grown in fed or starvation conditions in the presence or absence of CLQ for 1 h. Cells were fixed permeabilized and labelled with LC3B‐II antibody. Hoechst was used to stain nuclei. LC3B‐II puncta number was analysed (bottom). Data are expressed as the mean value ± SEM. Statistical analysis was performed by two‐way ANOVA followed by Tukey’s multiple comparison test. ****P < 0.0001 (n = 5 independent experiments). Scale bar 5 μm.
- E
Patient’s fibroblasts (TFG‐R106C) were cultured in STV medium for 1 h. Cells were processed and imaged by TEM. Representative electron micrographs are reported. AΦ, autophagosome; As, abnormal structures; M, mitochondrion; DamMit, damaged mitochondrion; and Ly, lysosome. Scale bar 1 μm or 0,25 μm as indicated.
- F
Quantification of the autophagosomes number per cell in control (TFG‐WT) and patient’s fibroblasts (TFG‐R106C) grown in starvation (STV) conditions is shown. Data are expressed as the mean value ± SEM. Statistical analysis were performed by unpaired Student’s t‐test. **P < 0.01. A minimum of 10 cells for condition were observed (n = 3 independent experiments, n ≥ 10 cells/condition analysed).
- G
HeLa cells were transfected with an empty vector (EV) or HA‐TFGwt, or HA‐TFGR106C and grown in fed or starvation conditions (STV) in the presence or absence of CLQ for 1 h. Protein extracts were analysed by WB to detect HA‐TFG ACTIN and LC3B‐II as indicated. Densitometry analysis of LC3B‐II over ACTIN is shown (bottom). All data are expressed as the mean ± SEM. Statistical analysis was performed by two‐way ANOVA followed by Tukey’s multiple comparison test. **P < 0.01 (n = 3 independent experiments).
- A
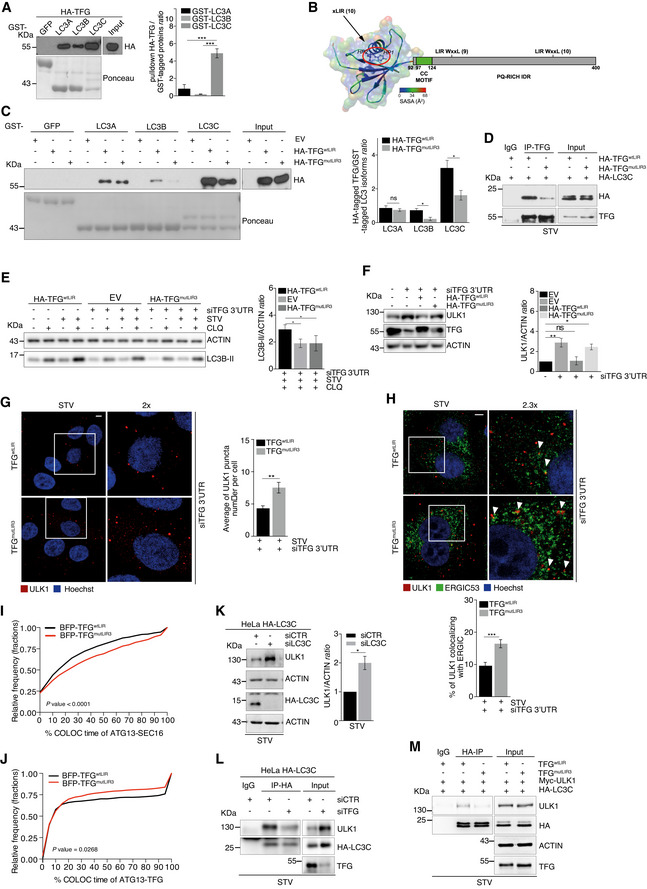
Pulldown assay was performed incubating purified GST‐tagged LC3 (A, B and C) isoforms and HA‐TFG‐transfected HeLa cell lysates. HA‐TFG protein levels were analysed by WB; LC3 isoforms and GFP are shown in the Ponceau staining. Densitometry analysis of TFG over GST‐tagged LC3 isoforms is reported in the graph (right). Data are expressed as mean ± SEM. Statistical analysis was performed by one‐way ANOVA followed by Tukey’s multiple comparison test. ***P < 0.001 (n = 3 independent experiments).
- B
The model illustrates the domain composition of TFG, including a PB1 domain (residues 10–91), a coiled‐coil motif (CC, residues 97–124) and a C‐terminal region including a proline–glutamine‐rich mostly disordered region. The location of the predicted LIR motifs is also reported, along with the associated PSSM scores from iLIR. The model of the 3D structure of the PB1 domain is coloured according to the solvent accessibility of each residue as derived by Chimera, and the residues for the predicted LIR motif 31–36 for HP1 and HP2 hydrophobic pockets of LC3 proteins are highlighted as sticks.
- C
Pulldown assays were performed by using purified GST‐LC3 (A, B and C) isoforms, each incubated together with empty vector (EV) or HA‐TFGwtLIR‐ or HA‐TFGmutLIR3‐transfected HeLa cell lysates, respectively. Ponceau staining reports GST‐LC3 isoforms and GST‐GFP used as a negative control. WB analyses show HA‐TFGwtLIR or HA‐TFGmutLIR3 in the pulldown and in total extracts (Input). Densitometry analyses of HA‐tagged TFG normalized over GST‐tagged LC3 isoforms (Ponceau) were performed and reported (right). Data are mean value ± SEM. Statistical analysis was performed by multiple t‐test. *P < 0.05 and ns, not significant (n = 3 independent experiments).
- D
HeLa cells were co‐transfected with HA‐LC3C together with HA‐TFGwtLIR or HA‐TFGmutLIR3 plasmids. After 30’ of starvation, protein extracts were immunoprecipitated using an anti‐TFG antibody or IgG as a negative control. LC3C and TFG were analysed by WB.
- E
HeLa cells were co‐transfected with 3’UTR TFG siRNA together with HA‐TFGwtLIR or an empty vector (EV) or TFGmutLIR3 plasmids, expressed at near endogenous levels. Cells were cultured with complete or starvation (STV) media and grown in the presence or absence of CLQ for 1 h. ACTIN and LC3B‐II protein levels are shown. Densitometry analysis of LC3B‐II over actin for indicated conditions is shown in the graph (right). Data are mean value ± SEM. Statistical analysis was performed one‐way ANOVA followed by Dunnett’s multiple comparison test. *P < 0.05 (n = 3 independent experiments).
- F
HeLa cells were co‐transfected with unrelated oligonucleotides as a negative control (siCTR) and empty vector (EV) or 3’UTR siRNA TFG siRNA together with EV or HA‐TFGwtLIR or TFGmutLIR3 plasmids, expressed at near endogenous levels. Protein extracts were analysed by WB to detect ULK1, TFG and ACTIN as indicated. Densitometry analysis of ULK1 over ACTIN is shown (right). Data are mean value ± SEM. Statistical analysis was performed by one‐way ANOVA followed by Dunnett’s multiple comparison test. *P < 0.05; **P < 0.01; and ns, not significant (n = 4 independent experiments).
- G, H
HeLa cells stably expressing untagged TFGwtLIR or TFGmutLIR3 were transfected with 3’UTR TFG siRNA, starved for 1 h, fixed, permeabilized and immunolabelled with ULK1 (red) alone or ULK1 (red) and ERGIC53 (green) (H). Hoechst was used to stain nuclei. ULK1 puncta number (G) was analysed and reported as mean ± SEM in the graph (right) (n = 3 independent experiments, n = 24 fields analysed). Co‐localization analyses between ULK1 (red) and ERGIC53 (green) (H) were performed by Jacop plugin. Values of Mander’s coefficient for ULK1, expressed as percentage, are reported as mean ± SEM (bottom graph) (n = 3 independent experiments, n = 19 fields analysed). White arrowheads point at co‐localization events between ULK1 and ERGIC53. Statistical analyses were performed by unpaired Student’s t‐test. **P < 0.01 and ***P < 0.001. Scale bar 5 μm.
- I
HeLa cells stably expressing GFP‐ATG13 together with BFP‐TFGwtLIR or BFP‐TFGmutLIR3 were co‐transfected with a siRNA targeting endogenous TFG (siTFG 3’UTR) and mCherry‐SEC16 plasmid and then cultured for 40’ with starvation medium. Cells were visualized with cellSens microscope for live‐cell imaging. Analysis of the percentage of GFP‐ATG13 lifetime co‐localizing with mCherry‐SEC16 in the presence of TFGwtLIR or TFGmutLIR3 is reported in the cumulative relative frequency plot. Statistical analysis was performed by Kolmogorov–Smirnov test. P < 0.0001 (n = 3 independent experiments, n ≥ 995 number of co‐localization events analysed).
- J
HeLa cells stably expressing GFP‐ATG13 together with BFP‐TFGwtLIR or BFP‐TFGmutLIR3 were transfected with 3’UTR TFG siRNA to downregulate endogenous TFG. Cells were cultured for 40’ with starvation medium and visualized with cellSens microscope for live‐cell imaging. Analysis of the percentage of GFP‐ATG13 lifetime co‐localizing with BFP‐TFGwtLIR or BFP‐TFGmutLIR3 is reported in the cumulative relative frequency plot. Statistical analysis was performed by Kolmogorov–Smirnov test. P = 0.0268 (n = 3 independent experiments, n ≥ 379 number of co‐localization events analysed).
- K
HeLa cells harbouring endogenously HA‐tagged LC3C were transfected with specific RNAi oligonucleotides (siLC3C) or unrelated oligonucleotides as a negative control (siCTR) and cultured in starvation medium for 30’. Protein extracts were analysed by WB to detect ULK1, ACTIN and HA‐LC3C as indicated. Densitometry analysis of ULK1 over ACTIN is reported (right). Data are expressed as mean ± SEM. Statistical analysis was performed by unpaired Student’s t‐test. *P < 0.05 (n = 3 independent experiments).
- L
HeLa cells harbouring endogenously HA‐tagged LC3C were transfected with a siRNA targeting TFG (siTFG) or with a non‐targeting control (siCTR). After 30’ of starvation, cells were lysed, and protein extracts were immunoprecipitated by using an anti‐HA antibody or IgG as negative control. Protein extracts were analysed by WB to detect ULK1 and HA‐LC3C as indicated.
- M
HeLa cells stably expressing untagged TFGwtLIR or TFGmutLIR3 were co‐transfected with HA‐LC3C and Myc‐ULK1 plasmids as indicated. Cells were starved for 30’, and protein extracts were immunoprecipitated using an anti‐HA antibody or IgG as negative control. Protein extracts were analysed by WB to detect ULK1, HA‐LC3C, TFG and ACTIN as indicated.
- A
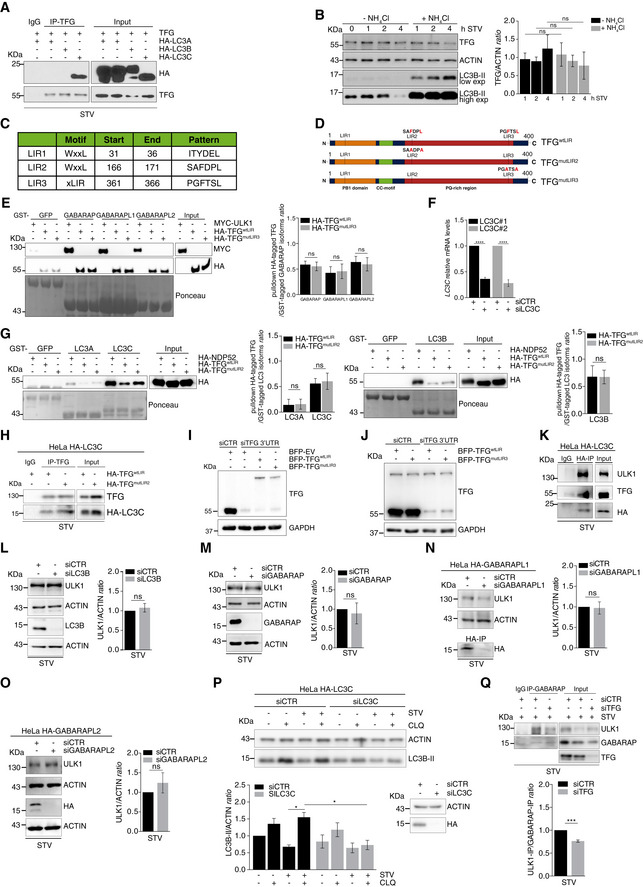
HeLa cells were co‐transfected with untagged TFG and HA‐tagged LC3A, LC3B or LC3C. After 1 h of starvation, protein extracts were immunoprecipitated by using an anti‐TFG antibody or IgG as negative control. LC3 subfamily and TFG were analysed by WB.
- B
HeLa cells were nutrient‐starved for the indicated time periods in the presence or absence of NH4Cl for the indicated timepoints of starvation. TFG, ACTIN and LC3B‐II (as indicator of NH4Cl activity) were shown in the WB. Densitometry analysis of TFG over ACTIN protein levels was analysed in the graph (right). Data are expressed by mean ± SEM. Statistical analysis was obtained by two‐way ANOVA followed by Tukey’s multiple comparison test. ns, not significant (n = 3 independent experiments).
- C
TFG LIR motives, obtained from the autophagy database iLIR with their sequence and position, are shown.
- D
Schematic illustration of TFG wild type (TFGwtLIR) and TFG mutants (TFGmutLIR2 and TFGmutLIR3) is shown. The aromatic F and the hydrophobic L residues of the TFGwtLIR were changed into two alanine residues for both the TFG mutants.
- E
Pulldown assays were performed by using purified GST‐GABARAP, GST‐GABARAPL1 and GST‐GABARAPL2 isoforms, each incubated together with HA‐TFGwtLIR‐ or HA‐TFGmutLIR3‐ or Myc‐ULK1‐transfected HeLa cell lysates, respectively. Myc‐ULK1 was used as positive control. Ponceau staining reports GST‐GABARAP isoforms and GST‐GFP used as negative control. WB analyses show Myc‐ULK1, HA‐TFGwtLIR and HA‐TFGmutLIR3. Densitometry analysis of HA‐TFG normalized over GST‐tagged GABARAP isoforms (Ponceau) was performed and reported (right). Data are mean ± SEM. Statistical analysis was performed by two‐way ANOVA followed by Tukey’s multiple comparison test. ns, not significant (n = 3 independent experiments).
- F
HeLa cells were transfected with the indicated siRNA, and LC3C mRNA relative levels were analysed by qPCR. Values are expressed as mean ± SEM. Statistical analysis was performed by unpaired t‐test. ****P < 0.0001 (n = 3 independent experiments).
- G
Pulldown assays were performed by using purified GST‐LC3A, GST‐LC3B and GST‐LC3C isoforms, each incubated together with HA‐TFGwtLIR‐ or HA‐TFGmutLIR2‐ or HA‐NDP52‐transfected HeLa cell lysates, respectively. HA‐NDP52 was used as positive control. Ponceau staining reports the indicated GST‐LC3 isoforms and GST‐GFP used as negative control. WB analyses show HA‐NDP52, HA‐TFGwtLIR and HA‐TFGmutLIR2 in association with LC3A and LC3C (left) and HA‐NDP52, HA‐TFGwtLIR and HA‐TFGmutLIR2 in association with LC3B (right) are shown. Densitometry analysis of HA‐TFG normalized over GST‐tagged LC3 isoforms (Ponceau) was performed and reported as indicated (right). All values are expressed as mean ± SEM. Statistical analysis was performed by two‐way ANOVA followed by Tukey’s multiple comparison test. ns, not significant (n = 3 independent experiments).
- H
HeLa cells harbouring endogenously HA‐tagged LC3C were transfected with HA‐TFGwtLIR or HA‐TFGmutLIR2. After 30’ of starvation, cells were lysed, and protein extracts were immunoprecipitated by using an anti‐TFG antibody or IgG as negative control. LC3C and TFG were analysed by WB.
- I
HeLa cells stably expressing GFP‐ATG13 together with BFP‐empty vector (EV) or BFP‐TFGwtLIR or BFP‐TFGmutLIR3 were co‐transfected with mCherry‐SEC16 together with siRNA targeting endogenous TFG (siTFG 3’UTR) or with a non‐targeting control (siCTR). Endogenously interfered cells were used to perform live‐cell imaging analysis (Fig 5I). WB analysis to detect endogenous or BFP‐TFG protein levels is reported.
- J
HeLa cells stably expressing GFP‐ATG13 together with BFP‐TFGwtLIR or BFP‐TFGmutLIR3 were transfected with siRNA targeting endogenous TFG (siTFG 3’UTR) or with a non‐targeting control (siCTR) as indicated. Endogenously interfered cells were used to perform live‐cell imaging analysis (Fig 5J). WB analysis to detect endogenous or BFP‐TFG protein levels is reported.
- K
HeLa cells harbouring endogenously HA‐tagged LC3C were starved for 30’. Protein extracts were immunoprecipitated by using an anti‐HA antibody or IgG as negative control. ULK1, TFG and HA‐LC3C protein levels were analysed by WB.
- L, M
HeLa cells were transfected with unrelated siRNA (siCTR) or siRNA targeting LC3B (siLC3B) (L) or GABARAP (siGABARAP) (M). (L‐M) After 30’ of starvation, cells were lysed and protein extracts were analysed by WB for indicated markers. ULK1 over actin is reported in the graphs (right). Data are shown as mean value ± SEM. Statistical analysis was performed by unpaired Student’s t‐test. ns, not significant (n = 3 independent experiments).
- N
HeLa cells harbouring endogenously HA‐tagged GABARAPL1 were transfected with siRNA targeting GABARAPL1 or unrelated siRNA (siCTR). After 30’ of starvation, cells were lysed. Part of protein extract was immunoprecipitated with anti‐HA antibody to evaluate the downregulation of GABARAPL1. Remaining protein extract was analysed by WB as shown. ULK1 over ACTIN is also reported (right). Data are shown as mean value ± SEM. Statistical analysis was performed by unpaired Student’s t‐test. ns, not significant (n = 3 independent experiments).
- O
HeLa cells harbouring endogenously HA‐tagged GABARAPL2 were transfected with siRNA targeting GABARAPL2 or unrelated siRNA (siCTR). Cells were starved for 30’ and lysed. Protein extract was analysed by WB to detect the indicated markers. ULK1 over ACTIN is also reported (right). Data are as mean ± SEM. Statistical analysis was performed by unpaired Student’s t‐test. ns, not significant (n = 3 independent experiments).
- P
HeLa cells harbouring endogenously HA‐tagged LC3C were transiently transfected with siLC3C or siCTR and grown in complete or starved (STV) media, in the presence or absence of CLQ for 1 h. LC3B‐II and ACTIN were analysed by WB. Densitometry analysis of LC3B‐II normalized over ACTIN is reported (bottom left). LC3C downregulation is also shown (bottom right). All data are reported as mean ± SEM. Statistical analysis was performed by two‐way ANOVA followed by Tukey’s multiple comparison test. *P < 0.05 (n = 3 independent experiments).
- Q
HeLa cells were co‐transfected with indicated siRNAs and cultured in starvation medium for 30’. Cells were lysed, and protein extracts were immunoprecipitated by using an anti‐GABARAP antibody or IgG as negative control. ULK1, GABARAP and TFG protein levels were analysed by WB. ULK1‐IP over GABARAP‐IP is reported in the graph (bottom). Data are mean ± SEM. Statistical analysis was performed by unpaired Student’s t‐test. ***P < 0.001 (n = 3 independent experiments).
References
-
- Birgisdottir ÅB, Lamark T, Johansen T (2013) The LIR motif ‐ crucial for selective autophagy. J Cell Sci 126: 3237–3247 - PubMed
Publication types
MeSH terms
Substances
Grants and funding
LinkOut - more resources
Full Text Sources
Other Literature Sources
Research Materials
