. 2021 Aug 5;29(8):834-845.e5.
doi: 10.1016/j.str.2021.04.006. Epub 2021 Apr 30.

Conformational flexibility and structural variability of SARS-CoV2 S protein

Affiliations

Conformational flexibility and structural variability of SARS-CoV2 S protein

Ishika Pramanick et al. Structure. .

Abstract

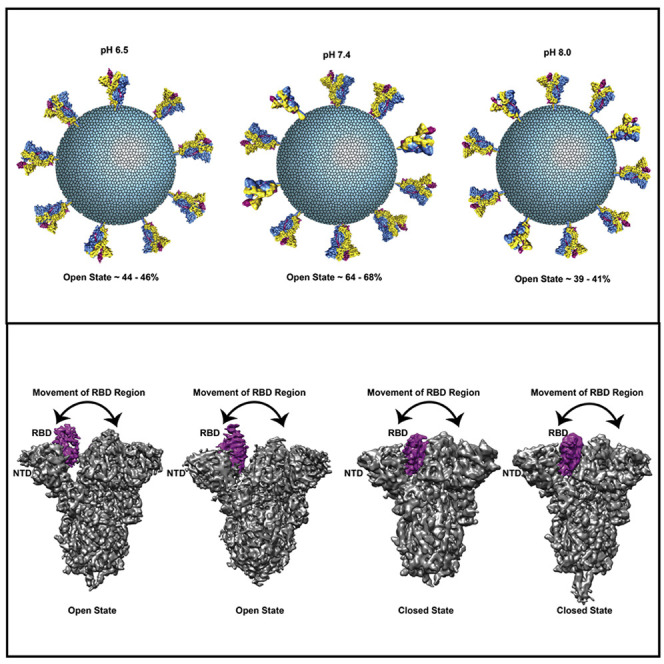
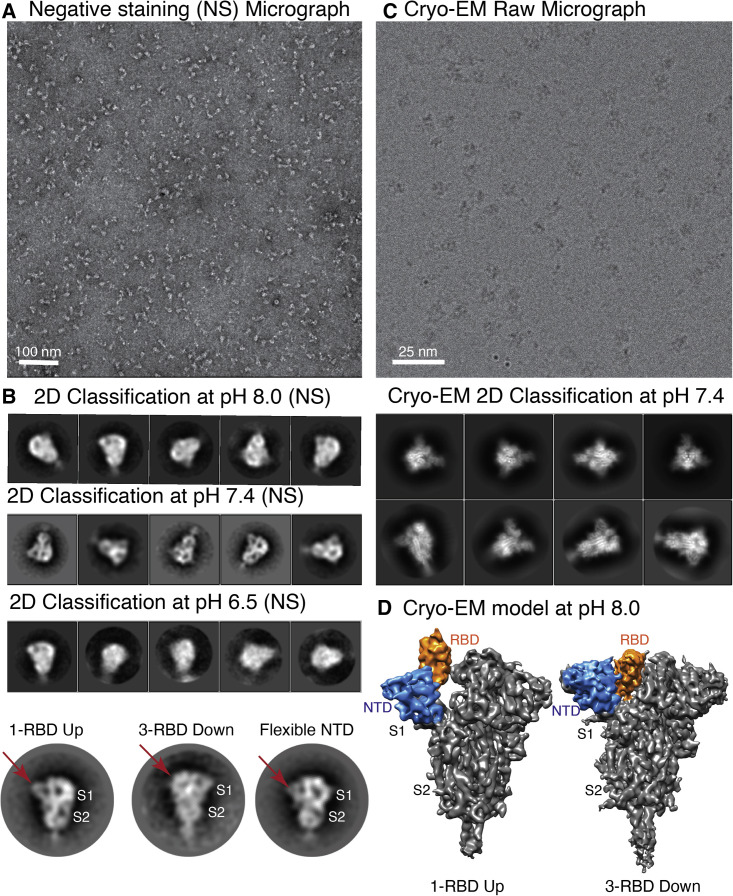
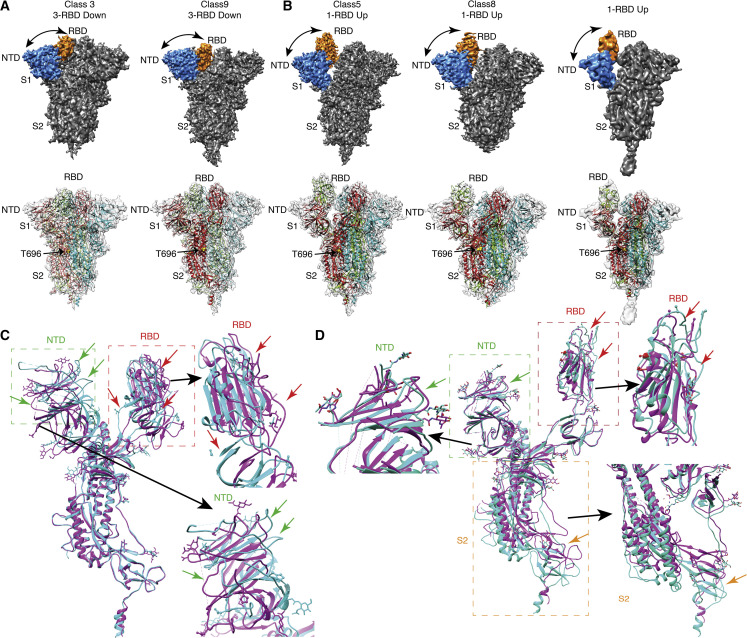
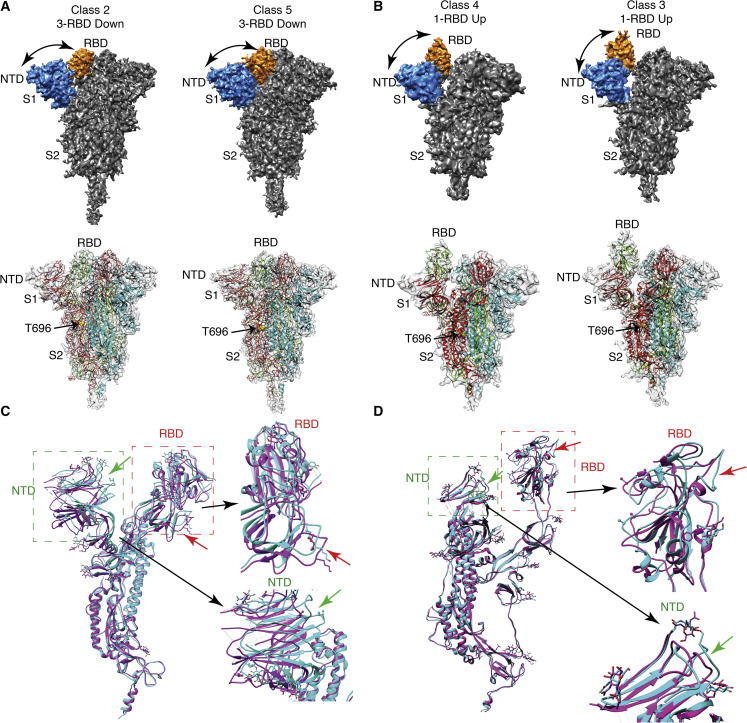
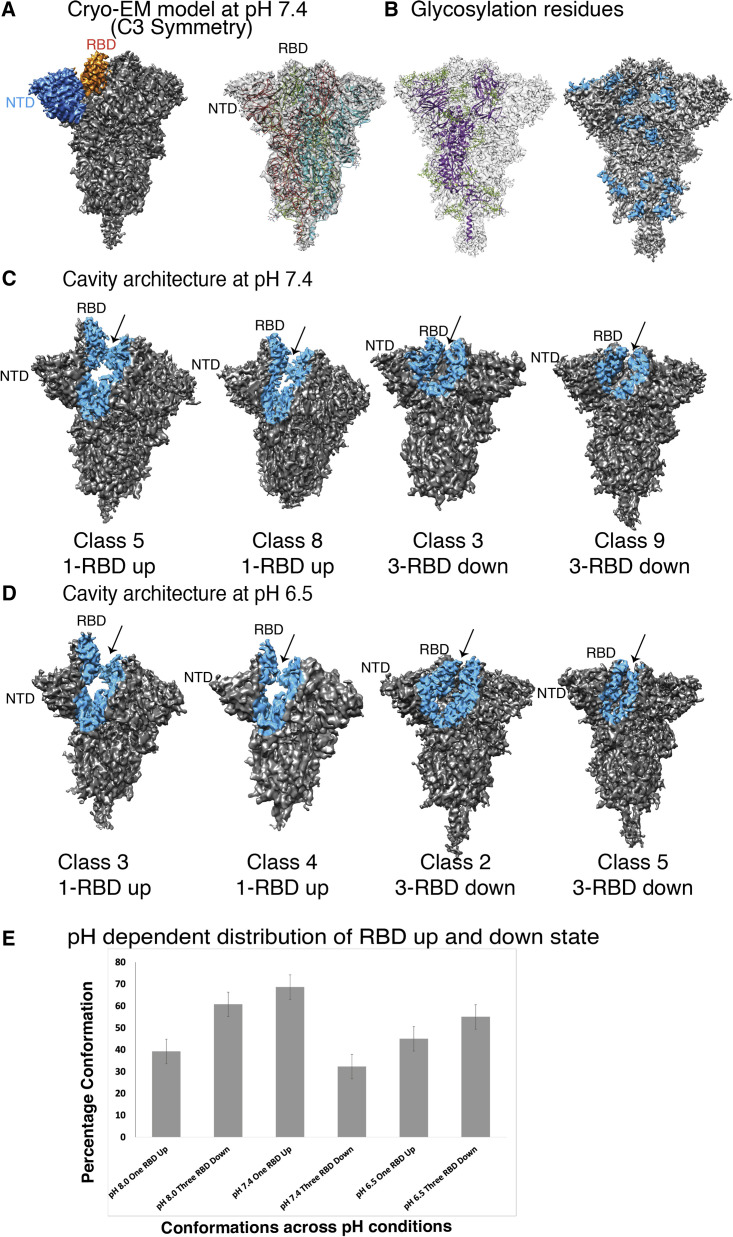
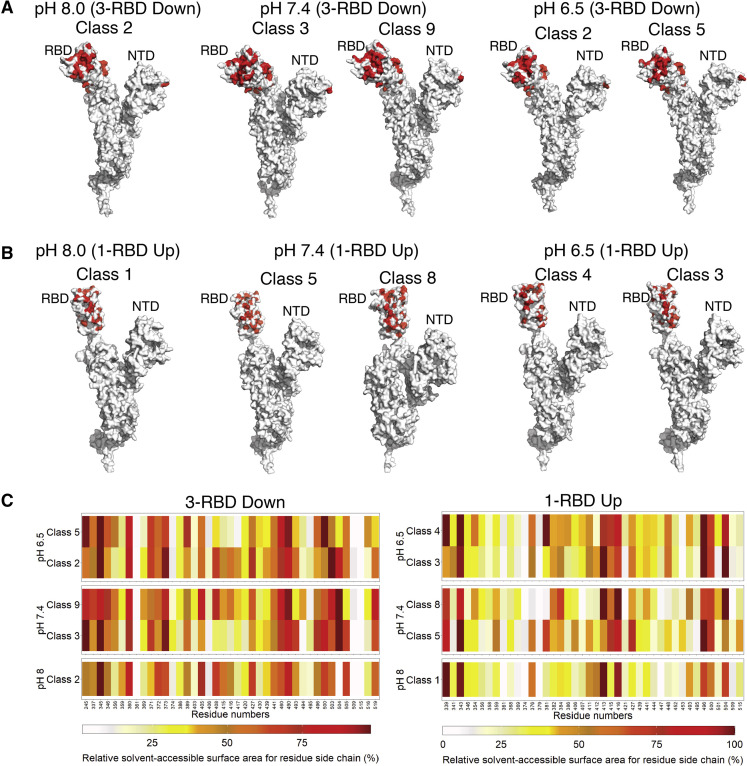
Spike (S) glycoprotein of SARS-CoV2 exists chiefly in two conformations, open and closed. Most previous structural studies on S protein have been conducted at pH 8.0, but knowledge of the conformational propensities under both physiological and endosomal pH conditions is important to inform vaccine development. Our current study employed single-particle cryoelectron microscopy to visualize multiple states of open and closed conformations of S protein at physiological pH 7.4 and near-physiological pH 6.5 and pH 8.0. Propensities of open and closed conformations were found to differ with pH changes, whereby around 68% of S protein exists in open conformation at pH 7.4. Furthermore, we noticed a continuous movement in the N-terminal domain, receptor-binding domain (RBD), S2 domain, and stalk domain of S protein conformations at various pH values. Several key residues involving RBD-neutralizing epitopes are differentially exposed in each conformation. This study will assist in developing novel therapeutic measures against SARS-CoV2.

Keywords: 3D reconstruction; S-head; TEM; cryo-EM; negative staining; pH-dependent; single particle; solvent accessibility; spike homotrimer; stalk domain.


Conflict of interest statement

Declaration of interests The authors declare no competing interests.

Figures

None
Graphical abstract
Figure 1
Figure 1
Negative staining and 2D class averages of S protein at pH 8.0, 7.4, and 6.5, and 3D reconstruction at pH 8.0 (A) Representative negative-stain image of S protein. (B) Representative reference free 2D class averages of negative-stain images at pH 8.0, 7.4, and 6.5. Class averages indicate that S protein was stable and formed a cone-shaped architecture at various pH conditions. There is no observable aggregation or distortion due to pH changes. Bottom panel shows an enlarged view of three different class averages where different orientations and the flexibility of RBD and NTD are visible (marked by red arrow). (C) Cryo-EM micrograph and 2D class averages of S protein at pH 7.4. Cryo-EM micrographs and 2D class averages of S protein at pH 6.5 and pH 8.0 are shown in Figure S1. (D) 3D reconstruction of 1-RBD up-open and all-RBD down-closed conformations of S protein at pH 8.0. See also Figures S1 and S2.
Figure 2
Figure 2
Cryo-EM 3D reconstruction of S protein at pH 7.4 (A and B) Solid and transparent representation of cryo-EM 3D reconstruction of S protein at pH 7.4. The transparent representation of S protein is fitted with an atomic model calculated from 3D reconstructions of S protein and PDB: 6vyb (1-RBD up) and PDB: 6zwv (3-RBD down). Yellow spheres represent T696 at the boundary of S1 and S2 regions. The RBD and NTD of the solid representation of the S protein are colored orange and blue, respectively. At pH 7.4, two 3-RBD down-closed conformations (A) and three 1-RBD up-open conformations (B) are observed. Distance between RBD and NTD is marked by black curved arrows. (C) Comparison between two closed states, class 3 (cyan) and class 9 (purple), indicates the movement of RBD and NTD. Only one monomer of both the closed conformers are superimposed and represented here to visualize the displacement of NTD and RBD. No displacement is noticed in S2 subunit, whereas a major shift is observed in RBD (marked as red box) and NTD (marked as green box). The enlarged views of RBD and NTD are displayed alongside the full monomer. Green and red arrows show the displacement between the atomic model of class 3 (cyan) and class 9 (purple). (D) Comparison between two 1-RBD up-open conformations, class 5 (cyan) and class 8 (purple). Difference in NTD region is shown by green arrows, RBD region by red arrows, and S2 region by orange arrows. A significant displacement is observed in S2 subunit, RBD, and NTD, marked by orange, red, and green boxes, respectively. All these three boxed out regions are shown in enlarged view beside the full monomer. See also Figure S3 and Tables S1–S3.
Figure 3
Figure 3
Cryo-EM 3D reconstruction of S protein at pH 6.5 (A and B) Solid and transparent representation of cryo-EM 3D reconstruction of S protein at pH 6.5. The transparent representation of S protein is fitted with an atomic model calculated from 3D reconstructions of S protein and PDB: 6vyb (1-RBD up) and PDB: 6zwv (3-RBD down). Yellow spheres represent T696 at the boundary of S1 and S2 region. The RBD and NTD of the solid representation of the S protein are colored orange and blue, respectively. At pH 6.5, two 3-RBD down-closed conformations (A) and two 1-RBD up-open conformations (B) are observed. Distance between RBD and NTD is marked by black curved arrows. (C) Comparison between the atomic models of two closed (all-RBD down conformation) states, class 2 (cyan) and class 5 (purple), indicates the movement of RBD and NTD. RBD and NTD are marked by red and green boxes, respectively. Black arrows show the enlarged view of RBD and NTD, where significant displacement is observed. (D) Comparison between atomic models of two open states, class 4 (cyan) and class 3 (purple). Difference in NTD region is shown by green arrows and RBD region by red arrows. See also Figure S4 and Tables S1–S3.
Figure 4
Figure 4
Calculation of high-resolution symmetric closed states of S protein and measurement of cavity between closed and open conformers (A) Solid and transparent representations of cryo-EM reconstruction of S protein at pH 7.4 with C3 symmetry. (B) Nineteen glycan chains out of 23 predicted glycosylation sites are clearly visible in the high-resolution cryo-EM 3D reconstruction of closed-state S protein structure. All the glycan chains are colored green (transparent model). In the solid model, glycosylation residues are marked in blue. (C) Cavity between RBD and NTD is marked by blue color in open and closed conformations at pH 7.4. (D) Cavity between RBD and NTD is marked by blue color in open and closed conformations at pH 6.5. (E) Bar diagram (percentage values ± standard error of mean) showing distribution of open and closed conformations of S protein at three different pH conditions (pH 8.0, 7.4, and 6.5). See also Figures S2–S4.
Figure 5
Figure 5
Relative solvent-accessible surface area calculation of each residue side chain at the RBD region (A) Amino acid residues (marked red) at RBD and NTD regions of 3-RBD down S protein, involved in interaction with neutralizing antibodies at pH 8.0, 7.4, and 6.5. (B) Amino acid residues (marked red) at RBD and NTD regions of 1-RBD up S protein, involved in interaction with neutralizing antibodies at pH 8.0, 7.4, and 6.5. (C) Comparison between relative solvent-accessible surface area of residue side chain at RBD region of closed and open models. Heatmap shows the change of relative solvent-accessible surface area for residue side chain (%) at the RBD region of closed and open models at pH 8.0, 7.4, and 6.5.
Figure 6
Figure 6
Comparison between 1-RBD up single ACE2 bound S protein with 1-RBD up apo S protein at physiological pH Superimposition of 1-RBD up single ACE2 bound S protein (PDB: 7KNB) and 1-RBD up S protein atomic model from this study (class 5 at pH 7.4). Magnified view represents the difference in the RBD region (top right) between ACE2 bound and apo S protein. Bottom right panel illustrates good correlation between the secondary structures of S2 region of former and latter.

References

    1. Adams P.D., Afonine P.V., Bunkóczi G., Chen V.B., Davis I.W., Echols N., Headd J.J., Hung L.-W., Kapral G.J., Grosse-Kunstleve R.W., et al. PHENIX: a comprehensive Python-based system for macromolecular structure solution. Acta Crystallogr. Sect. D Biol. Crystallogr. 2010;66:213–221. - PMC - PubMed
    1. Barad B.A., Echols N., Wang R.Y.-R., Cheng Y., DiMaio F., Adams P.D., Fraser J.S. EMRinger: side chain-directed model and map validation for 3D cryo-electron microscopy. Nat. Methods. 2015;12:943–946. - PMC - PubMed
    1. Barnes C.O., Jette C.A., Abernathy M.E., Dam K.-M.A., Esswein S.R., Gristick H.B., Malyutin A.G., Sharaf N.G., Huey-Tubman K.E., Lee Y.E., et al. SARS-CoV-2 neutralizing antibody structures inform therapeutic strategies. Nature. 2020;588:682–687. - PMC - PubMed
    1. Batishchev O.V., Shilova L.A., Kachala M.V., Tashkin V.Y., Sokolov V.S., Fedorova N.V., Baratova L.A., Knyazev D.G., Zimmerberg J., Chizmadzhev Y.A. pH-dependent formation and disintegration of the influenza A virus protein scaffold to provide tension for membrane fusion. J. Virol. 2016;90:575–585. - PMC - PubMed
    1. Beniac D.R., Andonov A., Grudeski E., Booth T.F. Architecture of the SARS coronavirus prefusion spike. Nat. Struct. Mol. Biol. 2006;13:751–752. - PMC - PubMed

Publication types

Substances

LinkOut - more resources