. 2021 May 27;184(11):2825-2842.e22.
doi: 10.1016/j.cell.2021.04.004. Epub 2021 Apr 30.

A single-embryo, single-cell time-resolved model for mouse gastrulation

Affiliations

A single-embryo, single-cell time-resolved model for mouse gastrulation

Markus Mittnenzweig et al. Cell. .

Abstract

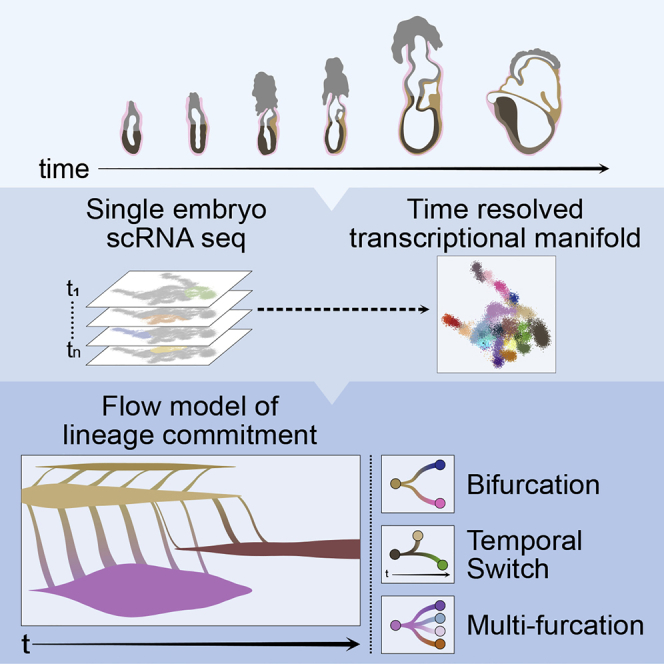
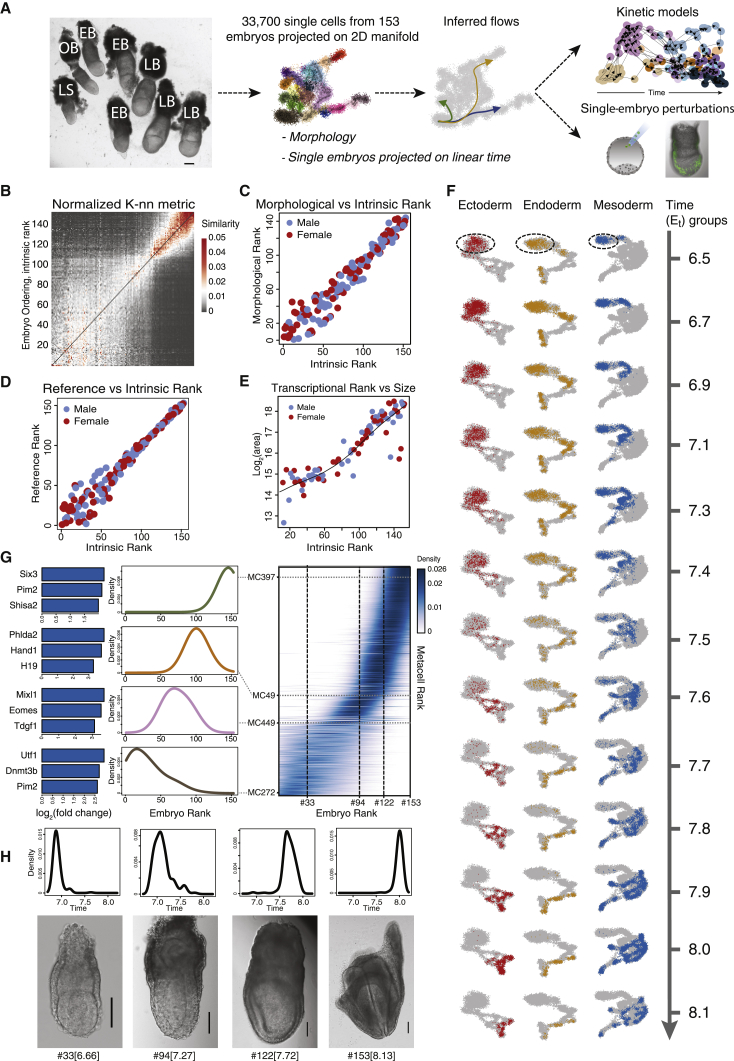
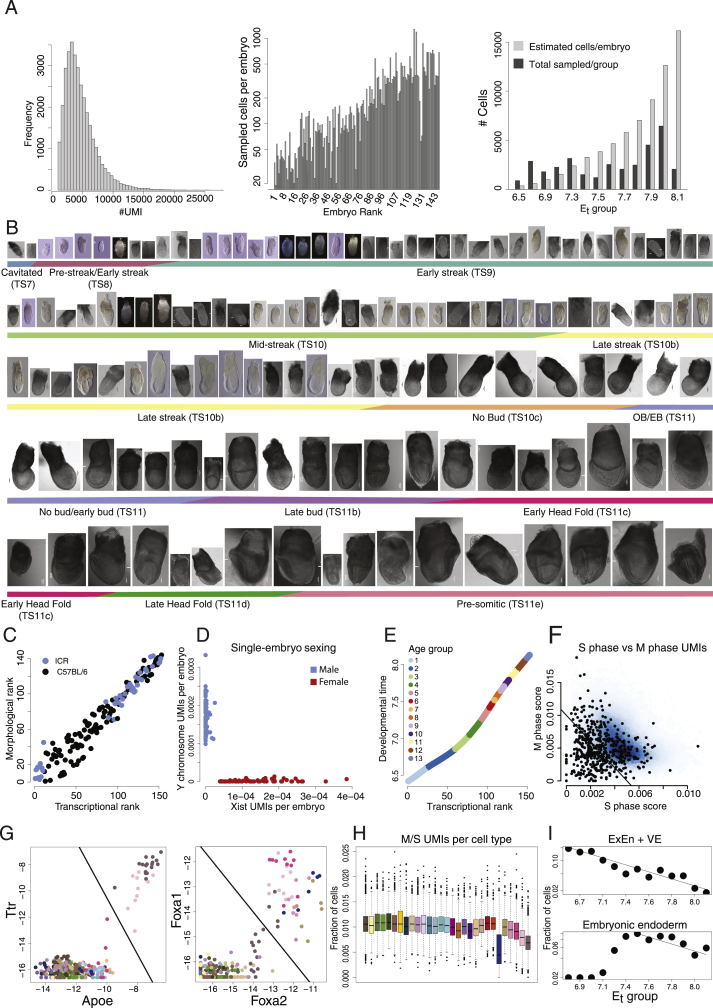
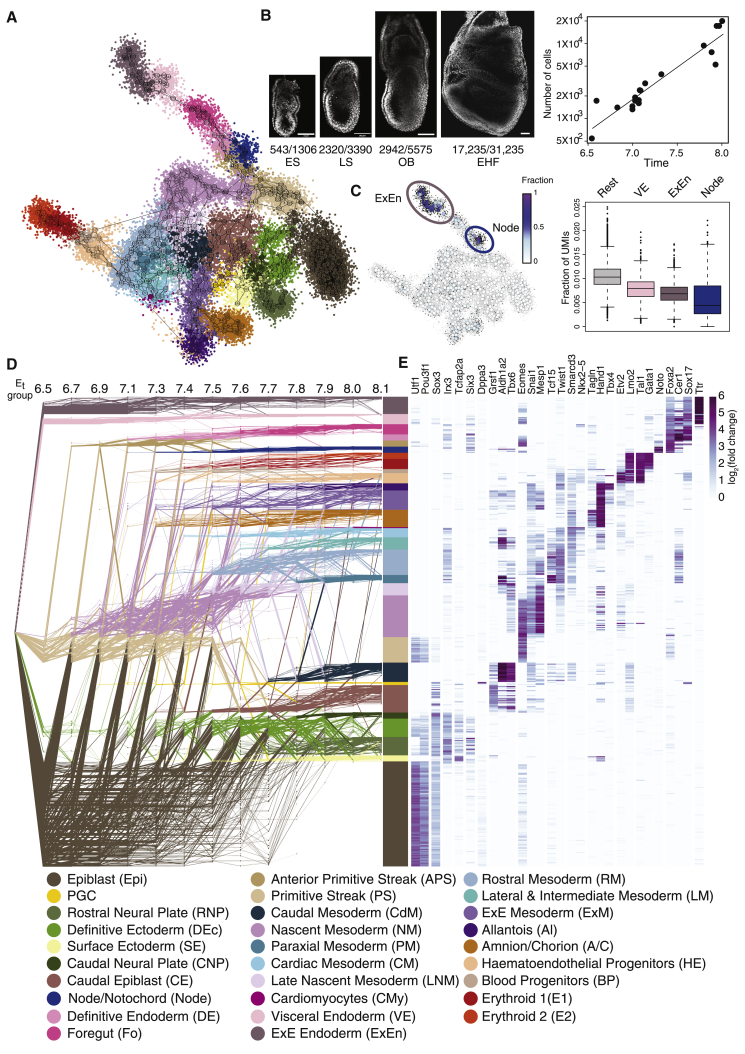
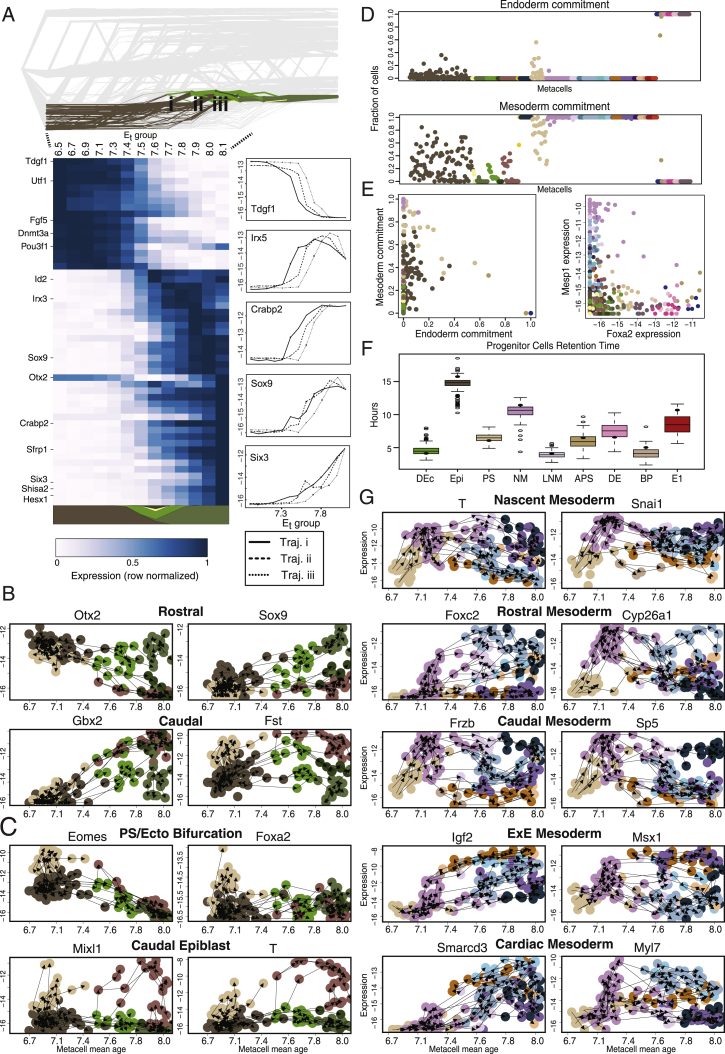
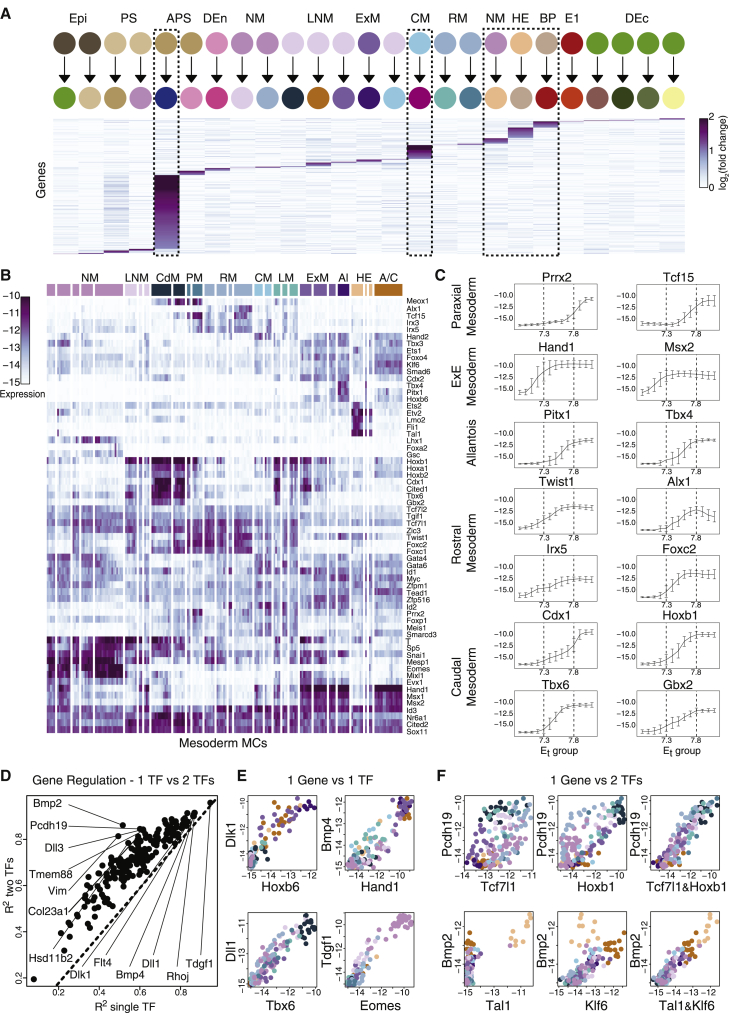
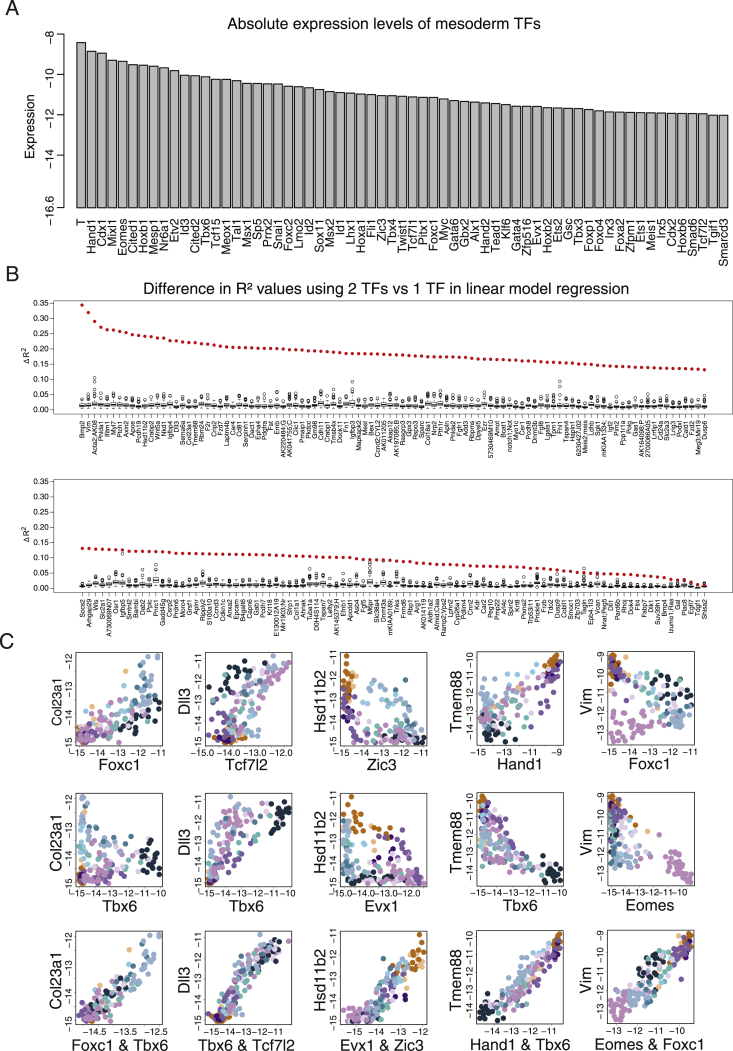
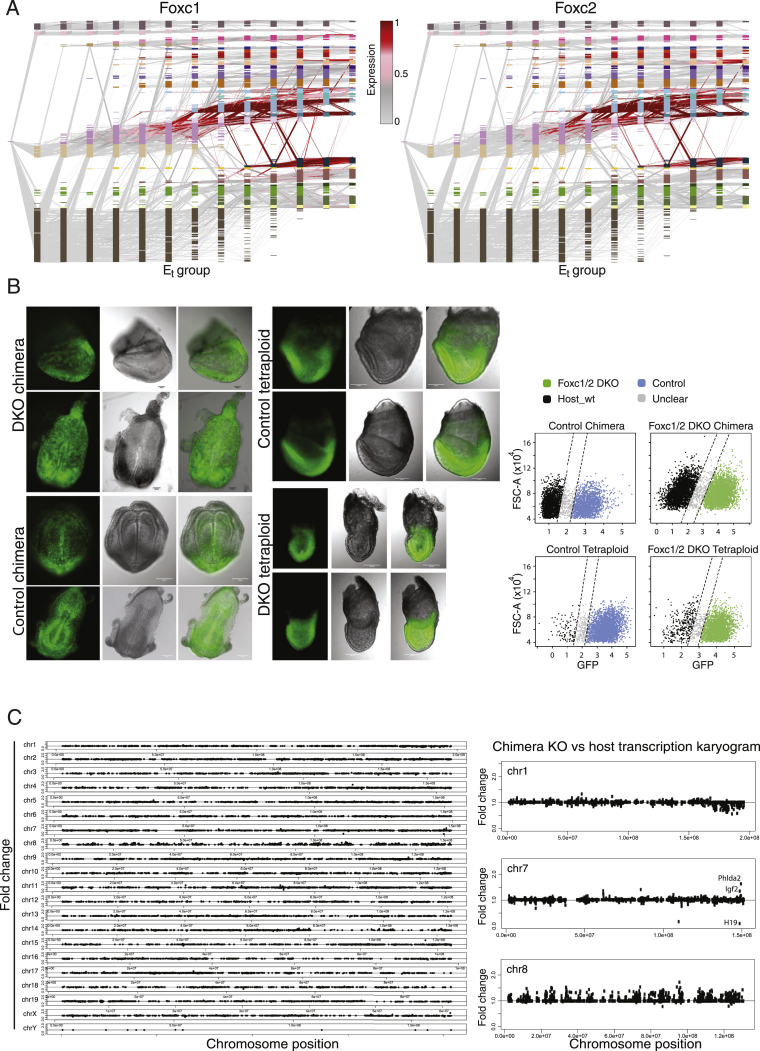
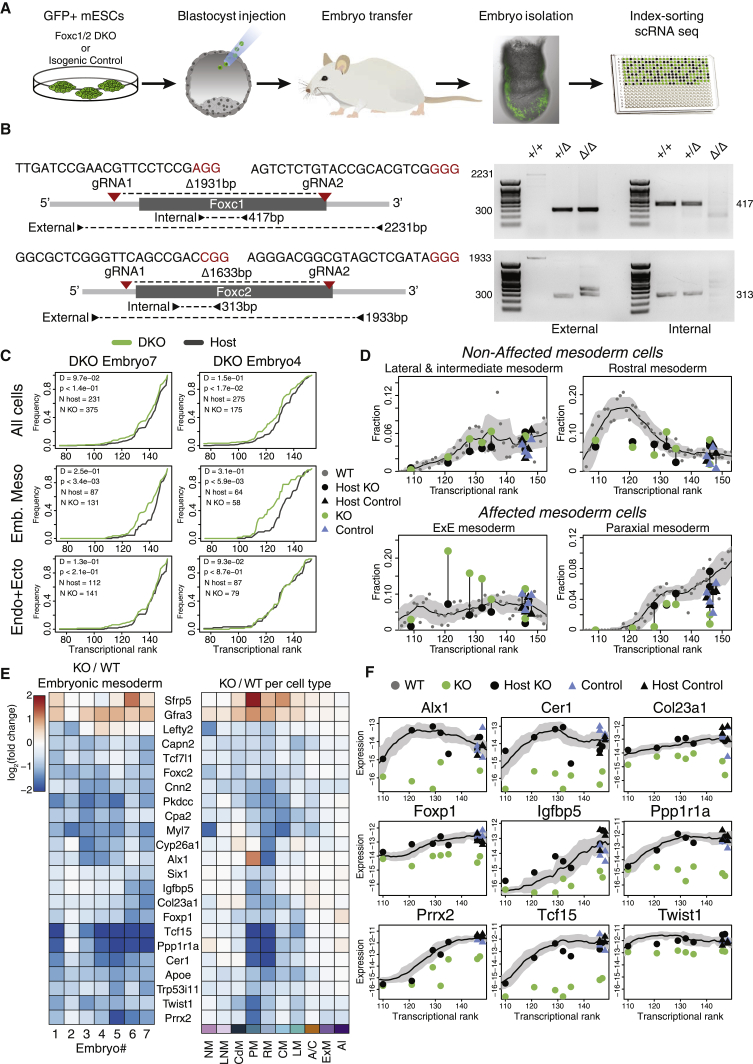
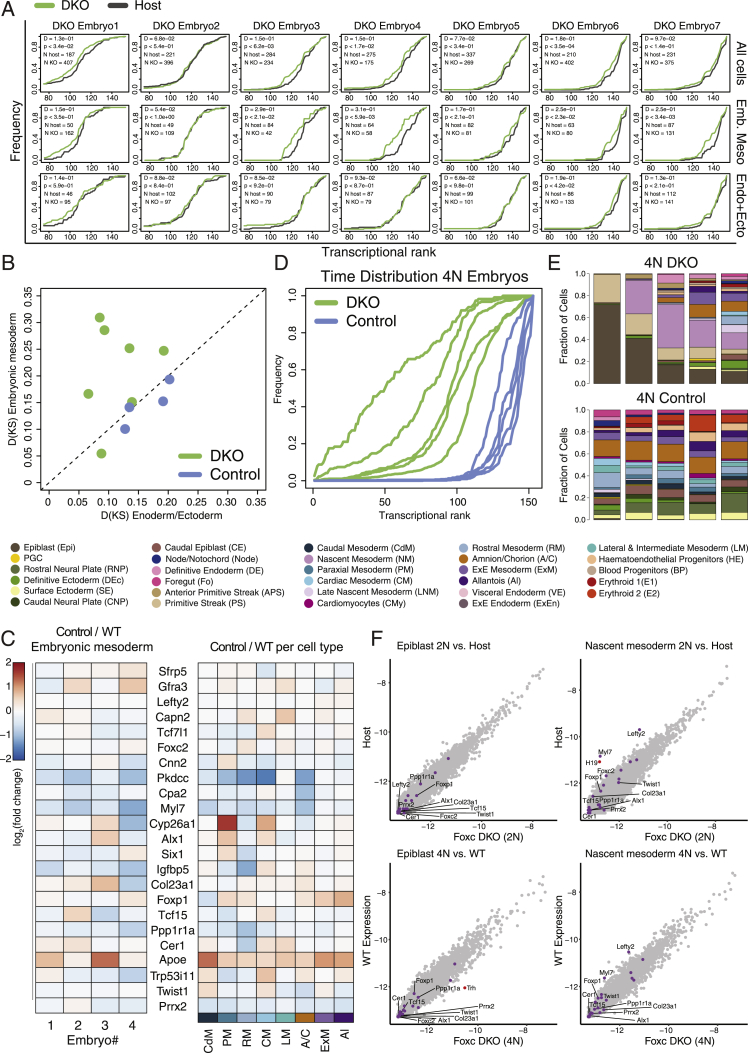
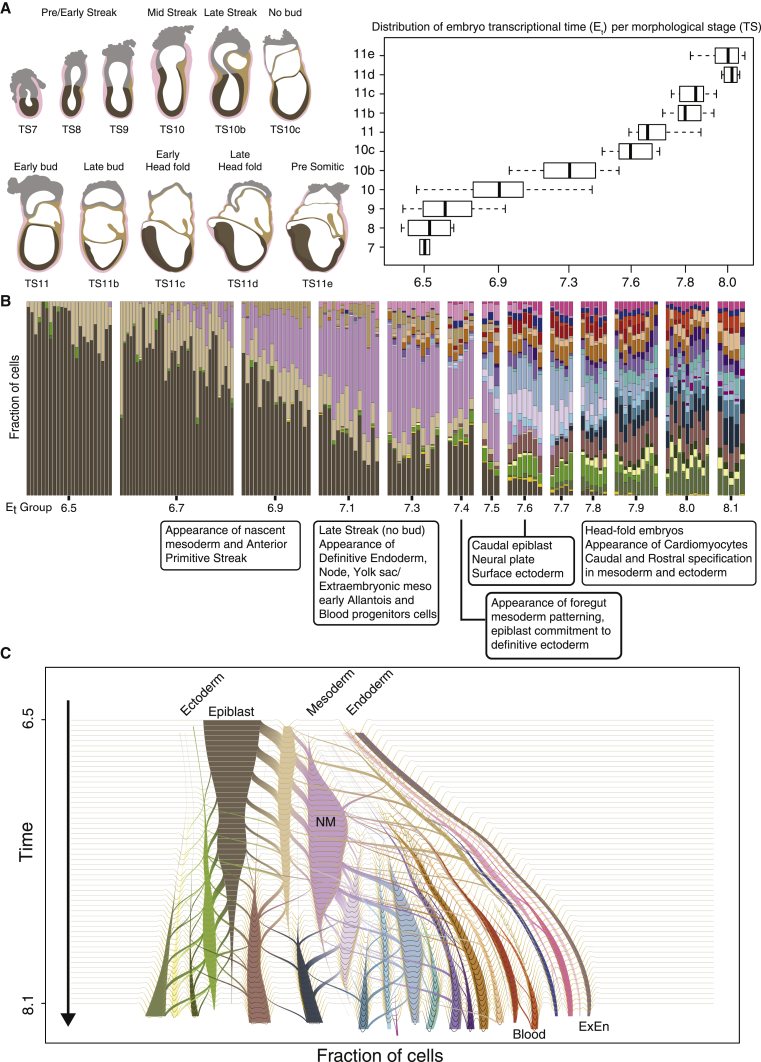
Mouse embryonic development is a canonical model system for studying mammalian cell fate acquisition. Recently, single-cell atlases comprehensively charted embryonic transcriptional landscapes, yet inference of the coordinated dynamics of cells over such atlases remains challenging. Here, we introduce a temporal model for mouse gastrulation, consisting of data from 153 individually sampled embryos spanning 36 h of molecular diversification. Using algorithms and precise timing, we infer differentiation flows and lineage specification dynamics over the embryonic transcriptional manifold. Rapid transcriptional bifurcations characterize the commitment of early specialized node and blood cells. However, for most lineages, we observe combinatorial multi-furcation dynamics rather than hierarchical transcriptional transitions. In the mesoderm, dozens of transcription factors combinatorially regulate multifurcations, as we exemplify using time-matched chimeric embryos of Foxc1/Foxc2 mutants. Our study rejects the notion of differentiation being governed by a series of binary choices, providing an alternative quantitative model for cell fate acquisition.

Keywords: cell fate decisions; chimera assay; developmental biology; mouse gastrulation; network flow model; scRNA-seq; tetraploid complementation assay; trajectory inference.


Conflict of interest statement

Declaration of interests The authors declare no competing interests.

Figures

None
Graphical abstract
Figure 1
Figure 1
Resolving time and gene expression in single cells and single embryos (A) Natural variation among litters and littermates (left panel) is harnessed to generate a temporal transcriptional model of embryonic development. Shown is a schematic representation of the workflow. Image of a single litter isolated at 7.75 dpc. Scale bar, 200 μm. LS, late streak; OB, no bud; EB, early bud; LB, late bud. (B) Embryo-embryo similarity matrix ranking the embryos according to their intrinsic transcriptional makeup. (C) Comparison between intrinsic transcriptional rank and ranking based on morphological feature analysis. (D) Comparison of intrinsic versus external ordering using projection on a reference atlas (Pijuan-Sala et al., 2019). (E) Comparison between transcriptional rank and size estimate of embryo cross-section (log2, μm2, fitted line using smooth spline interpolation with λ = 7.1 × 10−3). (F) Projection of cells following binning of embryos into 13 time groups, over 2D MC projections, separately for each of the three embryonic germ layers (epiblast is marked by dashed ovals). (G) Metacells (MCs) represent a transcriptional state shared by cells from numerous embryos, spanning a time range. Right panel: distribution of embryo rank (columns) for cells included in each MC (each represented by a single row). Rows are normalized to reflect the temporal heterogeneity of each MC. Left panel: highlighted rank distributions of individual MCs from different lineages, and the expression of selected marker genes from each MC (bar plots; log2, relative to mean expression over all MCs). (H) Four representative embryos are shown alongside the time distribution of their comprising cells (calculated from the MCs mean age). Scale bar, 100 μm. #Embryo rank; in brackets, calculated time (Et). See also Figure S1 and Table S1.
Figure S1
Figure S1
Sampling single embryos, related to Figures 1 and 2 (A) Distribution of unique reads (UMI) per cell in the manifold. Cells with less than 1000 UMIs were filtered out of the analysis (left panel), Number of cells from each embryo represented in the manifold, sorted according to intrinsic rank (middle panel), and sampled number of cells per age group relative to the estimated number of cells (Figure 2B) (right panel). (B) Pictures of embryos sampled in the study, ranked and sorted according to morphology. Images are uniformly scaled, scale bar = 100um. (C) Classification of embryos according to parental strain used in this study (ICR and C57BL/6), demonstrating coordinated correlation between morphology and transcriptional ranks between strains. (D) Sexing of individual embryos according to the expression of Xist and Y- chromosome genes. Number of UMIs are normalized by total number of UMIs per embryo. (E) Age group allocation of embryos: Embryos are partitioned into 13 age groups. Intrinsic ranks are translated into a developmental timescale using transcription and size measurements of embryos (Figure 1E). (F) Density plot of single-cell calculated cell-cycle scores according to combined M- and S- phase UMI counts. Cutoff line represents cells having a low cell-cycle score. These cells are highlighted in the 2D projection in Figure 2C. Black dots represent endoderm cell types (definitive endoderm, foregut, node/notochord, VE, ExEn), that are enriched for low score cells. (G) Classification of embryonic and extraembryonic endoderm (ExEn) in the flow model: All MCs above the cutoff line in the left panel (Ttr versus Apoe expression) were classified as ExEn. All MCs not classified as ExEn that exhibit high Foxa2 and Foxa1 expression, were assigned to the group of embryonic endoderm. For both groups, growth loss constants λt>0 were used in the flow model (see I). (H) Boxplot distribution of single-cell cell-cycle score according to cell type. (I) Estimation of growth loss constants λt for embryonic endoderm and ExEn/VE. Shown is the fraction of these cells over time (log scale). Lines correspond to growth loss constants λt=0.17 for ExEn/VE, and λt=0.12 for embryonic endoderm, as used in the network flow model.
Figure 2
Figure 2
A network flow model for gastrulation (A) Color coded 2-D projection of the metacell (MC) graph (numbered nodes connected by edges depicting the most similar neighbors for each MC), representing the entire transcriptional manifold. Single cells indicated by small dots are colored according to the MC they comprise. See color annotation legend below. (B) Growth rate during gastrulation was estimated by counting DAPI stained nuclei. Left: cell counts of the embryonic compartment out of the total counted cells per embryo are shown for four representative examples. ES, early streak; LS, late streak; OB, no bud; EHF, early head-fold. Scale bar, 100 μm. Right: comparison of embryos’ (n = 19) cell count and estimated embryonic time. For each embryo, time was assigned based on morphological similarity to sequenced embryos. (C) Single cells with low S-phase and M-phase gene expression (black dots) are highlighted on the 2D projection (left, see Figure S1F and STAR Methods). MCs are colored according to the fraction of such cells they contain. Boxplots (right) depicting the distribution of S-phase/M-phase expression for the identified slower cycling cell types (legend below) and all other cells (Rest). Boxes show interquartile range (IQR) with median of the data. Length of whiskers corresponds to 1.5 IQR, or distance to the extremal value if within 1.5 IQR. (D) The gastrulation network flow model consists of MCs (nodes in rows) distributed in time (x axis), and flows (edges) that link MCs between adjacent time points. The first time point represents a common source for all MCs. Annotation (color-coded) relies on both marker expression and flow-based fate mapping. (E) Heatmap showing relative expression (log fold change) of key lineage-specific genes. See also Figures S2 and S3 and Table S2.
Figure S2
Figure S2
Robustness and parameter sensitivity analysis of the mincost flow model, related to Figure 2 (A) Parameter sensitivity of cell type transitions. For each parameter examined, flows were re-computed and the mean transition frequency over all time points between pairs of cell types was reported (left panel for each shown parameter). Capacity variance and capacity costs 1 and 2 are the three parameters defining the convex capacity cost (cost functions are depicted in the right panel of each parameter). Logistic loc and scale as well as Markov process time t are parameters used to define manifold distances between MCs. For the parameters logistic loc and logistic scale, the different shapes of the resulting logistic distance are plotted on the right (see STAR Methods for complete description of the mincost flow model). The values used to derive the flow model in Figure 2 are marked in red in all panels. (B) Robustness analysis of the mincost flow model: For each replica MC model (one embryo left out per iteration), manifold distances and flows are recomputed. Boxplots show for each transition tt+1 the 20 most frequent flow transitions between two cell types. Boxes represent values of the 153 replica flows, and the transition frequencies of the original flow model are marked as red dots.
Figure S3
Figure S3
Expression of marker genes and fate map correlation matrix, related to Figure 2 (A) Annotation of MCs using flows. Shown is the second-order correlation matrix of time-averaged incoming and outgoing flows per MC. Correlation matrix was hierarchically clustered into 65 groups. See STAR Methods for additional information. (B) Canonical marker genes expression supporting the clusters annotation. MCs are sorted and separated according to the hierarchical cluster tree from A (log2 of UMI frequency, y axis).
Figure 3
Figure 3
Traceback of differentiation fates and their expression kinetics (A–C) Flow tracebacks were performed from (A) erythroid 2 (MC#1), (B) node/notochord (MC#367), and (C) cardiomyocyte (MC#57) states. Network plots depict traced-back flows color-coded by annotated cell types and labeled (roman numerals) according to key temporal trajectories. Heatmaps show average expression kinetics for genes with the highest variance over the trajectories. Colored polygons represent the cell type composition of the traceback at each time point (combining the trajectories). Line graphs show the absolute expression level (log2 of UMI frequency, y axis) for select marker genes, along each of the trajectories shown in the respective network plot.
Figure 4
Figure 4
Temporal dynamics during epiblast, primitive streak, and nascent mesoderm commitment (A) Vein plots describe the continuous transition of cell types to their direct descendants (represented by diagonal flows spanning time points), and the dynamic relative frequencies of these cell types in the embryo over time (vein width on the y axis). This panel shows transitions emanating from the epiblast to the primitive streak (PS) and definitive ectoderm (DEc). Vein connection width represents flow flux at each time point. Dashed arrow represents a link to a subsequent panel (here, F). (B) Bars represent the composition of direct differentiation targets of epiblast cells at each time group. (C) Row-normalized heatmaps of expression in the epiblast per time. Genes with homogeneous expression are shown on the left, clusters of variable expression, on right. (D) Gene-flow plots in which nodes represent MCs, and edges link each MC to the source MC with the highest contributing flow in the network. MC level expression versus MC mean time is depicted for Eomes, Tdgf1, and Irx5 genes. Only MCs from Epiblast and related cell types are shown. (E) Expression of members of TGF-β superfamily signaling modulators over time. Line graphs represent total transcript levels for the entire endoderm or mesoderm for each age group. (F) Vein plot (as in A) describing the flow model emanating from PS to its predicted direct descendants. (G) Predicted fate composition of early/late NM cells at each age group. Columns represent fraction of cells committing to each of the mesoderm fates, separated into hematoendothelial and extraembryonic lineages (negative values), and embryonic mesoderm (positive values). (H and I) Vein plots illustrating the flow emanating from early and late NM (respectively) and gene-flow plots for key NM markers. See also Figure S4.
Figure S4
Figure S4
Dynamics of cell fate transitions, related to Figure 4 (A) Similar to Figure 3, for flows traced back from MC#397 (rostral neural plate). (B) Gene-flow plots in which nodes represent MCs, and edges link each MC to the source MC with the highest contributing flow in the network. MC level expression versus MC mean time is depicted for key genes correlated with rostral and caudal neural ectoderm. (C) Gene-flow plots of key genes associated with PS and caudal epiblast. (D) Mesoderm and endoderm commitment per MC. Panels show the fraction of the flow passing through each MC that contributes to mesoderm or endoderm at the final time point. The remaining fraction contributes to ectoderm (not shown). (E) The PS is predicted to be the only bi-potential cell type which significantly contributes to both mesoderm and endoderm (other than the pluripotent epiblast, and a single APS MC) (left). MC expression of key endoderm (Foxa2) and mesoderm (Mesp1) TFs (right). (F) Retention time of progenitor cell types: Shown is the median length of time a cell spends in each cell type according to the flows. Boxes represent distribution of retention times computed for the 153 iterated MC models (see Figure S2B). (G) Gene-flow plots of genes characteristic for specific mesodermal fates.
Figure 5
Figure 5
Combinatorial rather than hierarchical TF expression and regulation in the mesoderm (A) Identification of genes specifically associated with one of the major cell type transitions during gastrulation. Shown are relative expression levels of genes, comparing between the source cell population and its progeny (columns). Dashed boxes mark the enriched, early-specialized lineages. Selection criteria for genes: (1) minimal gap of 0.5 between largest and second-largest log fold-change along a transition, and (2) second-largest fold-change smaller than 1. (B) Absolute expression of highly variable TFs in the mesoderm. Columns represent individual MCs following hierarchical clustering. (C) Temporal expression of key TFs within the mesoderm. For each TF, we identified the MCs with maximum expression in the mesoderm (see STAR Methods). The inferred TF expression kinetics along trajectories leading to such MCs are shown. Error bars reflect SD of expression for traced-back MCs at each time point. y axis, absolute expression. (D) R2 values for the best regression model using a pair of mesodermal TFs versus the best model using only one TF, trained on non-TFs with the highest variance in the mesoderm, and validated using permutation tests (see Figure S5). (E and F) Prominent examples of target genes that can be accurately fitted in the mesoderm (R2 > 0.8) using a single TF (E) or a linear combination of two TFs (F). Each dot represents a MC, axes represent absolute expression of TFs and predicted gene (x and y, respectively).
Figure S5
Figure S5
Supporting information, related to Figure 5 (A) Maximal log2 base expression within the mesoderm for most variable TFs (B) Permutation test to control for overfitting in linear regression analysis. Shown in red is the maximal gain in R2 when using two TFs instead of one TF to predict target gene expression. Boxes represent the maximal gain in R2 after fixing for each target the best-fitting single TF and using randomly shuffled TF vectors for the second variable. Random shuffling was repeated 100 times. (C) Examples of highly variable mesodermal genes with poor predictability based on linear regression with one TF, but strongly improved R2 values when using two TFs as explanatory variables. Shown is gene expression of target versus either one of the two TFs, or the combination of both.
Figure S6
Figure S6
Supporting information, related to Figure 6 (A) Color coded expression for Foxc1 and Foxc2 per time and MC, plotted along inferred flows. (B) Images of representative chimera and tetraploid embryos (GFP, phase contrast and overlay). Scale bar = 200um (except DKO chimera, where 100um). On the right, flow cytometry side-scatter width (SSC-W) plotted against GFP fluorescence intensity for each cell (after applying logical transformation from R flowcore package) (Ellis et al., 2020). Cells above the upper GFP threshold were classified as mESC derived, and cells below the lower threshold as host cells. Cells in between the thresholds (classified as unclear) were excluded from further analysis. (C) Chimera DKO versus host differential expression karyogram. Shown is fold-change between all DKO and host cells organized by chromosome position ((105+eg(KO))/(105+eg(host))). On the right, chromosomes 1, 7 and 8 are highlighted. Injected embryonic stem cells display (i) loss of imprinting of the Igf2/H19 locus (chromosome 7), (ii) a trisomy chromosome 8 and (iii) possible monosomy of the distal part of chromosome 1.
Figure 6
Figure 6
Foxc1/Foxc2 loss delays embryonic mesoderm and inhibits paraxial program (A) Experimental scheme for the generation and analysis of Foxc1/2 double knockout (DKO) chimera embryos. (B) Gene targeting design and validation for Foxc1/2 DKO, both are single-exon genes and the entire coding sequence was deleted in a biallelic manner. (C) DKO mesoderm (meso) cells are developmentally retarded as compared to their matched host cells. The cumulative distribution of nearest neighbor wild-type intrinsic ranks was calculated separately for DKO and host cells (green and black lines, respectively) in each chimeric embryo. Similar analysis shows no significant delay in the ectoderm (ecto) and endoderm (endo) cells. Shown are two representative embryos, with Kolmogorov-Smirnov D statistics and p value highlighted for each (see also Figure S7). (D) Fractions of cell types per embryo. Black, blue, and green symbols, represent host, isogenic control, and DKO cells (respectively), connected by a vertical line for each chimera embryo. Embryos were assigned a transcriptional rank according to the most similar wild-type embryo based on host cells only. Grey dots represent individual embryos of the wild-type model, and shaded area represents the moving average for wild-type embryos and moving SD (window size = 9). (E) Relative expression of the most significant differentially expressed genes in the embryonic mesoderm between DKO and matched wild-type embryo cells, shown either per embryo (numbered 1–7 according to transcriptional rank from “youngest” to “oldest”), or across cells per cell type (see STAR Methods for selection criteria). (F) Absolute expression of key genes per embryo, for injected mESC-derived versus host embryonic mesoderm cells, relative to smoothed wild-type expression (black line, moving average length = 11). Shaded area corresponds to moving SD across neighboring embryos (window length = 11). Units represent UMIs per million UMIs. See also Figure S6.
Figure S7
Figure S7
Analysis of tetraploid complemented embryos and supporting information, related to Figure 6 (A) Cumulative distribution of nearest neighbor wild-type intrinsic ranks calculated separately for DKO and host cells (green and black lines, respectively) for each chimeric embryo, with Kolmogorov-Smirnov D statistic and p value. (B) Scatterplot of Kolmogorov-Smirnov D statistics for DKO and control isogenic chimeras demonstrating mesoderm specific temporal retardation in the Foxc1/2 chimeras. (C) Relative expression between control isogenic mESC and host in chimeric embryos of genes associated with the DKO phenotype (as in Figure 6E), shown either per embryo (numbered 1-4 according to transcriptional rank, from ‘youngest’ to ‘oldest’), or across cells per cell type. (D) Cumulative distribution of nearest neighbor wild-type intrinsic ranks calculated for the embryonic compartment of DKO and isogenic control tetraploid embryos (4N; green and blue, respectively). (E) Relative cell type distributions for each embryo calculated for the tetraploid (4N) complemented embryos (arranged from left to right according to intrinsic rank). (F) Comparison of gene expression of bulk epiblast and early NM between Foxc1/2 DKO cells and host cells (or wild-type embryo cells in the case of tetraploid embryos) demonstrating only minor changes in the DKO derived cells in these populations. Highlighted are genes with high differential expression between DKO cells and host/wt cells (log2 fold change > 1.5, red) as well as differentially expressed genes in the embryonic mesoderm as shown in Figure 6E (purple).
Figure 7
Figure 7
Acquisition of morphological and transcriptional traits during gastrulation (A) Staged traces of representative embryos highlighting the major phenotypical alterations during gastrulation and up to somitogenesis. Boxplot indicating the distribution of calculated developmental time (Et) per embryo according to morphological classification (see Figure S1B for complete embryo compendium). Boxes show interquartile range (IQR) with median. Whisker length corresponds to 1.5 IQR or the distance to the extremal value of the distribution if within 1.5 IQR. (B) Cell type distribution per embryo, arranged according to intrinsic rank and separated into the 13 age groups. (C) Complete flow model showing all cell types and major predicted transitions. Map “altitude” represents the degree of specification of each cell type, from shallow “basins” (e.g., epiblast and NM) to deep “canyons” (e.g., ExEn and blood).

Comment in

References

    1. Ahuja R.K., Magnanti T.L., Orlin J.B. Prentice Hall; 1993. Network Flows: Theory, Algorithms and Applications.
    1. Argelaguet R., Clark S.J., Mohammed H., Stapel L.C., Krueger C., Kapourani C.A., Imaz-Rosshandler I., Lohoff T., Xiang Y., Hanna C.W. Multi-omics profiling of mouse gastrulation at single-cell resolution. Nature. 2019;576:487–491. - PMC - PubMed
    1. Arkell R.M., Tam P.P. Initiating head development in mouse embryos: integrating signalling and transcriptional activity. Open Biol. 2012;2:120030. - PMC - PubMed
    1. Arnold S.J., Robertson E.J. Making a commitment: cell lineage allocation and axis patterning in the early mouse embryo. Nat. Rev. Mol. Cell Biol. 2009;10:91–103. - PubMed
    1. Balmer S., Nowotschin S., Hadjantonakis A.K. Notochord morphogenesis in mice: Current understanding & open questions. Dev. Dyn. 2016;245:547–557. - PMC - PubMed

Publication types