

Predicting Lymph Node Metastasis in Non-small Cell Lung Cancer: Prospective External and Temporal Validation of the HAL and HOMER Models
- PMID: 33932466
- PMCID: PMC8727846
- DOI: 10.1016/j.chest.2021.04.048
Predicting Lymph Node Metastasis in Non-small Cell Lung Cancer: Prospective External and Temporal Validation of the HAL and HOMER Models
Abstract
Background: Two models, the Help with the Assessment of Adenopathy in Lung cancer (HAL) and Help with Oncologic Mediastinal Evaluation for Radiation (HOMER), were recently developed to estimate the probability of nodal disease in patients with non-small cell lung cancer (NSCLC) as determined by endobronchial ultrasound-transbronchial needle aspiration (EBUS-TBNA). The objective of this study was to prospectively externally validate both models at multiple centers.
Research question: Are the HAL and HOMER models valid across multiple centers?
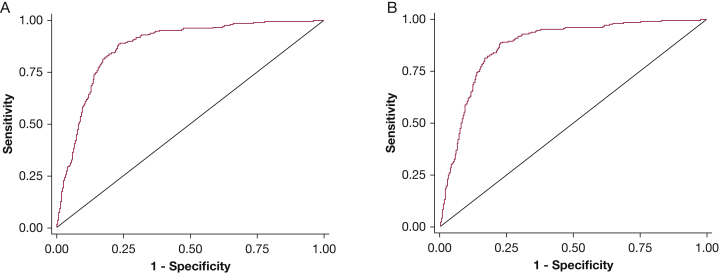
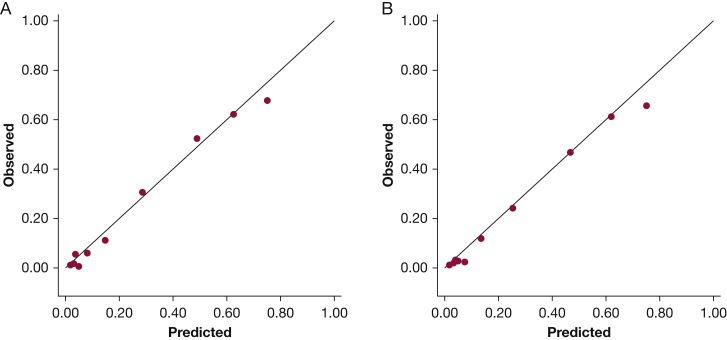
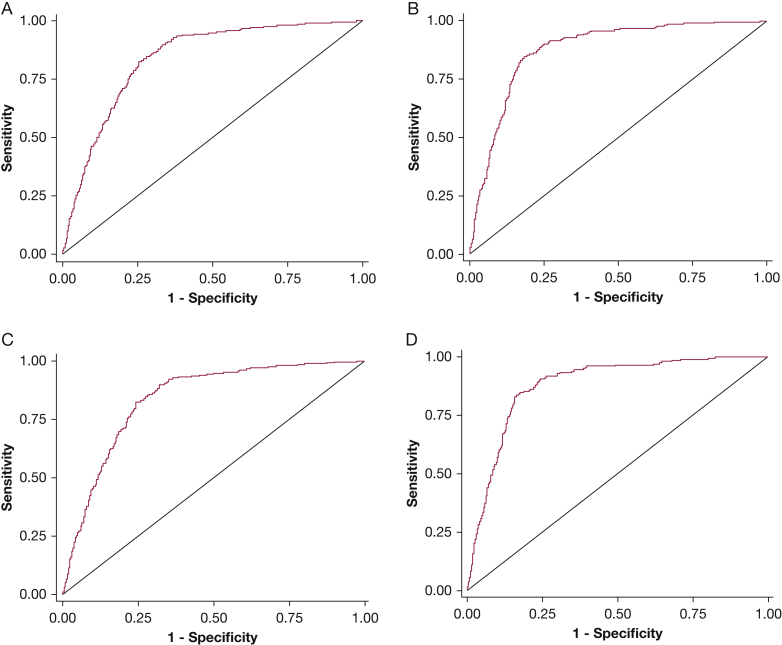
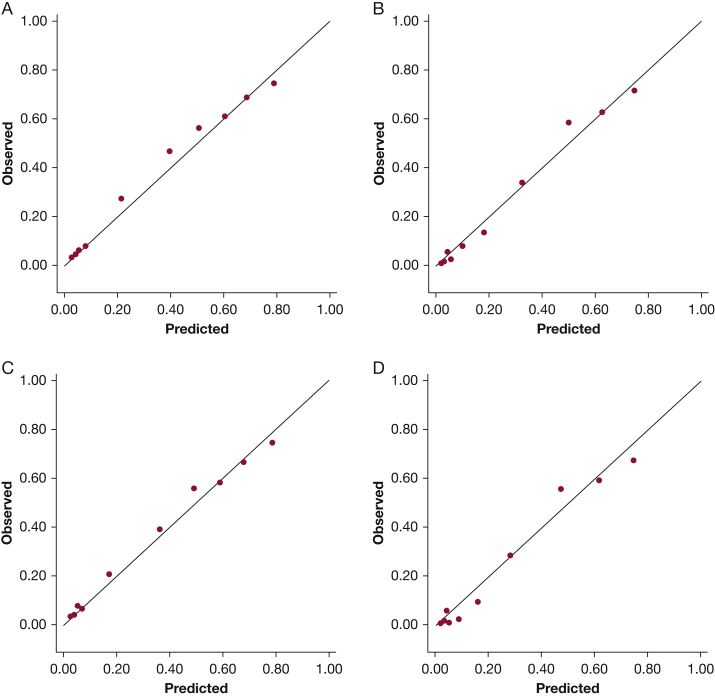
Study design and methods: This multicenter prospective observational cohort study enrolled consecutive patients with PET-CT clinical-radiographic stages T1-3, N0-3, M0 NSCLC undergoing EBUS-TBNA staging. HOMER was used to predict the probability of N0 vs N1 vs N2 or N3 (N2|3) disease, and HAL was used to predict the probability of N2|3 (vs N0 or N1) disease. Model discrimination was assessed using the area under the receiver operating characteristics curve (ROC-AUC), and calibration was assessed using the Brier score, calibration plots, and the Hosmer-Lemeshow test.
Results: Thirteen centers enrolled 1,799 patients. HAL and HOMER demonstrated good discrimination: HAL ROC-AUC = 0.873 (95%CI, 0.856-0.891) and HOMER ROC-AUC = 0.837 (95%CI, 0.814-0.859) for predicting N1 disease or higher (N1|2|3) and 0.876 (95%CI, 0.855-0.897) for predicting N2|3 disease. Brier scores were 0.117 and 0.349, respectively. Calibration plots demonstrated good calibration for both models. For HAL, the difference between forecast and observed probability of N2|3 disease was +0.012; for HOMER, the difference for N1|2|3 was -0.018 and for N2|3 was +0.002. The Hosmer-Lemeshow test was significant for both models (P = .034 and .002), indicating a small but statistically significant calibration error.
Interpretation: HAL and HOMER demonstrated good discrimination and calibration in multiple centers. Although calibration error was present, the magnitude of the error is small, such that the models are informative.
Keywords: endobronchial ultrasound; lung cancer; lung cancer staging; mediastinal adenopathy.
Copyright © 2021. Published by Elsevier Inc.
Figures
References
-
- Silvestri G.A., Gonzalez A.V., Jantz M.A., et al. Methods for staging non-small cell lung cancer. In: Diagnosis and Management of Lung Cancer, 3rd ed: American College of Chest Physicians evidence-based clinical practice guidelines. Chest. 2013;143(5 Suppl):e211S–e250S. - PubMed
-
- Howington J.A., Blum M.G., Chang A.C., Balekian A.A., Murthy S.C. Treatment of stage I and II non-small cell lung cancer. In: Diagnosis and Management of Lung Cancer, 3rd ed: American College of Chest Physicians evidence-based clinical practice guidelines. Chest. 2013;143(5 Suppl):e278S–e313S. - PubMed
-
- Reck M., Rabe K.F. Precision diagnosis and treatment for advanced non-small-cell lung cancer. N Engl J Med. 2017;377(9):849–861. - PubMed
-
- Ramnath N., Dilling T.J., Harris L.J., et al. Treatment of stage III non-small cell lung cancer. In: Diagnosis and Management of Lung Cancer, 3rd ed: American College of Chest Physicians evidence-based clinical practice guidelines. Chest. 2013;143(5 Suppl):e314S–e340S. - PubMed
-
- Ost D.E., Jim Yeung S.C., Tanoue L.T., Gould M.K. Clinical and organizational factors in the initial evaluation of patients with lung cancer. In: Diagnosis and Management of Lung Cancer, 3rd ed: American College of Chest Physicians evidence-based clinical practice guidelines. Chest. 2013;143(5 Suppl):e121S–e141S. - PMC - PubMed
Publication types
MeSH terms
Grants and funding
LinkOut - more resources
Full Text Sources
Other Literature Sources
Medical
