. 2021 Nov;148(5):1281-1292.
doi: 10.1016/j.jaci.2021.04.021. Epub 2021 Apr 29.

Single-cell transcriptomics applied to emigrating cells from psoriasis elucidate pathogenic versus regulatory immune cell subsets

Affiliations

Single-cell transcriptomics applied to emigrating cells from psoriasis elucidate pathogenic versus regulatory immune cell subsets

Jaehwan Kim et al. J Allergy Clin Immunol. 2021 Nov.

Abstract

Background: In previous human skin single-cell data, inflammatory cells constituted only a small fraction of the overall cell population, such that functional subsets were difficult to ascertain.

Objective: Our aims were to overcome the aforesaid limitation by applying single-cell transcriptomics to emigrating cells from skin and elucidate ex vivo gene expression profiles of pathogenic versus regulatory immune cell subsets in the skin of individuals with psoriasis.

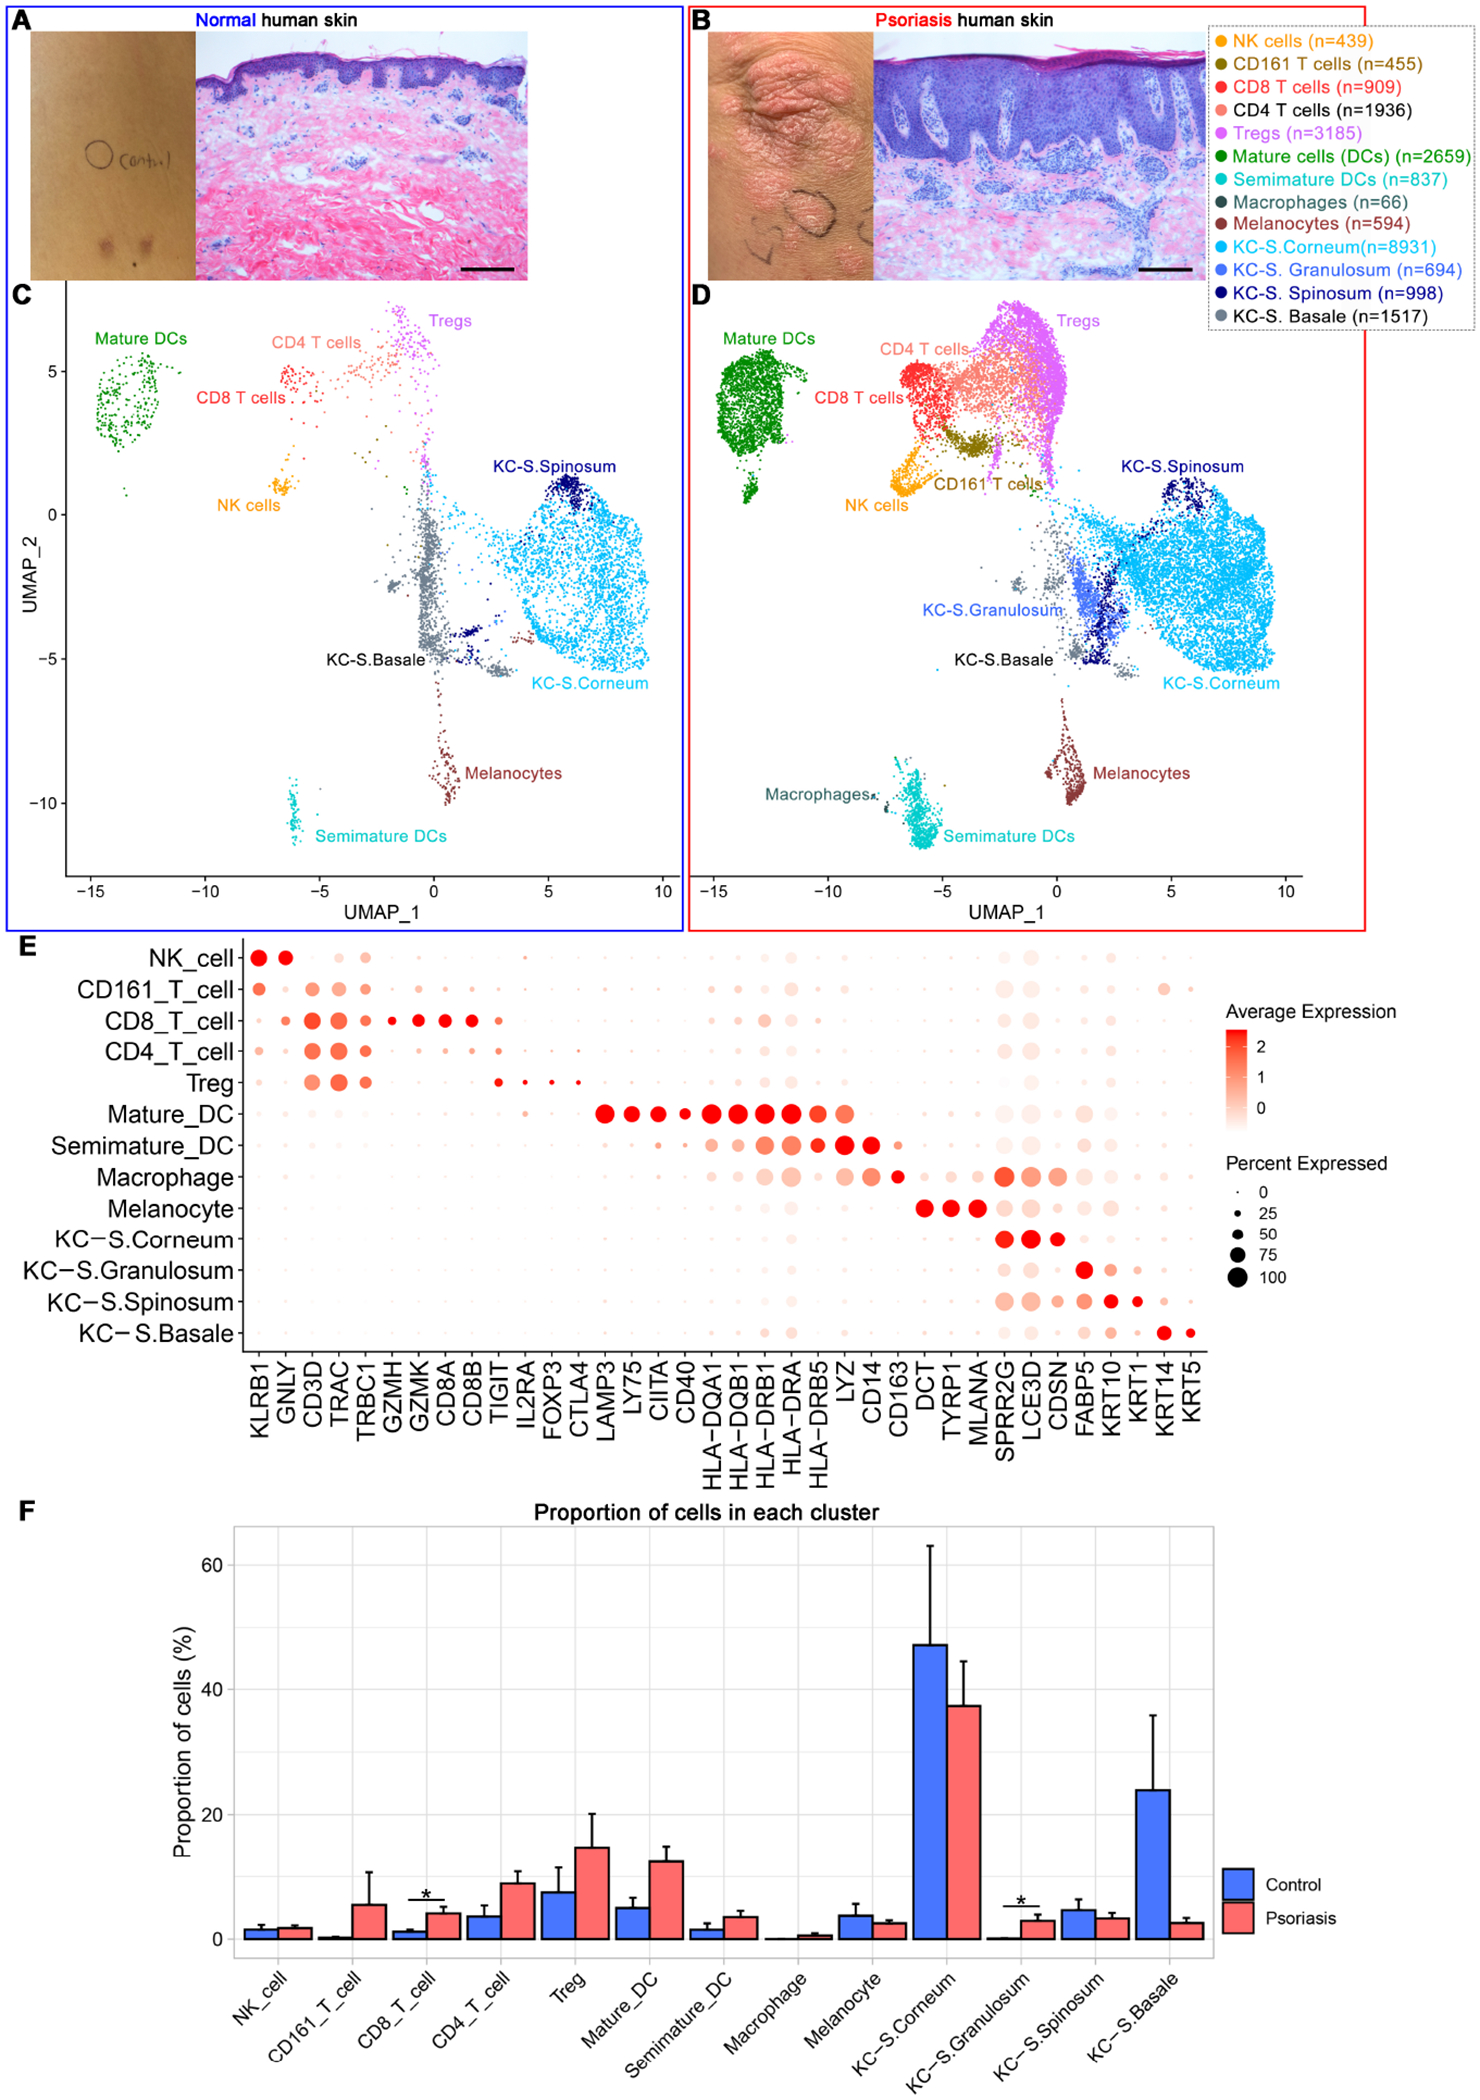
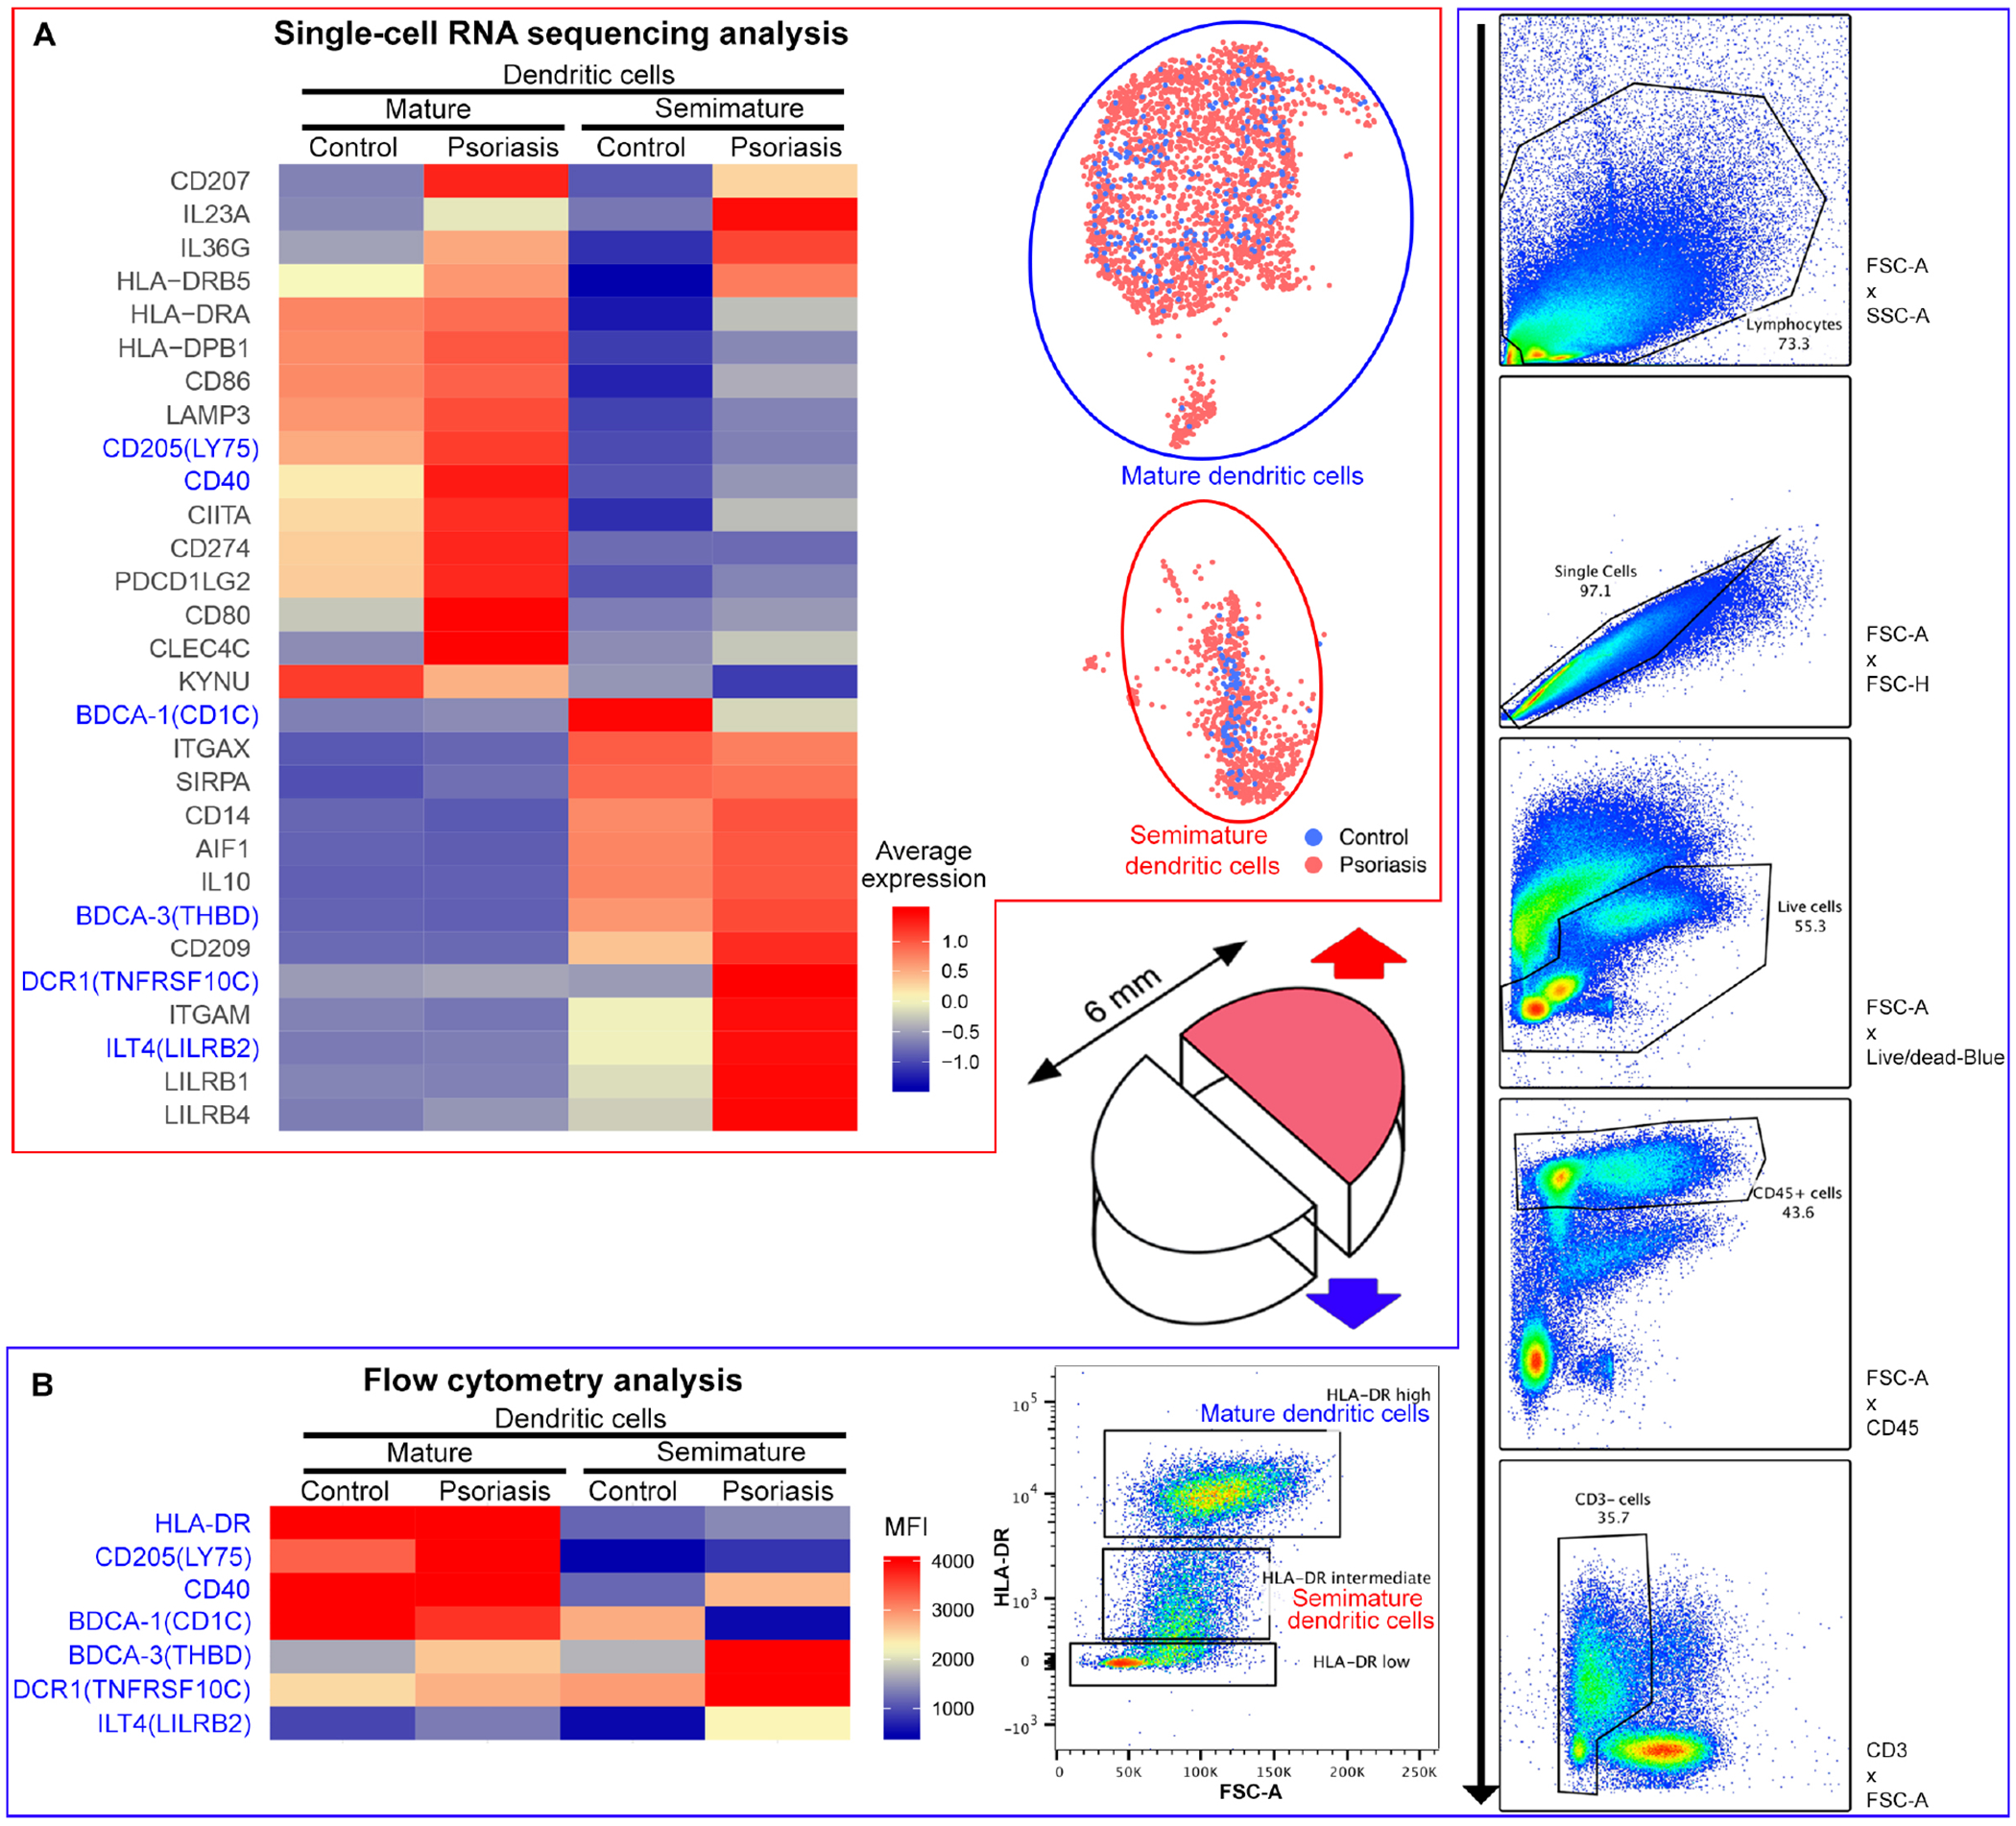
Methods: We harvested emigrating cells from human psoriasis skin after incubation in culture medium without enzyme digestion or cell sorting and analyzed cells with single-cell RNA sequencing and flow cytometry simultaneously.

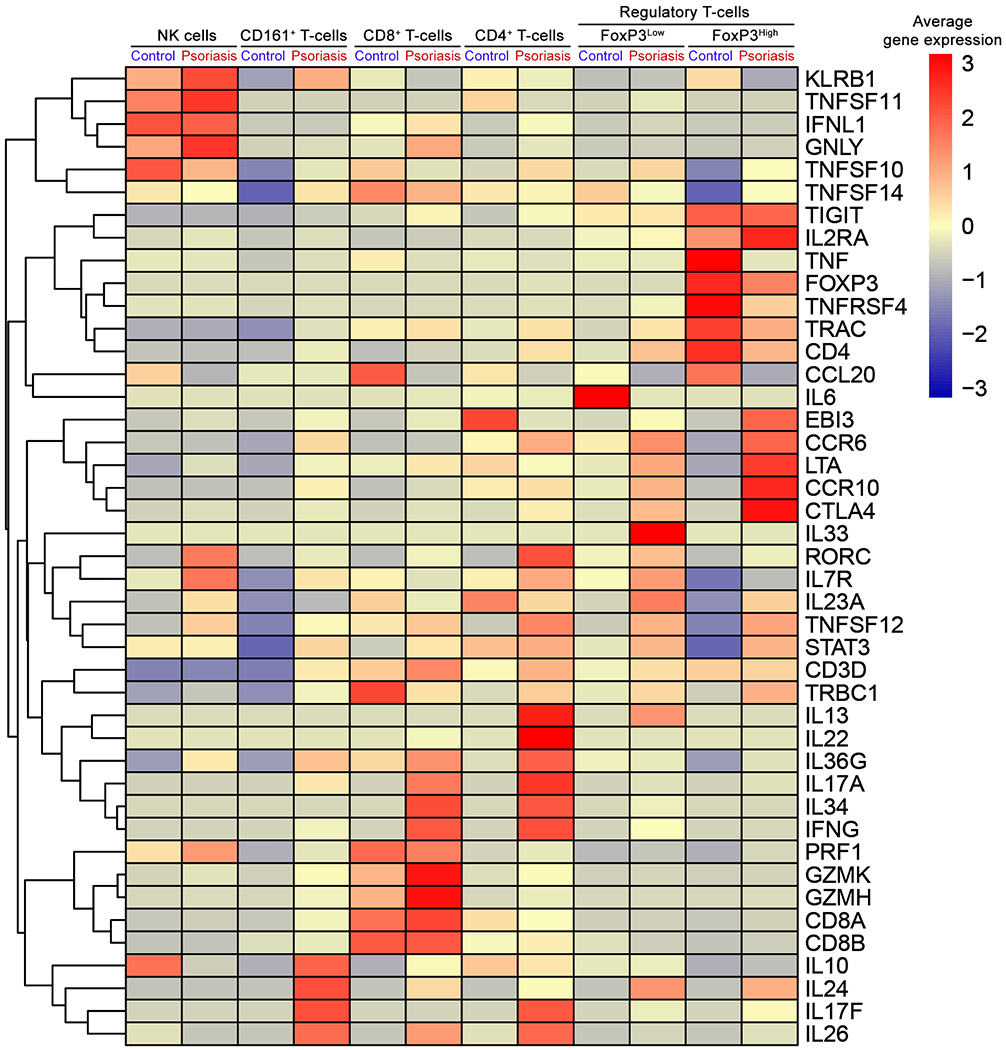
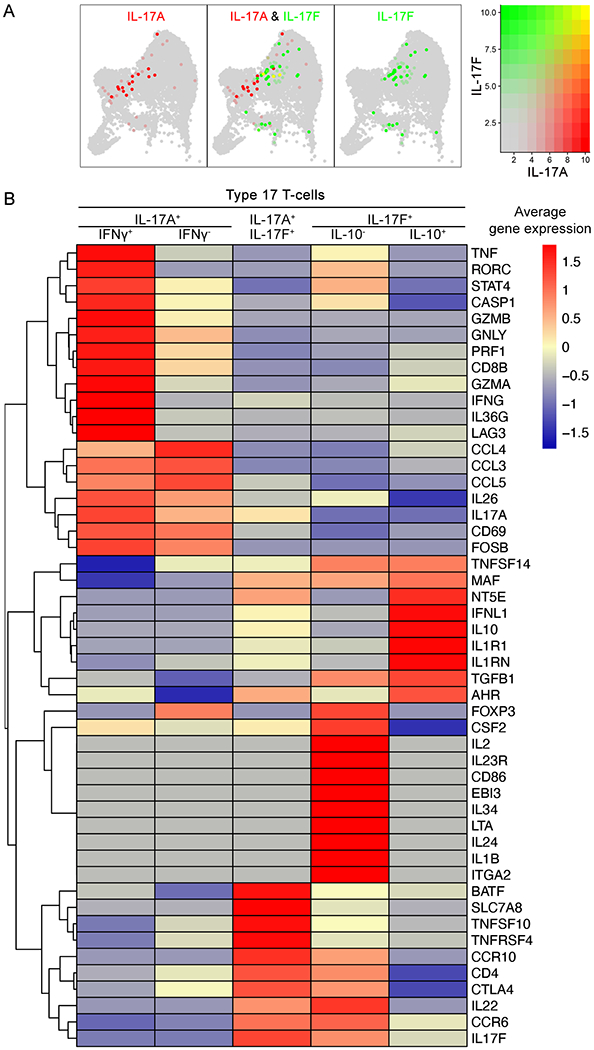
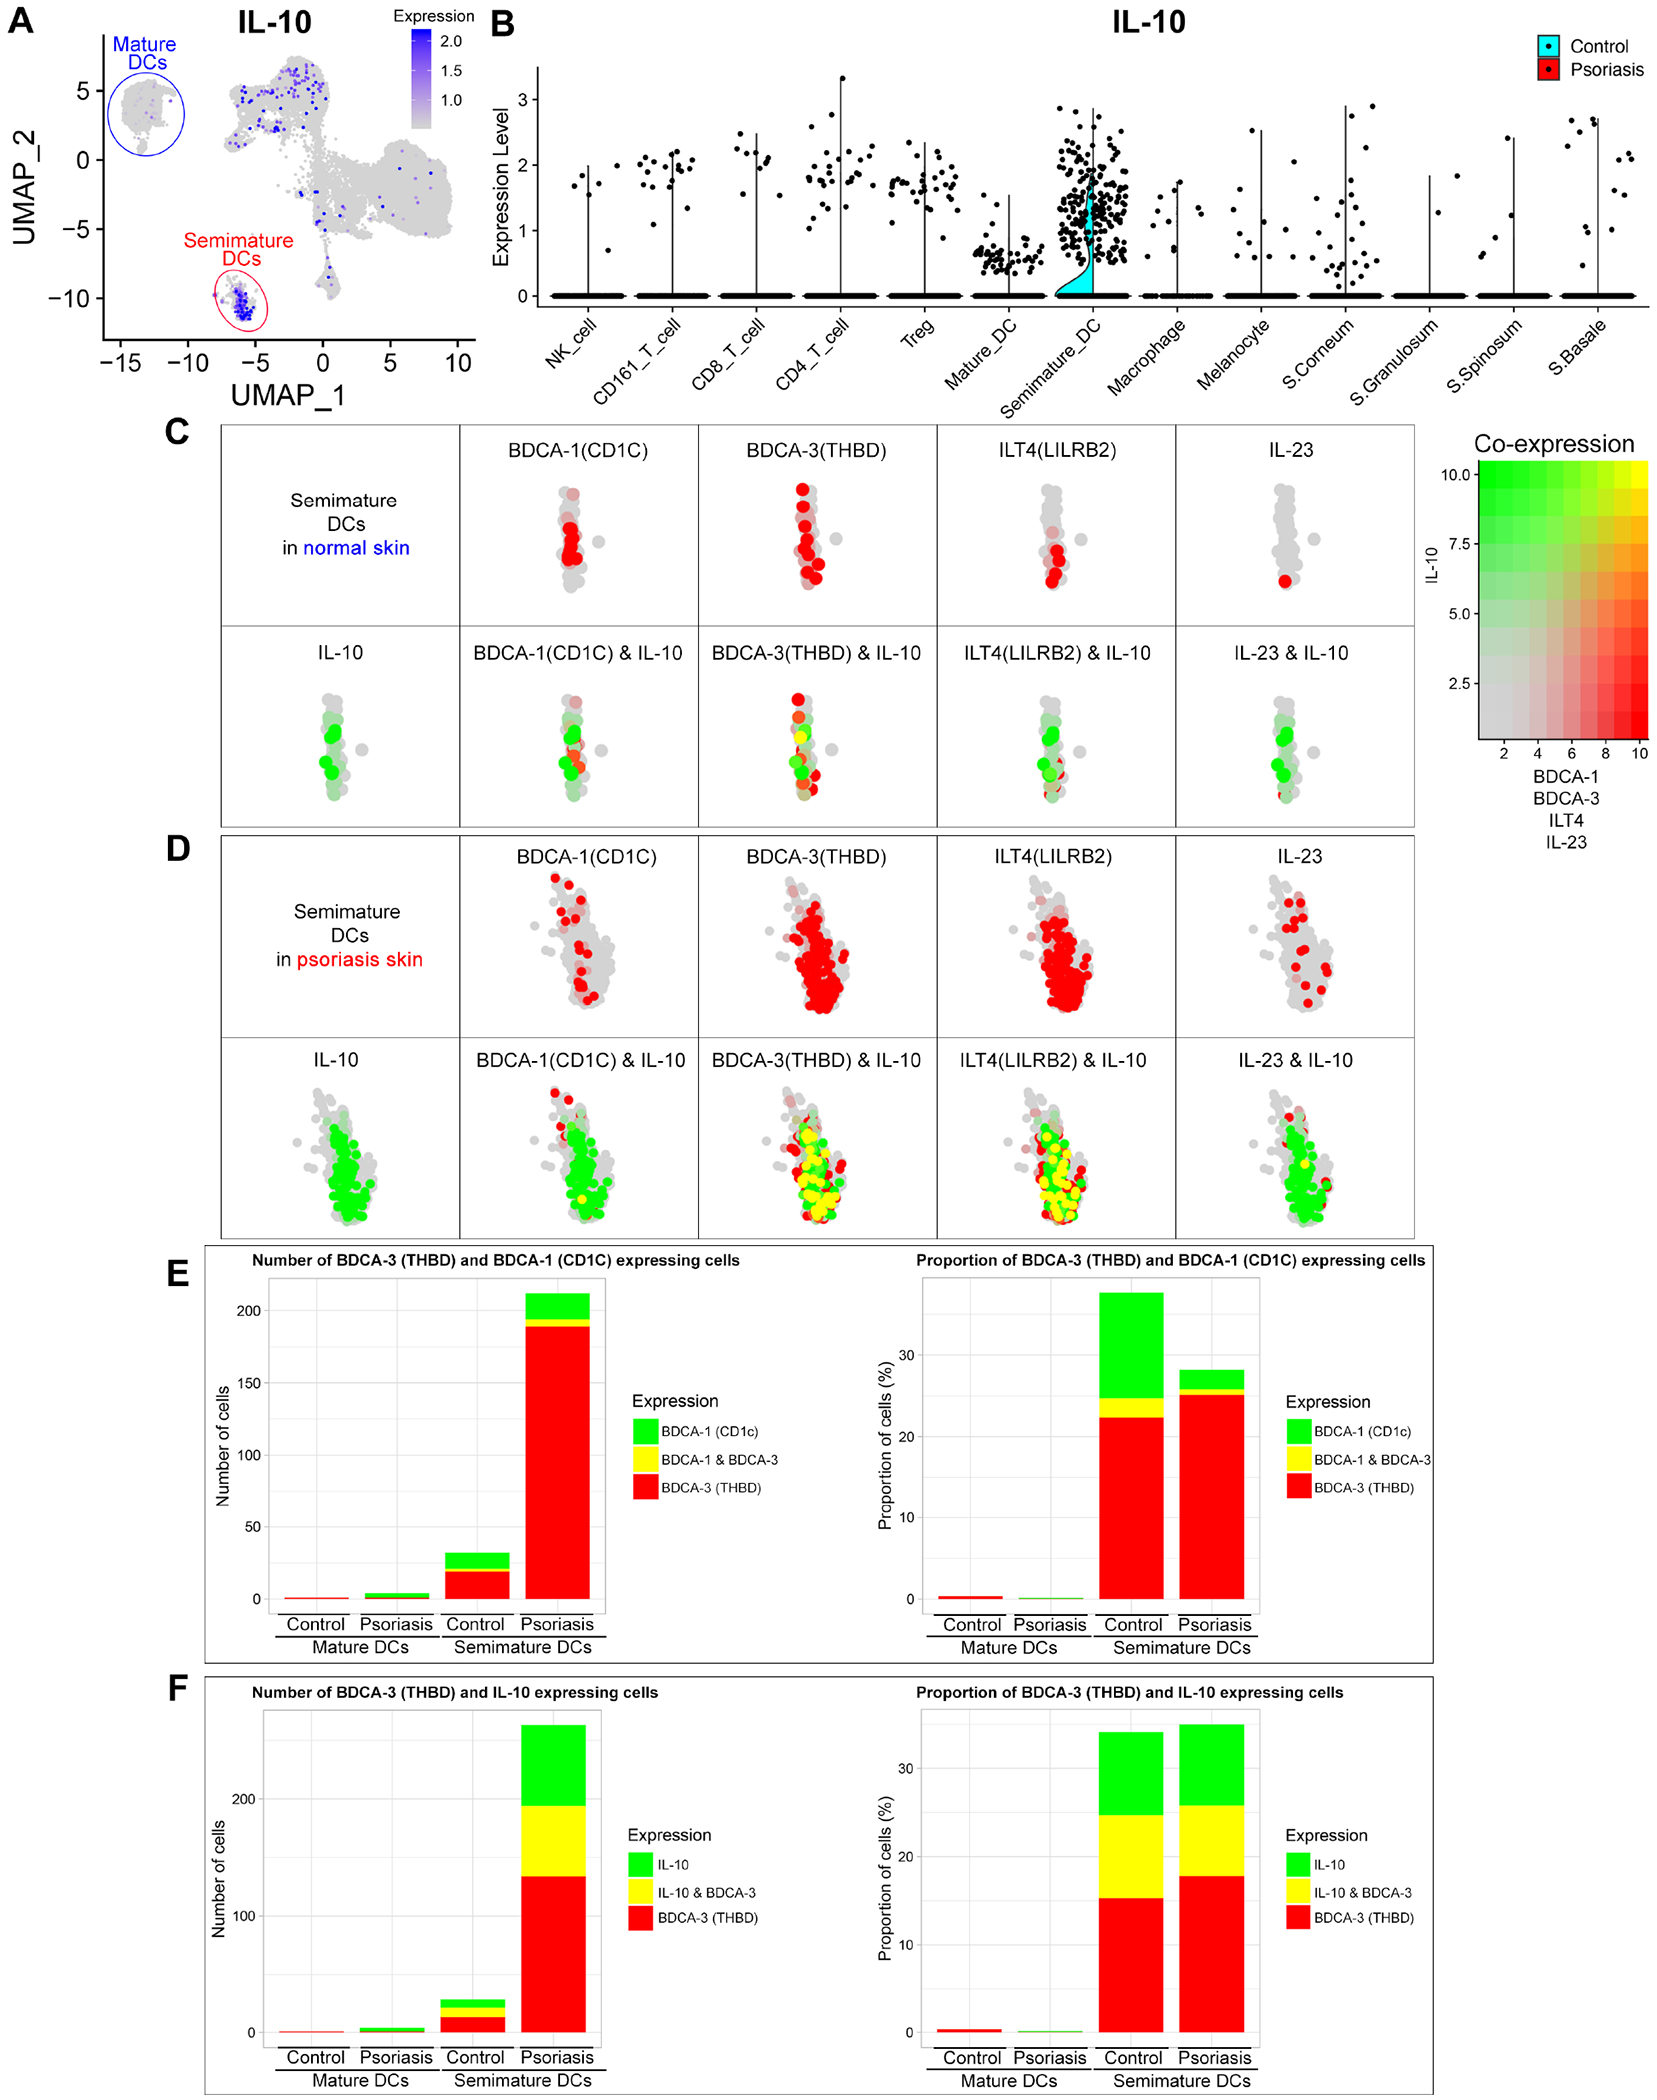
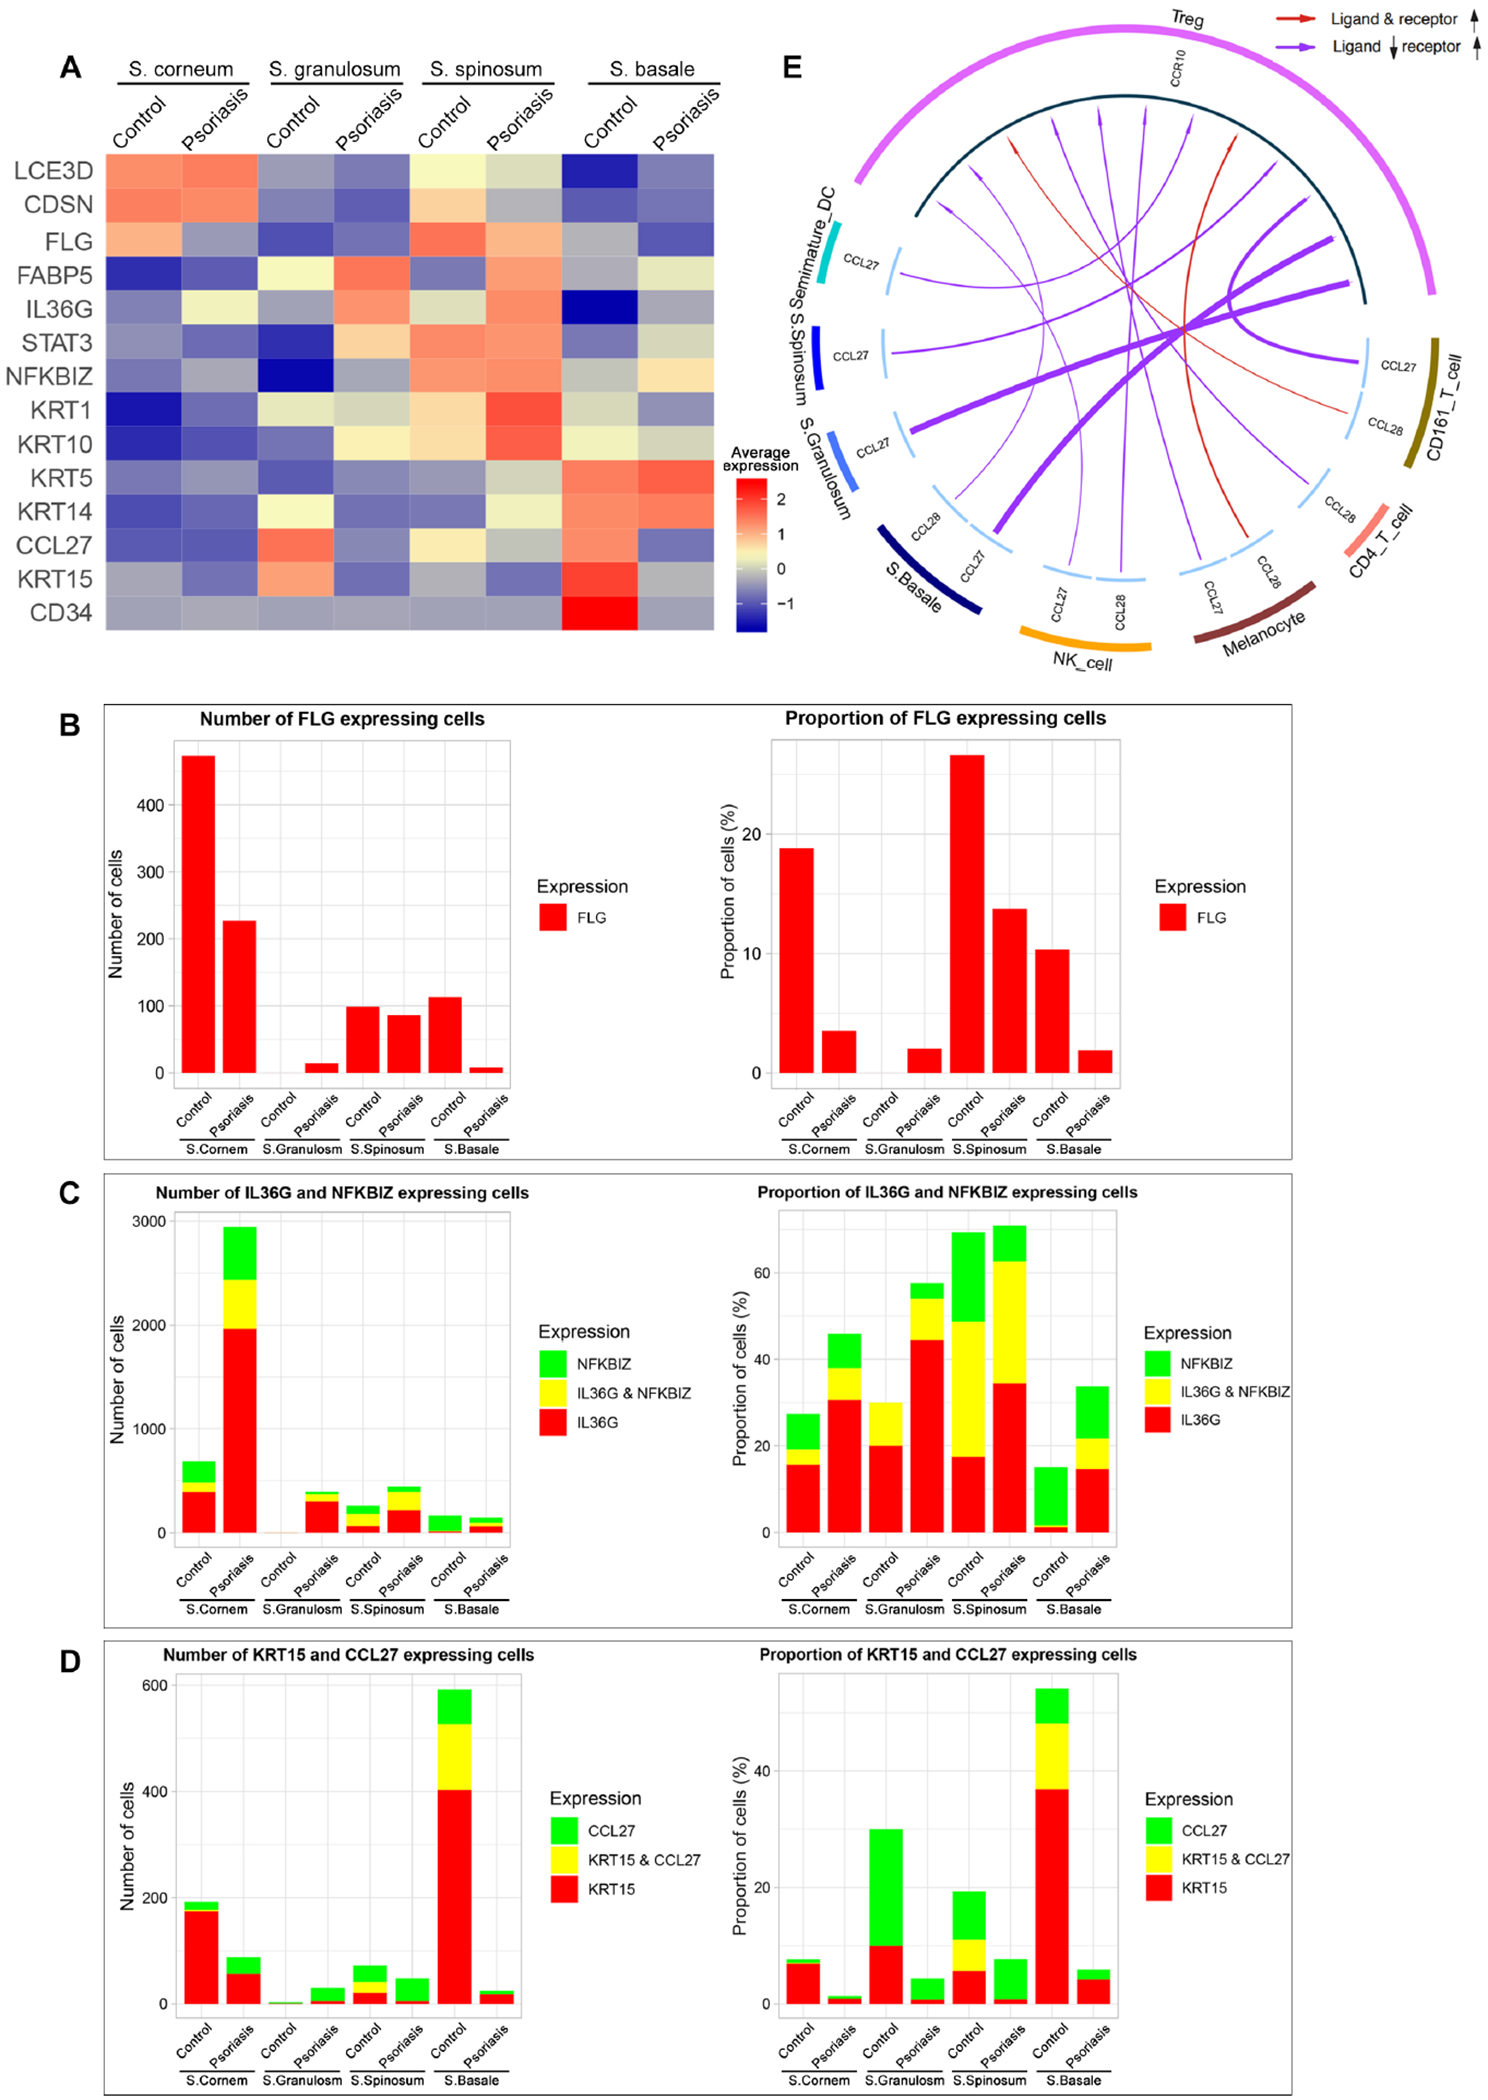
Results: Unsupervised clustering of harvested cells from psoriasis skin and control skin identified natural killer cells, T-cell subsets, dendritic cell subsets, melanocytes, and keratinocytes in different layers. Comparison between psoriasis cells and control cells within each cluster revealed that (1) cutaneous type 17 T cells display highly differing transcriptome profiles depending on IL-17A versus IL-17F expression and IFN-γ versus IL-10 expression; (2) semimature dendritic cells are regulatory dendritic cells with high IL-10 expression, but a subset of semimature dendritic cells expresses IL-23A and IL-36G in psoriasis; and (3) CCL27-CCR10 interaction is potentially impaired in psoriasis because of decreased CCL27 expression in basal keratinocytes.

Conclusion: We propose that single-cell transcriptomics applied to emigrating cells from human skin provides an innovative study platform to compare gene expression profiles of heterogenous immune cells in various inflammatory skin diseases.

Keywords: Psoriasis; T cells; dendritic cells; emigrating cells; keratinocytes; single-cell RNA sequencing.


Figures

Figure 1.
Figure 1.. Single-cell transcriptomic profiling of leukocytes and keratinocytes in human psoriasis and control skin.
Clinical & microscopic figures of control (A) and psoriasis skin (B) and their leukocyte & keratinocyte scRNA-seq data presented in the Uniform Manifold Approximation and Projection plot (C and D). (E) Dot plot displaying expression levels of cluster-defining genes. (F) Cell composition of individual samples. Treg, regulatory T-cell; DCs, dendritic cells; KC, keratinocytes, S, Stratum. Scale bar in (A) and (B) = 200 μm, Proportion of cells in (F) = average number of cells in cluster within individual sample / total number of cells within individual sample x 100 (%), Error bar in (F) = Standard Error of Mean.
Figure 2.
Figure 2.. The average gene expression within clusters of NK cells and T-cell subsets.
Heatmap of scRNA-seq analysis illustrates the average gene expression within clusters of NK cell and T-cell subsets, split by psoriasis and control. Regulatory T-cell cluster is divided into cells with FoxP3 expression high (FoxP3High) and cells with FoxP3 expression low (FoxP3Low) using a cut-off value of 1. Genes with similar expression patterns are linked by a complete linkage method.
Figure 3.
Figure 3.. The average gene expression of cutaneous Type 17 T-cell (T17 cell) subsets.
(A) IL-17A (red), IL-17F (green) and IL-17A/IL17F co-expression (yellow) within T-cell subset clusters visualized in low-dimensional space. (B) Heatmap of scRNA-seq analysis illustrates the average gene expression of T17 cell subsets. Genes with similar expression patterns are linked by a complete linkage method.
Figure 4.
Figure 4.. Simultaneous scRNA-seq and flow cytometry analyses define transcriptomic profiles of mature vs. semimature dendritic cells.
(A) Heatmap of scRNA-seq analysis illustrates the average gene expression within mature vs. semimature DC clusters, split by psoriasis and control. (B) Heatmap of flow cytometry analysis illustrates Median Fluorescence Intensity (MFI) of HLA-DRHigh (mature) or HLA-DRLow (semimature) CD45+ CD3 HLA-DR+ dendritic cells in control and psoriasis skin. Consistent findings between scRNA-seq and flow cytometry analyses are marked in blue.
Figure 5.
Figure 5.. IL-10, BDCA-1 (CD1C), BDCA-3 (THBD), LILRB2 (ILT4) and IL-23 expression in mature dendritic cells (DCs) and semimature DCs.
IL-10 expression in total scRNA-seq data is visualized in low-dimensional space (A) and violin plot of each immune cell cluster (B). Co-expression of IL-10 & BDCA-1, BDCA-3, LILRB2 or IL-23 in normal skin semimature DCs (C) and psoriasis skin semimature DCs (D) is visualized in low-dimensional space. Cells with expression of BDCA-3 & BDCA-1 (E) and BDCA-3 & IL-10 (F) within each cluster of mature and semimature DCs in normal and psoriasis skin are quantified by number of cells and proportion of cells. Proportion of cells = number of target gene expressing cells within cluster / total number of cells within cluster x 100 (%).
Figure 6.
Figure 6.. Gene expression within keratinocyte clusters and CCL27 (keratinocyte)–CCR10 (Treg) interactions.
(A) Heatmap of scRNA-seq analysis illustrates the average gene expression within clusters of keratinocytes (KCs) in Stratum (S.) corneum, S. granulosum, S. spinosum and S. basale, split by psoriasis and control. Cells with expression of FLG (B), IL-36G & NFKBIZ (C) and KRT15 & CCL27 (D) within each layer of KCs in control and psoriasis epidermis are quantified by number of cells and proportion of cells. Proportion of cells = number of target gene expressing cells within cluster / total number of cells within cluster x 100 (%). (E) CCL27/CCL28-CCR10 interaction in psoriasis compared to control highlights decreased CCL27 in basal keratinocytes interacting with CCR10 in Tregs.

References

    1. Kim J, Krueger JG. Highly Effective New Treatments for Psoriasis Target the IL-23/Type 17 T Cell Autoimmune Axis. Annu Rev Med 2017; 68:255–69. - PubMed
    1. Wright JF, Guo Y, Quazi A, Luxenberg DP, Bennett F, Ross JF, et al. Identification of an interleukin 17F/17A heterodimer in activated human CD4+ T cells. Journal of Biological Chemistry 2007; 282:13447–55. - PubMed
    1. Sugiyama H, Gyulai R, Toichi E, Garaczi E, Shimada S, Stevens SR, et al. Dysfunctional Blood and Target Tissue CD4+CD25high Regulatory T Cells in Psoriasis: Mechanism Underlying Unrestrained Pathogenic Effector T Cell Proliferation. The Journal of Immunology 2005; 174:164–73. - PMC - PubMed
    1. Kim J, Lee J, Gonzalez J, Fuentes-Duculan J, Garcet S, Krueger JG. Proportion of CD4(+)CD49b(+)LAG-3(+) Type 1 Regulatory T Cells in the Blood of Psoriasis Patients Inversely Correlates with Psoriasis Area and Severity Index. J Invest Dermatol 2018. - PubMed
    1. Gulati N, Suárez-Fariñas M, da Rosa JC, Krueger JG. Psoriasis is characterized by deficient negative immune regulation compared to transient delayed-type hypersensitivity reactions. F1000Research 2015; 4. - PMC - PubMed

Publication types