. 2021 Jul:43:101988.
doi: 10.1016/j.redox.2021.101988. Epub 2021 Apr 24.

Nicotinamide provides neuroprotection in glaucoma by protecting against mitochondrial and metabolic dysfunction

Affiliations

Nicotinamide provides neuroprotection in glaucoma by protecting against mitochondrial and metabolic dysfunction

James R Tribble et al. Redox Biol. 2021 Jul.

Abstract

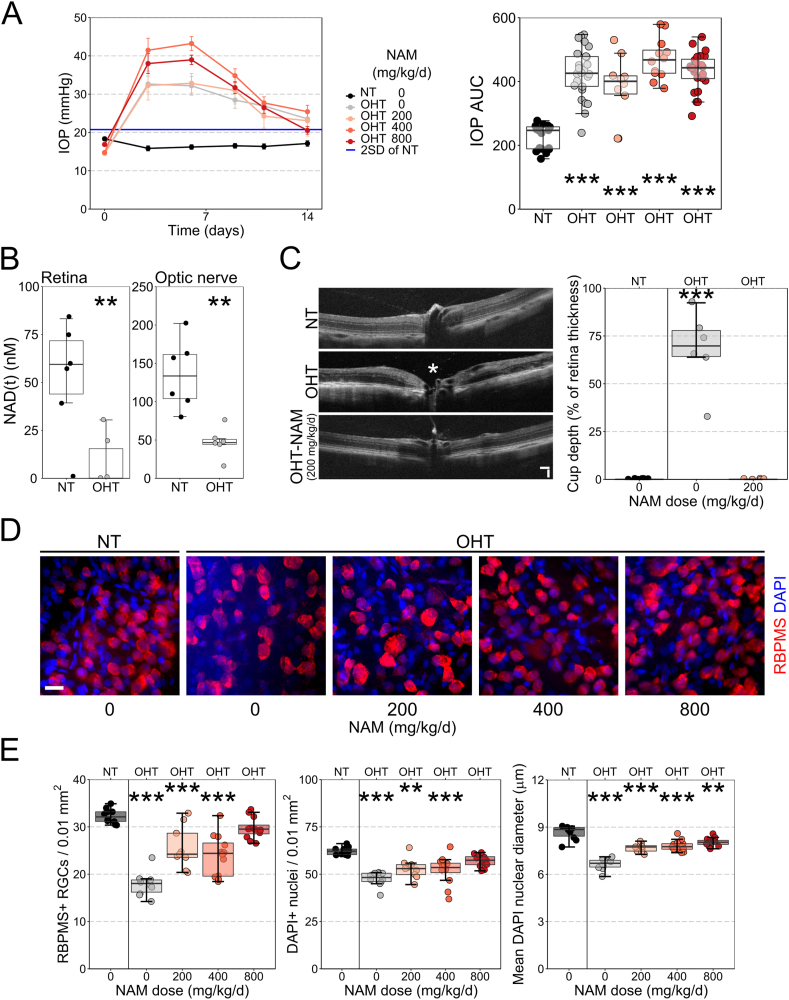
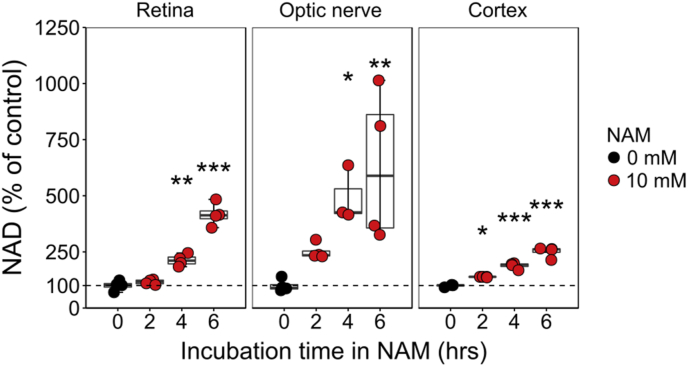
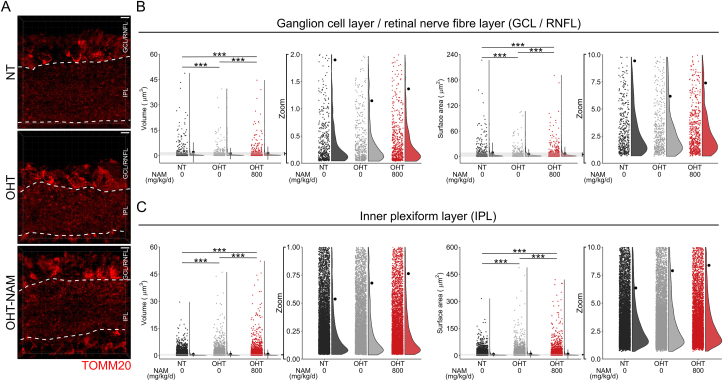
Nicotinamide adenine dinucleotide (NAD) is a REDOX cofactor and metabolite essential for neuronal survival. Glaucoma is a common neurodegenerative disease in which neuronal levels of NAD decline. We assess the effects of nicotinamide (a precursor to NAD) on retinal ganglion cells (the affected neuron in glaucoma) in normal physiological conditions and across a range of glaucoma relevant insults including mitochondrial stress and axon degenerative insults. We demonstrate retinal ganglion cell somal, axonal, and dendritic neuroprotection by nicotinamide in rodent models which represent isolated ocular hypertensive, axon degenerative, and mitochondrial degenerative insults. We performed metabolomics enriched for small molecular weight metabolites for the retina, optic nerve, and superior colliculus which demonstrates that ocular hypertension induces widespread metabolic disruption, including consistent changes to α-ketoglutaric acid, creatine/creatinine, homocysteine, and glycerophosphocholine. This metabolic disruption is prevented by nicotinamide. Nicotinamide provides further neuroprotective effects by increasing oxidative phosphorylation, buffering and preventing metabolic stress, and increasing mitochondrial size and motility whilst simultaneously dampening action potential firing frequency. These data support continued determination of the utility of long-term nicotinamide treatment as a neuroprotective therapy for human glaucoma.

Keywords: Glaucoma; Metabolism; Metabolomics; Mitochondria; Nicotinamide; Retina; Retinal ganglion cell.


Conflict of interest statement

The authors declare that they have no competing interests.

Figures

Image 1
Graphical abstract
Fig. 1
Fig. 1
Nicotinamide provides neuroprotection in a rat bead model of ocular hypertension. (A) Ocular hypertension (OHT; n = 26 eyes) induced by the magnetic bead injection lead to a significant increase in IOP over control (NT; n = 20 eyes), which persisted for 14 days (greater than 2 standard deviations of NT, blue line). Nicotinamide (NAM) treatment in OHT animals (200, 400, 800 mg/kg/d; n = 10, 12, and 24 eyes respectively) did not lower IOP (as assessed by area under the IOP curve). (B) Following 14 days of sustained OHT, NAD was significantly reduced in both the retina (n = 6) and optic nerve (n = 6) as measured by luminometry-based assays. (C) In vivo OCT imaging demonstrated significant loss of neuroretinal rim following 14 days OHT (n = 7 eyes) compared to NT eyes (n = 9), which was absent in NAM treated rats (n = 8 eyes; measured as the cup depth relative to retinal thickness; loss denoted by white * on example image). (D) RBPMS (RGC specific) and DAPI labelling of the retina demonstrated a dose dependent, significant neuroprotection against RGC loss and RGC nuclear shrinkage at day 14 (E; n = 10 NT retinas, 10 OHT, 9 OHT-NAM (200 mg/kg/d), 12 OHT-NAM (400 mg/kg/d), and 12 OHT-NAM (800 mg/kg/d)).Scale bar = 100 μm in C, 20 μm in D. **P < 0.01, ***P < 0.001. (For interpretation of the references to color in this figure legend, the reader is referred to the Web version of this article.)
Fig. 2
Fig. 2
Nicotinamide protects against axonal and dendritic degeneration. (A) Retinal axotomy explant results in significant RGC death and nuclear shrinkage, at 3 days ex vivo (DEV) with robust protection provided by NAM treated media (B; n = six 0 DEV retinas, six 3 DEV untreated, six 3 DEV-NAM (100 mM), eleven 3 DEV-NAM (500 mM)). (C) β-tubulin labelling reveled a significant increase in axonal varicosities within the retinal nerve fiber layer at 3 DEV, which were robustly protected against by NAM (D; n = six 0 DEV retinas, six 3 DEV untreated, six 3 DEV-NAM (100 mM), six 3 DEV-NAM (500 mM)). (E and F) At 3 DEV significant changes to the complexity of the dendritic arbor were apparent (E; example RGCs labelled by DiOlistics). At 3 DEV there was a loss of branch density (reduction in Sholl AUC), a reduction in dendritic length and field area. NAM treated media provided significant protection against these neurodegenerative features (n = 75 RGCs from ten 0 DEV retinas, 46 RGCs from twelve 3 DEV untreated, 53 RGCs from twelve 3 DEV-NAM (100 mM), 62 RGCs from twelve 3 DEV-NAM (500 mM)). At 3 DEV dendrites display an increased density of varicosities, which was protected against by NAM (F; n = 55 RGCs from 0 DEV retinas, 23 RGCs from 3 DEV untreated, 38 RGCs from 3 DEV-NAM (100 mM), 32 RGCs from 3 DEV-NAM (500 mM)). Scale bar = 20 μm in A, 50 μm in C and E. *P < 0.05, **P < 0.01, ***P < 0.001.
Fig. 3
Fig. 3
Metabolic profiles of retinal ganglion cell related tissues. (A) Seventy three low molecular weight metabolites could be reliably detected in retina (n = 8), optic nerve (n = 8) and superior colliculus (SC; n = 8 hemispheres) of Brown Norway rats. Within tissue correlation of metabolites is demonstrated by a circus plot with linkers between metabolites. The number of significantly correlated metabolites is shown as a bar graph in the outer circle. The SC (pink) showed the greatest degree of within tissue correlation of metabolites. (B) Tissue differences were explored by principle component analysis (PCA) which revealed a clear distinction of tissues predominantly along one component (PC1). (C) NAD and related metabolites NADH and nicotinamide were compared between tissues. The optic nerve was most abundant in NAD, NADH, and nicotinamide but had the lowest NAD:NADH ratio, whilst the retina was comparatively low in nicotinamide, and the SC comparatively low in NAD and NADH. **P < 0.01, ***P < 0.001, NS P > 0.05. (For interpretation of the references to color in this figure legend, the reader is referred to the Web version of this article.)
Fig. 4
Fig. 4
Nicotinamide alters metabolic profile of retinal ganglion cell related tissues. (A) High dose nicotinamide supplementation resulted in small significant decrease in IOP on average in NT eyes (n = 60 NT eyes, 40 NT-NAM (800 mg/kg/d) eyes). (B) BN rats were either untreated (NT) or maintained on NAM for 1 week (NT-NAM, 800 mg/kg/d) before metabolomics analysis of tissue. Unsupervised hierarchical clustering (HC) showed no clear distinction between NAM treated and untreated NT retina metabolic profiles (n = 8 NT retina, 8 NT-NAM), but clear separation in the optic nerve (n = 8 NT optic nerves, 8 NT-NAM) and superior colliculus (n = 8 NT SC hemispheres, 8 NT-NAM; all scaled where red = high correlation, blue = low correlation). Principle components analysis (PCA) showed little discriminating power indicating limited large scale NAM induced changes (NT = black, NT-NAM = red). (C) Comparison of NT and NT-NAM treated tissue revealed a number of significantly changed metabolites in D retina, E optic nerve, and F) superior colliculus (FDR < 0.05; red = increased in NT-NAM, blue = decreased), with the optic nerve the most changed. (G) Comparison of significantly changed metabolites across tissues revealed NAD, NADH, threonine, and glyceric acid (later in retina and optic nerve only) to be commonly increased (Euler plot showing total changed metabolites, with the number of common changed metabolites between tissues denoted in red). (G) HC dendograms and heatmaps (where red = highest value, blue = lowest value by row) demonstrate the clear difference in these metabolites between NAM treated and untreated retina, optic nerve ad superior colliculus. (H) Pathways analysis (KEGG) demonstrated that the changed metabolites (in D-F) resulted in minimal pathway changes of significant impact in the retina, and none in the superior colliculus. In the optic nerve, changes were predicted predominantly to NAD and related metabolite pathways. Pathways are highlighted red where FDR <0.05, and annotated when in conjunction with high impact (i.e. predicted knock-on effects to the pathway); size denotes the number of metabolites within the pathway (scale adjacent). **P < 0.01. (For interpretation of the references to color in this figure legend, the reader is referred to the Web version of this article.)
Fig. 5
Fig. 5
Nicotinamide can be rapidly metabolized to NAD by retina, optic nerve, and brain tissue. Luminometry-based NAD assays on retina, optic nerve and cortex incubated with NAM showed that it can be converted to NAD within hours, increasing with increased exposure, suggesting an increase in the NAD pool (n = 4 retinal replicates where each is composed of 2 pooled retinas, for each time point a sample was taken from each replicate; n = 4 optic nerve replicates where 8 optic nerves were divided in to 1 mm segments to give 16 independent samples for each time point; n = 4 cortex replicates where each replicates is a single cortex hemisphere and for each time point a sample was taken from each replicate). Optic nerve demonstrated the largest increase over control (untreated optic nerve) supporting the metabolomics observations.
Fig. 6
Fig. 6
Nicotinamide prevents metabolic disruption. The metabolic profiles of BN rats following 3 days of OHT (prior to detectable neurodegeneration) were compared to NT controls, and the effects of pretreatment with NAM (800 mg/kg/d) explored (n = 8 retinas, optic nerves and superior colliculus hemispheres for each condition). (A) In the retina, unsupervised hierarchical clustering (HA) demonstrated that samples largely clustered based on exposure to NAM, but with heterogeneity across conditions (heatmap scaled where red = high correlation, blue = low correlation). (B) OHT induced a number of metabolic disturbances with a number of significantly increased metabolites (NT vs OHT; FDR < 0.05; red = increased in NT-NAM, blue = decreased; further shown in HA dendogram and heatmap; red = highest value, blue = lowest value by row); these changes were completely absent in NAM treated retinas (NT-NAM vs OHT-NAM; which controls for NAM specific effects). (C) Pathways analysis (KEGG) demonstrated a number of potentially effected pathways (pathways are highlighted red where FDR < 0.05, and annotated when in conjunction with high predicted impact, size denotes the number of metabolites within the pathway). (D) In the optic nerve, HA revealed clear distinction between NAM treated and untreated samples, irrespective of disease grouping. (E) No metabolites were significantly altered compared to NT following 3 days of OHT (NT vs OHT). (F) While NT-NAM treated optic nerves demonstrated a number of significantly changed metabolites over NT nerves, these effects were lost under OHT as demonstrated by the reversal of a number of these changes (NT-NAM vs OHT-NAM) and the similar profiles of OHT-NAM optic nerves to both OHT and NT nerves (OHT vs OHT-NAM, NT vs OHT-NAM respectively). (G) Comparison of NT-NAM vs OHT-NAM changes against NT vs NT-NAM changes, demonstrated 16 commonly changed metabolites (Euler plot showing total changed metabolites, with the number of common changed metabolites between comparisons denoted in red). HA of these metabolites separated individual NAM treated groups from controls, and plotting the mean abundance of these relative to NT control further highlights NAM specific changes that were reversed under OHT. (H) In the superior colliculus, HA largely distinguished individual groups, suggesting well defined metabolic profiles per condition. (I) In the SC, OHT resulted in a significant decrease of metabolites (NT vs OHT), which was prevented by NAM treatment (NT-NAM vs OHT-NAM). NAD in the SC was lower in OHT-NAM treated than NT-NAM treated (but remained above NT and OHT control levels; Supplementary Fig. 4). (J) Comparison of OHT changes relative to NT in the retina, ON and SC revealed that 5 metabolites were commonly changed, where increases in the retina were mirrored by decreases in the superior colliculus (Euler plot showing total changed metabolites, with the number of common changed metabolites denoted; for mean fold change plot, red = increase, blue = decrease). *P < 0.05, **P < 0.01, ***P < 0.001. (For interpretation of the references to color in this figure legend, the reader is referred to the Web version of this article.)
Fig. 7
Fig. 7
Nicotinamide buffers against metabolic crisis. (A) RGC axotomy resulted in a decrease in mitochondrial: nuclear derived RNA (mtRNA:nuRNA; relative expression of mtCo2 and rps18) suggesting a loss of mitochondrial capacity or reduced numbers of mitochondria (n = five 0 days ex vivo (DEV) retinas, five 3 DEV). (B) The ratio of ATP:ADP was not significantly altered in the retina or optic nerve, but was reduced under OHT in the superior colliculus which could indicate a switch towards favoring glycolysis over oxidative phosphorylation (OXPHOS; n = 8 retina, optic nerve and superior colliculus hemispheres per condition). This was reversed under NAM treatment. (C) Oxygen consumption rate was significantly increased in cultured RGCs supplemented with 50 and 500 μM NAM, suggesting NAM increases OXPHOS capacity (n = 5 cultures with 0 μM NAM, 5 cultures with 50 μM NAM, 4 cultures with 500 μM NAM, and 4 cultures with 1000 μM NAM). Extracellular acidification rate did not change significantly (n = 3 cultures per condition). (D and E) Intravitreal injection of rotenone (causing rapid depletion of OXPHOS) caused significant loss of RGCs after 24 h, and pre-treatment with NAM provided significant protection against this loss (n = 8 retina per condition). Scale bar in D = 20 μm *P < 0.05, **P < 0.01, ***P < 0.001.
Fig. 8
Fig. 8
Mitochondrial size changes following OHT. (A) Rat retina following 14 days of OHT (untreated (OHT, n = 6 retina) and NAM treated (800 mg/kg/d, OHT-NAM, n = 4 retina)) and NT control (n = 4 retina) tissue was cryo-sectioned, mitochondria labelled by anti-TOMM20, and imaged by Airy confocal scanning microscopy. The ganglion cell layer/retinal nerve fiber layer (GCL/RNFL) and inner plexiform layer (IPL) were analyzed separately (boundaries demarcated by white broken lines). (B) Mitochondrial volume and surface area were significantly reduced under OHT in the GCL/RNFL and this was mitigated by NAM (n = 535 disconnected volumes in NT, 490 in OHT, 652 in OHT-NAM). (C) In the IPL mitochondrial volume and surface area increased under OHT, which was exaggerated under NAM treatment (n = 9729 disconnected volumes in NT, 8026 in OHT, 6413 in OHT-NAM). Zoom = inset of data points. Scale bar in A = 5 μm ***P < 0.001.
Fig. 9
Fig. 9
Nicotinamide increases mitochondrial size. (A) Retinal axotomy culture of MitoV mice (RGC specific YFP labelled mitochondria in the inner retina) maintained for 0.5 days ex vivo (DEV) with or without NAM treated media (and controls fixed at point of euthanasia, 0 DEV) allowed imaging of RGC specific mitochondria in the GFL/RNFL by Airy confocal scanning microscopy following flat mounting (n = 4 retina for all conditions). (B) The mean mitochondrial volume and surface area were increased under axotomy, with a further increase in size under NAM treatment (n = 15,216 disconnected volumes in 0 DEV, 16,765 in 0.5 DEV, 24,558 in 0.5 DEV + NAM). (C) The effects NAM at mitigating direct mitochondrial stress were investigated by intravitreal rotenone injection in MitoV mice (n = 9 DMSO vehicle treated retina, 3 rotenone, 7 rotenone + NAM (500 mg/kg/d)). Tissue was cryo-sectioned and imaged by Airy confocal scanning microscopy and mitochondria within the IPL (boundary demarcated by cyan broken line). (D) Rotenone caused a reduction in mitochondrial volume relative to controls (DMSO vehicle) in the IPL. NAM had little effect is preventing this change (n = 15,380 disconnected volumes in DMSO vehicle treated retinas, 7987 in rotenone treated, 10,418 in rotenone + NAM). These results demonstrate the heterogeneous nature of OHT insult on mitochondria that shares features with both direct RGC and direct mitochondrial stress. (E) In order to determine whether NAM increases mitochondrial size in uninjured retina, MitoV mice were maintained on a NAM diet (500 mg/kg/d) for 1 week. Retina were fixed immediately after euthanasia and compared to untreated controls by Airy confocal imaging and reconstruction (n = 4 control retinas, 4 NAM supplemented). (F) NAM supplementation increased mean mitochondrial volume and surface area in RGCs, supporting observations of mitochondria under stress above (n = 15,216 disconnected volumes in control, 13,306 in NAM supplemented). Zoom = inset of data points. Scale bar = 5 μm in A, C, and E. **P < 0.01, ***P < 0.001. (For interpretation of the references to color in this figure legend, the reader is referred to the Web version of this article.)
Fig. 10
Fig. 10
Nicotinamide increases mitochondrial motility in RGCs. (A) In order to observe these NAM effects on mitochondria in vivo, RGC cultures were grown and exposed to NAM treated media for 24 h. MitoTracker labelled mitochondria were time-lapse imaged over 10 min (example images shown in A and as kymographs in C where the y axis = time (t) and the x axis = distance long the neurite (d)). Morphology was examined in the first frame and demonstrated that mitochondrial length was increased with increasing NAM concentration (B; n = 148 mitochondria in control, 154 in 50 μM NAM, 141 in 100 μM NAM, 140 in 500 μM NAM, 122 in 1000 μM NAM; mitochondria from 8 neurites from 3 independent cultures for all conditions). Mitochondria occupied a greater percentage of neurite length in NAM exposed retina (B; n = 8 neurites from 3 independent cultures for all conditions), which was partially explained by an increase in observed mitochondria (D). Analysis of mitochondrial movements demonstrated a greater number of both mobile and stationary mitochondria (D; n = 3 independent cultures for all conditions). Mitochondrial velocity was significantly increased with NAM supplementation (D; n = 52 mitochondria in control, 356 in 50 μM NAM, 324 in 100 μM NAM, 249 in 500 μM NAM, 292 in 1000 μM NAM; mitochondria from 3 independent cultures for all conditions). Since a greater number of stationary mitochondria were observed, this suggests that the increase in mitochondria numbers may be a factor of increase mitochondrial biogenesis. Scale bar = 10 μm in A and 20 μm in C. *P < 0.05, **P < 0.01, ***P < 0.001.
Fig. 11
Fig. 11
Nicotinamide lowers action potential firing frequency in RGCs. (A) Mouse retina were explanted and incubated with NAM for 2hrs before patch clamping. Example traces for individual RGCs are shown for each treatment group (0 mV profile in grey, 50 mV profile in color, 100 mV profile in grey; total RGCs = twelve control, eleven 1 mM NAM, ten 10 mM NAM, 17,100 mM NAM, eleven 250 mM NAM, from 3 retinas for each condition). (B) Action potential (AP) firing frequency was markedly reduced at higher doses of NAM (analogous to those that provide neuroprotection in the axotomy explant model). (C) The relationship of input current to output demonstrates a slight increase in AP firing at high current for low dose NAM (1 and 10 mM) with a significant reduction in firing across a large range of input currents for higher doses (100 and 250 mM). (C) AP amplitude was significantly reduced at the higher doses and AP rise-time was significantly increased. (D) NAM did not affect the resting membrane potential, threshold for achieving an AP or the Rheobase indicating that the potential/ability to fire was not altered. Reducing AP firing may lower the metabolic demands of RGCs thus contributing to its neuroprotective effects. *P < 0.05, **P < 0.01, ***P < 0.001. (For interpretation of the references to color in this figure legend, the reader is referred to the Web version of this article.)
Supplementary Fig. 1
Retinal axotomy explant model. (A) Eye enucleation severs the optic nerve, resulting in significant RGC death (loss of RBPMS + cell somas; an RGC specific marker in the retina, red), as the retina is maintained in culture (n = 6 retinas per condition). (B) A significant reduction in RGC density, nuclear density, and nuclear diameter (DAPI, blue in A) occurs as early at 0.5 days ex vivo (DEV) and is highly significant at 1, 3, and 5 DEV. (C) β-tubulin labelling (green) and imaging of the retinal nerve fiber layer demonstrated (D) a significant increase in axon varicosity density by 3 DEV (but not in varicosity size; n = 6 retinas per condition). Scale bar = 20 μm in B and 50 μm in B. **P < 0.01, ***P < 0.001.
Supplementary Fig. 2
Low molecular weight metabolomics. (A) Seventy nine low molecular weight metabolites could be reliably detected in retina (n = 8), optic nerve (n = 8) and superior colliculus (SC; n = 8 hemispheres) of Brown Norway rats. Unsupervised hierarchical clustering clearly separated these tissue based on their metabolic profile (accompanying heat map scaled where red = highest value, blue = lowest value by row). The majority of metabolites were most abundant in the optic nerve and lowest in the retina (with the exception of ATP; greyscale from highest (black) to lowest (light grey)). (B) A number of metabolites were highly abundant and so data were subject to Pareto scaling in order to reduce this as a driver for inter tissue differences (metabolites match labels on A). (C) These tissue differences were explored by principle component analysis. Metabolite abundance per sample (relative area) for the 5 explanatory variables with the greatest loadings for components 1 and 2 (PC1 and PC2) are plotted demonstrating inter tissue differences in these metabolites.
Supplementary Fig. 3
NAD metabolism is altered following NAM treatment. Metabolomics revealed that following NAM supplementation of normotensive rats NAD was increased in all tissues. This indicates that NAM dietary supplementation successfully translates to increased NAD in RGC relevant tissues. The optic nerve was the only tissue to show a change in the NAD:NADH ratio, indicting a potential saturation of conversion to NAD from NAM and a saturation of the NAD pool, or a greater recycling of NAD back to NAM. *P < 0.05, **P < 0.01, ***P < 0.001.
Supplementary Fig. 4
NAD metabolism is altered under OHT and NAM treatment across the retina, optic nerve and superior colliculus. Metabolite abundance per sample (relative area) for NAD, NADH, and Nicotinamide (NAM) are plotted demonstrating differences in these metabolites by condition (NT, NT-NAM, OHT, OHT-NAM; n = 8 samples for each tissue and condition). The NAD:NADH ratio is also plotted. (A) In the retina, NAD increases under OHT, and increases under NAM supplementation in both NT and OHT conditions. NADH, NAM and NAD:NADH show little change across conditions in the retina. (B) In the optic nerve, NAD, NADH, NAM and the NAD:NADH ratio are significantly increased under NAM supplementation, and remain higher in OHT-NAM. NAM is highly increased in OHT-NAM treated optic nerves, suggesting a potential reduction in conversion to NAD. (C) In the superior colliculus NAD is decreased in OHT and this is rescued under NAM supplementation (OHT-NAM). NAD and NADH are significantly increased under NAM supplementation and NAM is unchanged. The NAD:NADH ratio is decreased in OHT and this is rescued by NAM supplementation (OHT-NAM). *P < 0.05, **P < 0.01, ***P < 0.001, NS P > 0.05.
Supplementary Fig. 5
Characterization of MitoV mouse. In substrain 1819 generated as described by Misgeld at al. (2007) YFP is expressed under a rat Eno2 promoter (neuron specific) and localized to mitochondria via a Cox8a gene-targeting signal fused to the YFP N-terminus. (A) In the retina YFP expression is visible within RGC soma, axons and dendrites. (B) Labelling with an anti-GFP antibody to boost detection of YFP confirmed that 100% of YFP positive cells were all also RBPMS positive (data not shown). (C) Retinal sections demonstrate that YFP is also present within a subset of bipolar cells and some photoreceptor outer segments (left panel) as demonstrated by areas of non-localization of TOMM20 (all mitochondria) and YFP (right panel). (D) YFP expression was also present across multiple brain regions and the spinal cord.
Supplementary Fig. 6
Biocytin fills demonstrate that recorded RGCs have broadly similar morphology. Images were captured of biocytin filled cells following recording which confirmed that cells were RGCs based on the presence of an axon. Morphology across conditions was broadly similar but with some variability as analyzed by Sholl analysis, dendritic field area, and soma diameter. This suggests that the differing electrophysiological responses are not the result of significantly different morphologies or RGC subtypes. RGCs from the group treated with 1 mM NAM demonstrated significantly larger dendritic field area and soma diameter than control which may indicate a different proportion of RGC subtypes within this group. Scale bar = 100 μm *P < 0.05, ***P < 0.001.

References

    1. Tham Y.C., Li X., Wong T.Y., Quigley H.A., Aung T., Cheng C.Y. Global prevalence of glaucoma and projections of glaucoma burden through 2040: a systematic review and meta-analysis. Ophthalmology. 2014;121(11):2081–2090. - PubMed
    1. Naik S., Pandey A., Lewis S.A., Rao B.S.S., Mutalik S. Neuroprotection: a versatile approach to combat glaucoma. Eur. J. Pharmacol. 2020;881:173208. - PubMed
    1. Peters D., Bengtsson B., Heijl A. Factors associated with lifetime risk of open-angle glaucoma blindness. Acta Ophthalmol. 2014;92(5):421–425. - PubMed
    1. Tribble J.R., Vasalauskaite A., Redmond T., Young R.D., Hassan S., Fautsch M.P. Midget retinal ganglion cell dendritic and mitochondrial degeneration is an early feature of human glaucoma. Brain Commun. 2019;1(1):fcz035. - PMC - PubMed
    1. Williams P.A., Harder J.M., Foxworth N.E., Cochran K.E., Philip V.M., Porciatti V. Vitamin B-3 modulates mitochondrial vulnerability and prevents glaucoma in aged mice. Science. 2017;355(6326):756–760. - PMC - PubMed

Publication types