

The value of genomic relationship matrices to estimate levels of inbreeding
- PMID: 33933002
- PMCID: PMC8088726
- DOI: 10.1186/s12711-021-00635-0
The value of genomic relationship matrices to estimate levels of inbreeding
Abstract
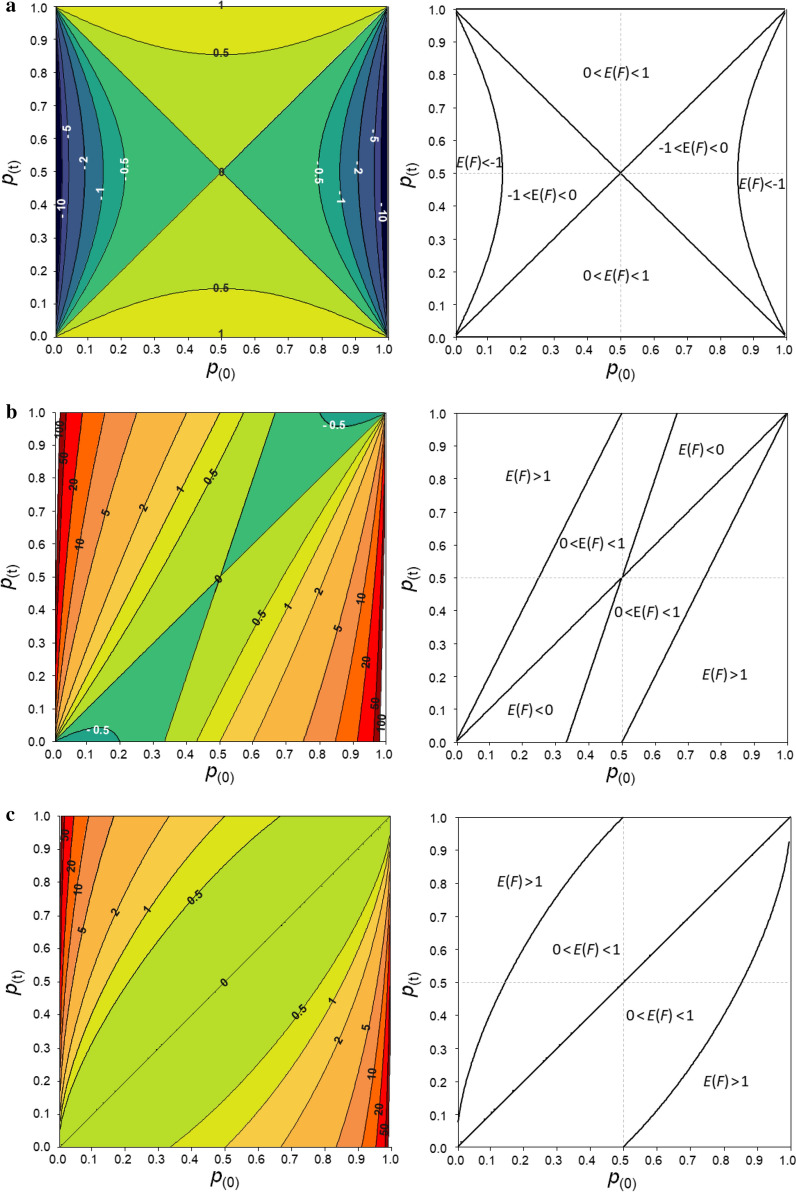
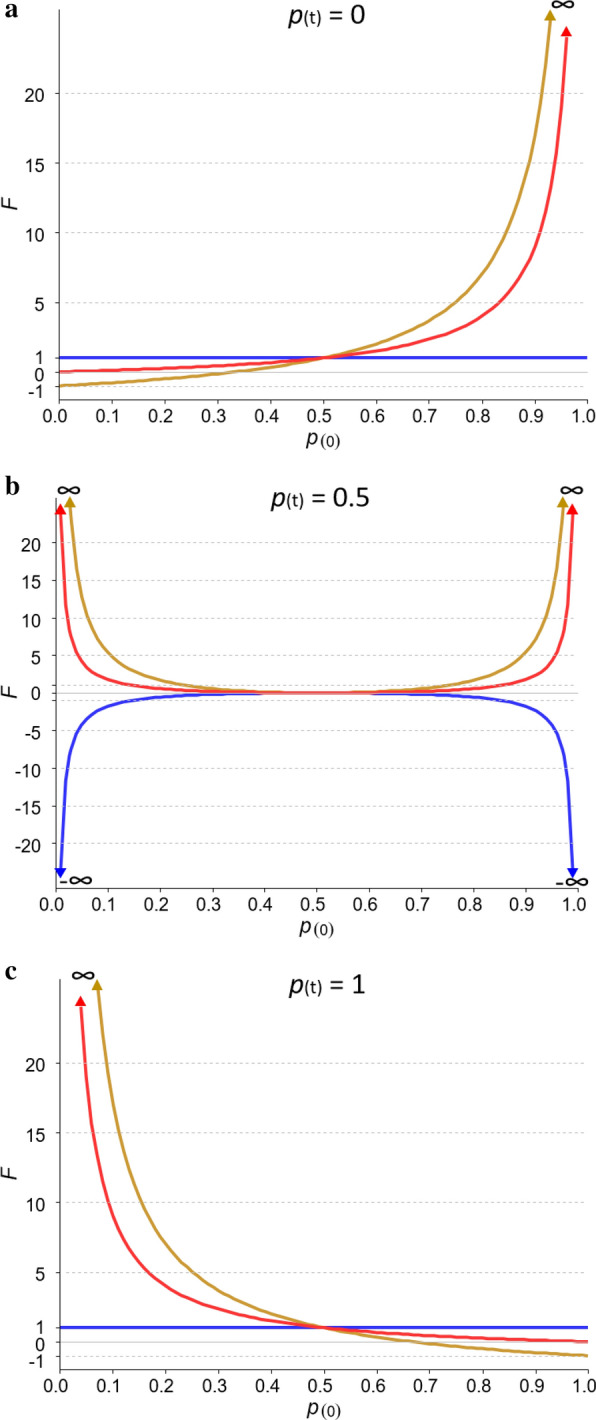
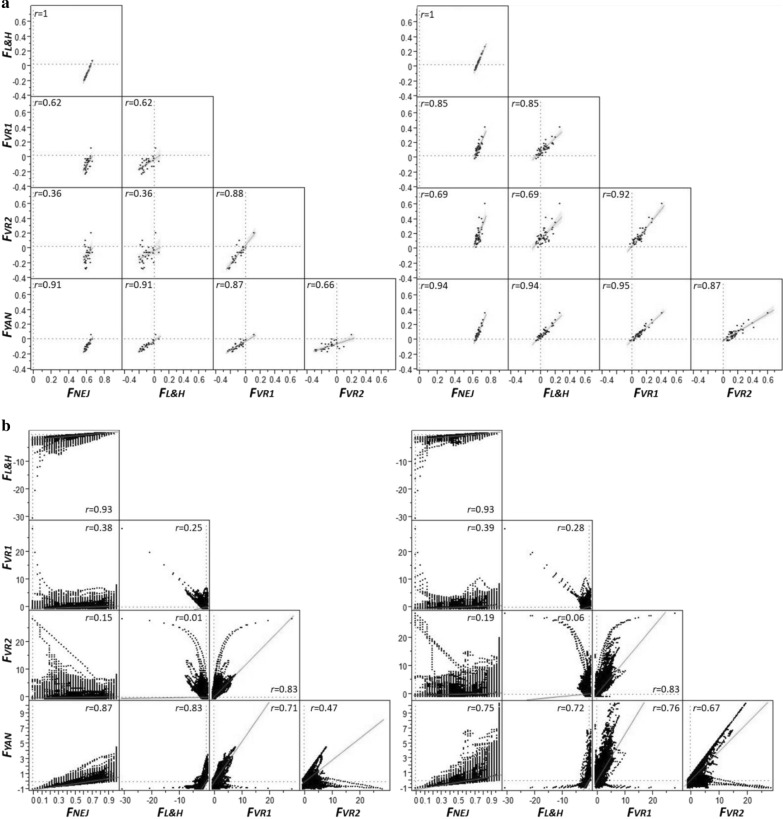
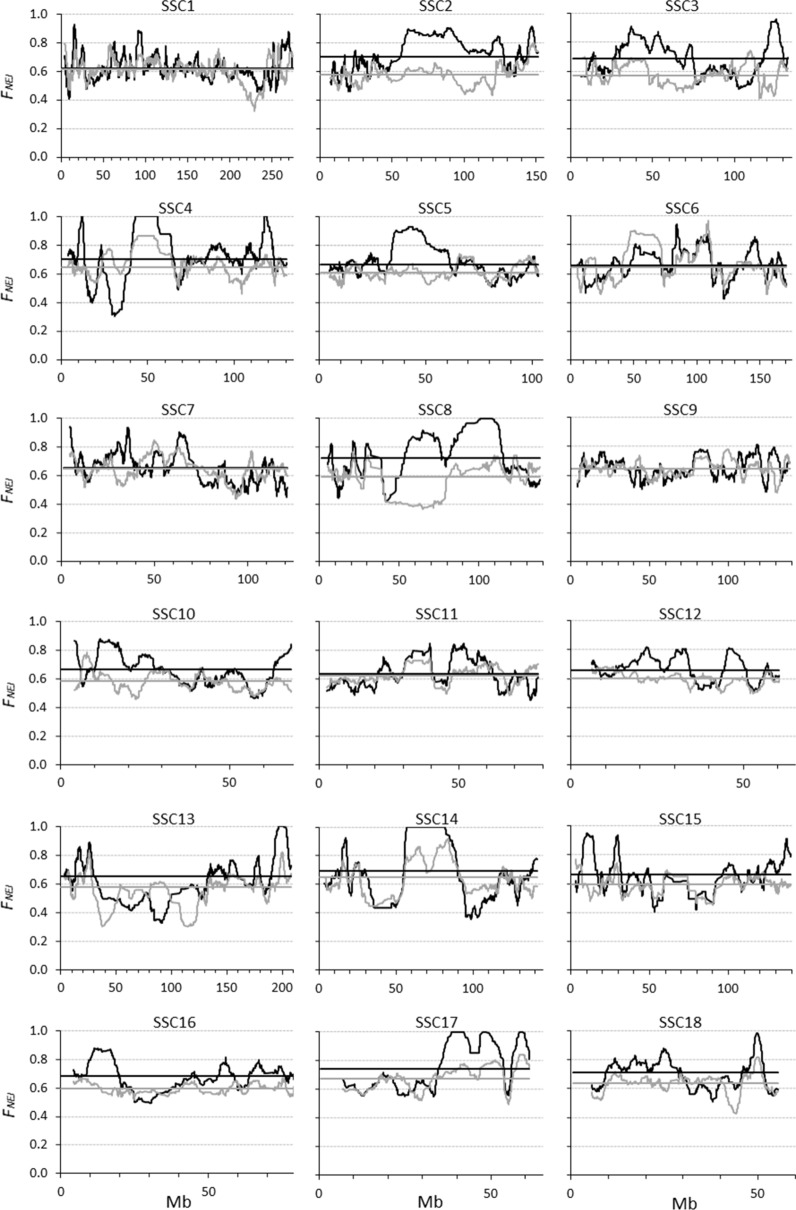
Background: Genomic relationship matrices are used to obtain genomic inbreeding coefficients. However, there are several methodologies to compute these matrices and there is still an unresolved debate on which one provides the best estimate of inbreeding. In this study, we investigated measures of inbreeding obtained from five genomic matrices, including the Nejati-Javaremi allelic relationship matrix (FNEJ), the Li and Horvitz matrix based on excess of homozygosity (FL&H), and the VanRaden (methods 1, FVR1, and 2, FVR2) and Yang (FYAN) genomic relationship matrices. We derived expectations for each inbreeding coefficient, assuming a single locus model, and used these expectations to explain the patterns of the coefficients that were computed from thousands of single nucleotide polymorphism genotypes in a population of Iberian pigs.
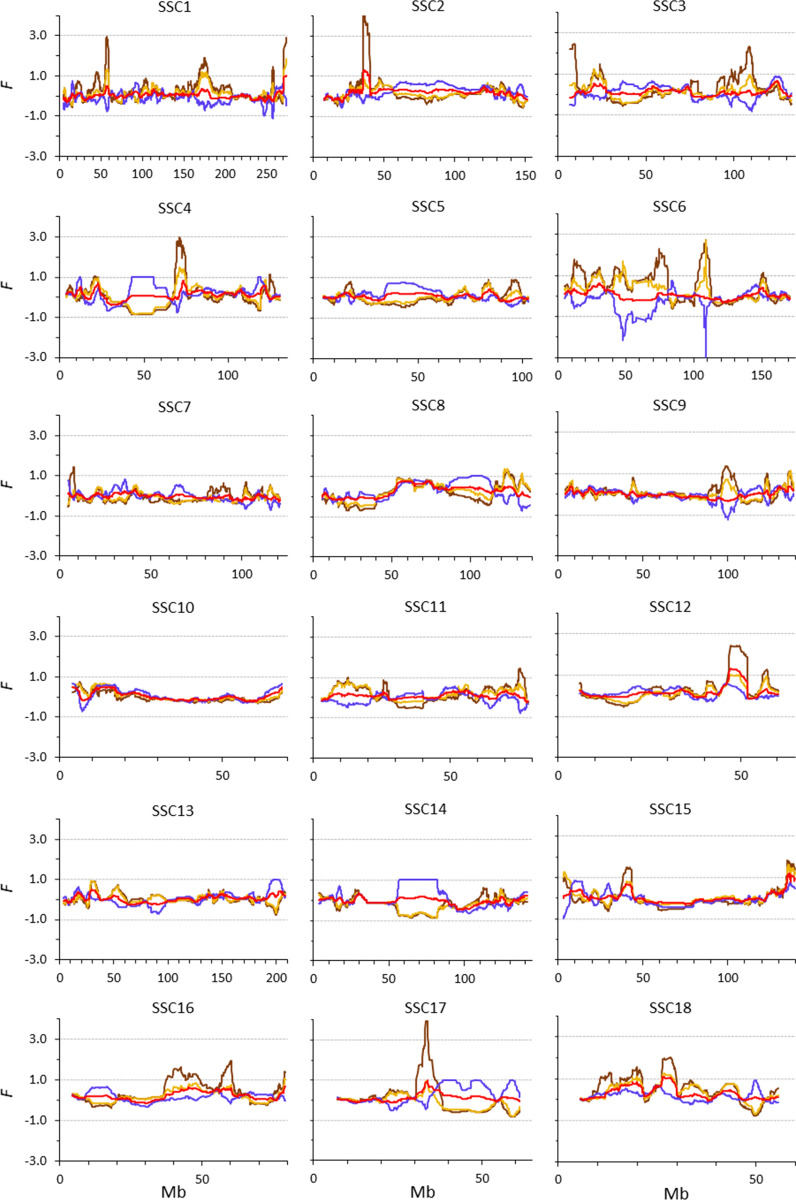
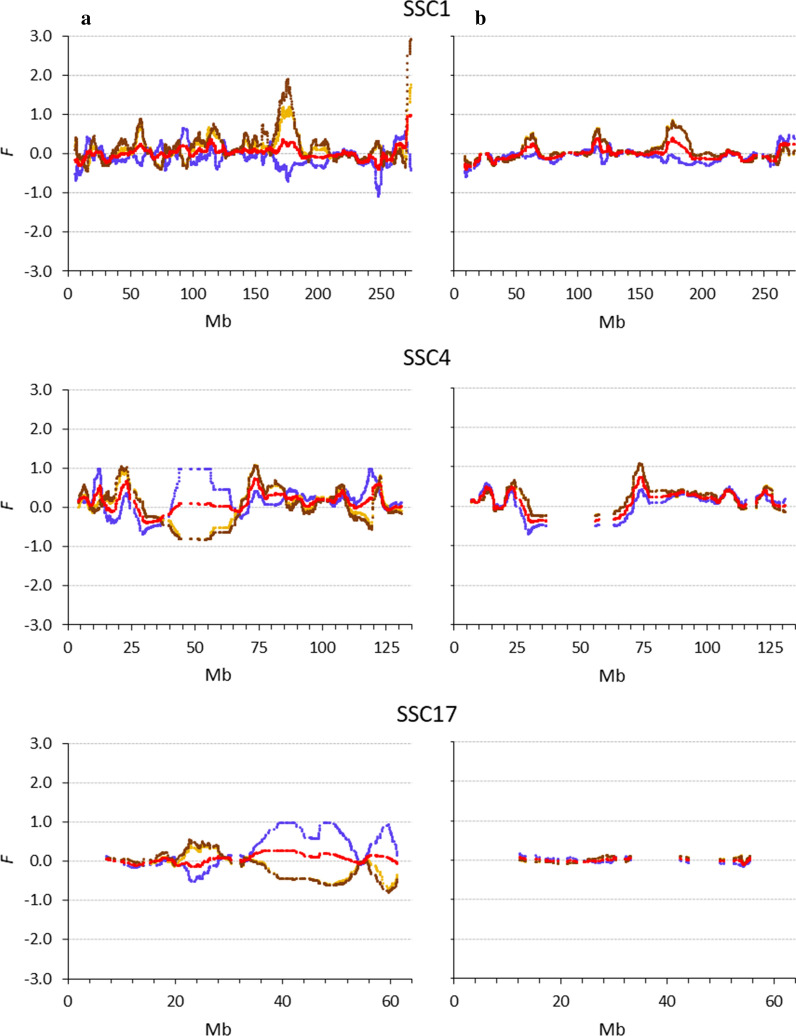
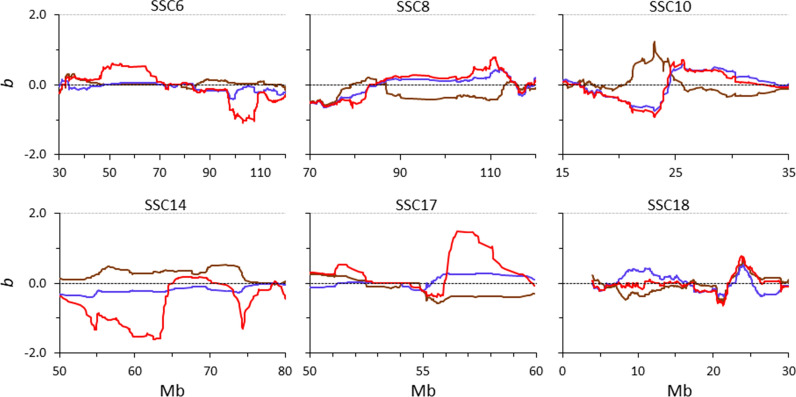
Results: Except for FNEJ, the evaluated measures of inbreeding do not match with the original definitions of inbreeding coefficient of Wright (correlation) or Malécot (probability). When inbreeding coefficients are interpreted as indicators of variability (heterozygosity) that was gained or lost relative to a base population, both FNEJ and FL&H led to sensible results but this was not the case for FVR1, FVR2 and FYAN. When variability has increased relative to the base, FVR1, FVR2 and FYAN can indicate that it decreased. In fact, based on FYAN, variability is not expected to increase. When variability has decreased, FVR1 and FVR2 can indicate that it has increased. Finally, these three coefficients can indicate that more variability than that present in the base population can be lost, which is also unreasonable. The patterns for these coefficients observed in the pig population were very different, following the derived expectations. As a consequence, the rate of inbreeding depression estimated based on these inbreeding coefficients differed not only in magnitude but also in sign.
Conclusions: Genomic inbreeding coefficients obtained from the diagonal elements of genomic matrices can lead to inconsistent results in terms of gain and loss of genetic variability and inbreeding depression estimates, and thus to misleading interpretations. Although these matrices have proven to be very efficient in increasing the accuracy of genomic predictions, they do not always provide a useful measure of inbreeding.
Conflict of interest statement
The authors declare that they have no competing interests.
Figures
References
-
- Walsh B, Lynch M. Evolution and selection of quantitative traits. Oxford: Oxford University Press; 2018.
-
- Roff DA. Evolutionary quantitative genetics. New York: Chapman & Hall; 1997.
-
- Frankham R, Ballou JD, Briscoe DA. Introduction to conservation genetics. 2. Cambridge: Cambridge University Press; 2010.
MeSH terms
Grants and funding
LinkOut - more resources
Full Text Sources
Other Literature Sources
Research Materials
