. 2021 Aug:342:113725.
doi: 10.1016/j.expneurol.2021.113725. Epub 2021 Apr 30.

Liver inflammation at the time of spinal cord injury enhances intraspinal pathology, liver injury, metabolic syndrome and locomotor deficits

Affiliations

Liver inflammation at the time of spinal cord injury enhances intraspinal pathology, liver injury, metabolic syndrome and locomotor deficits

Matthew T Goodus et al. Exp Neurol. 2021 Aug.

Abstract

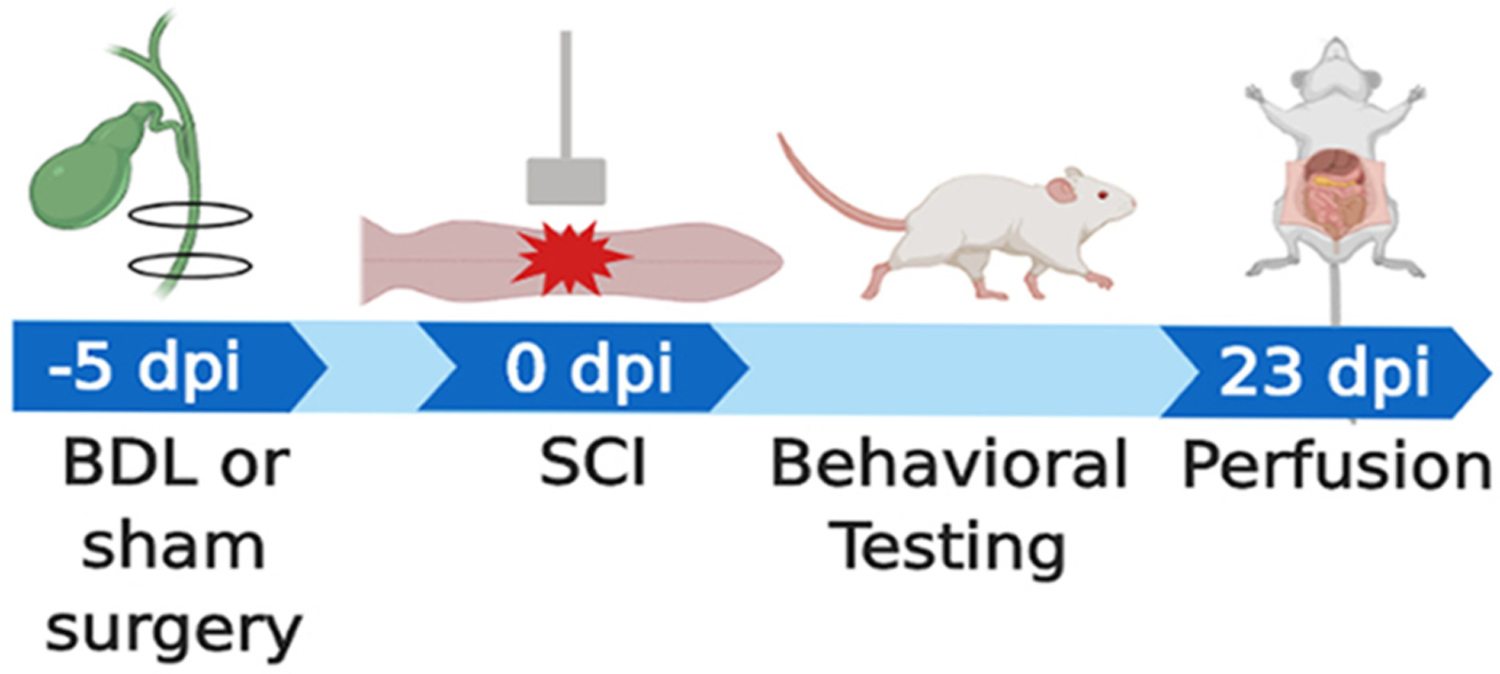
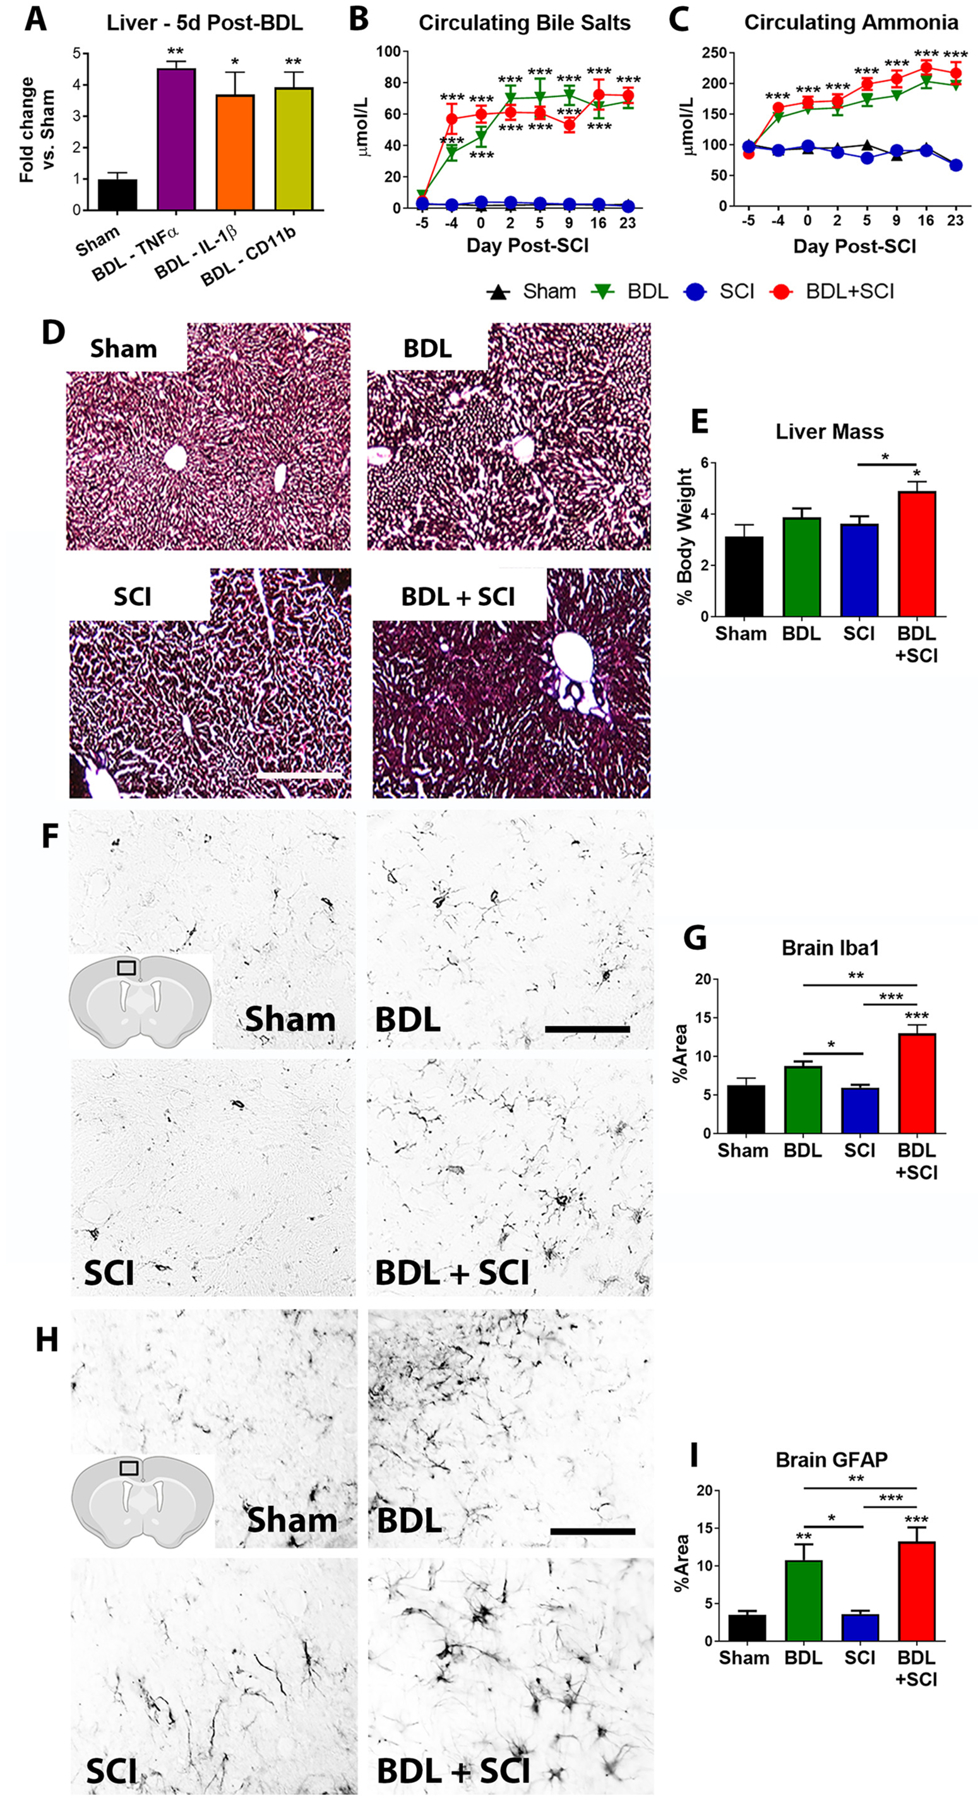
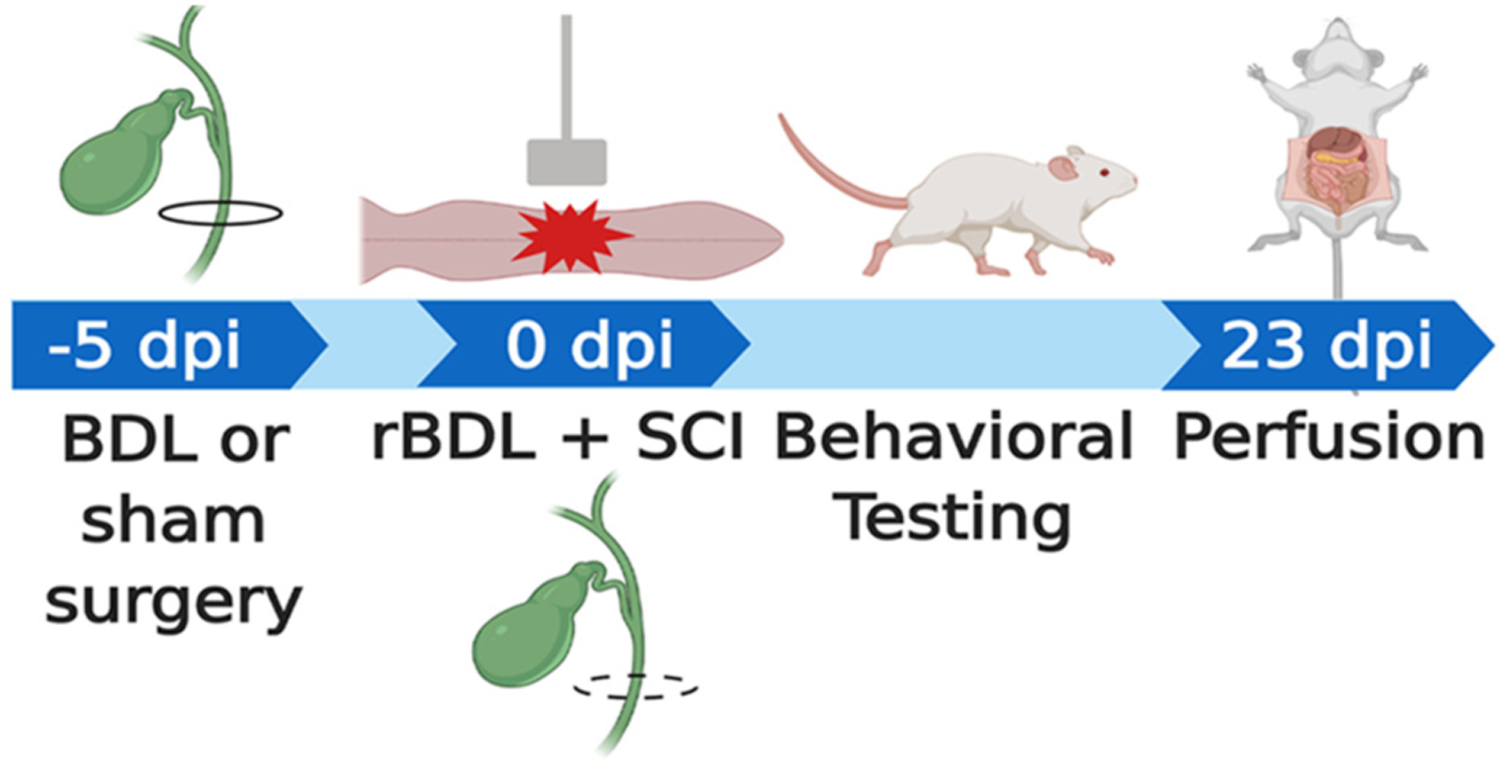
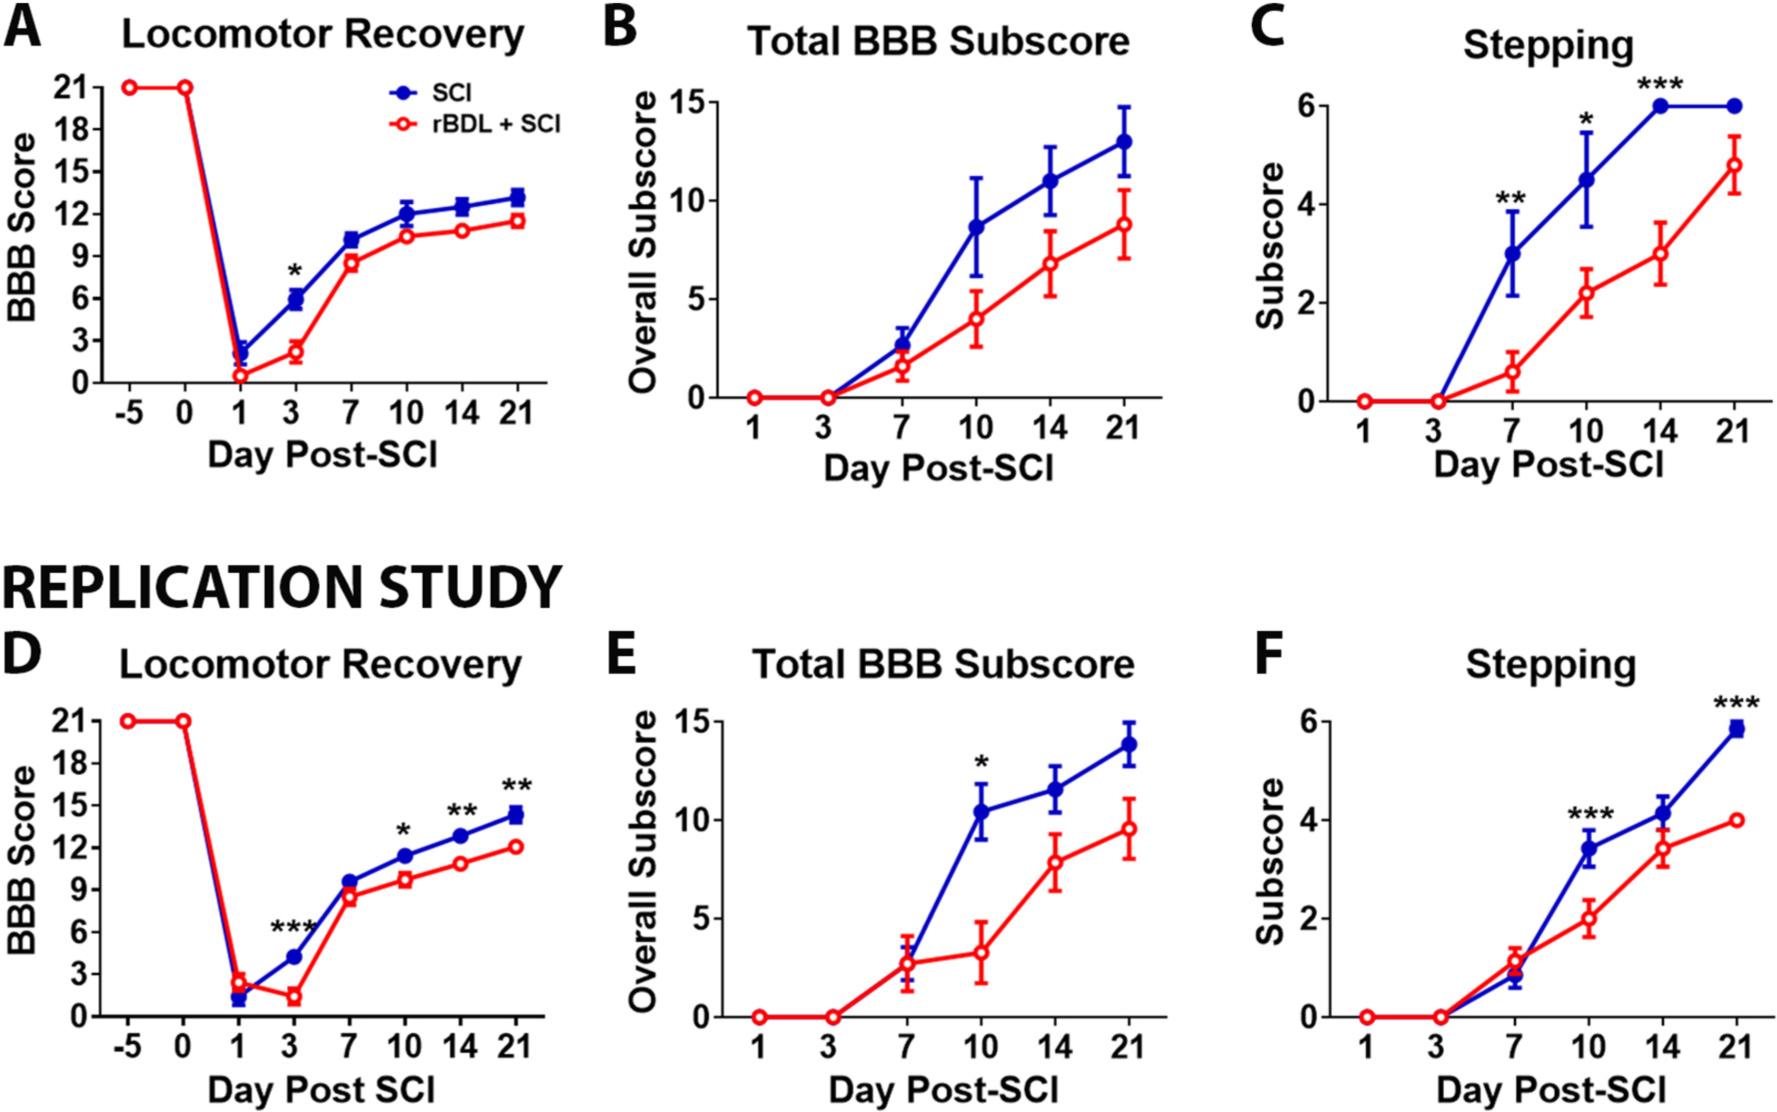
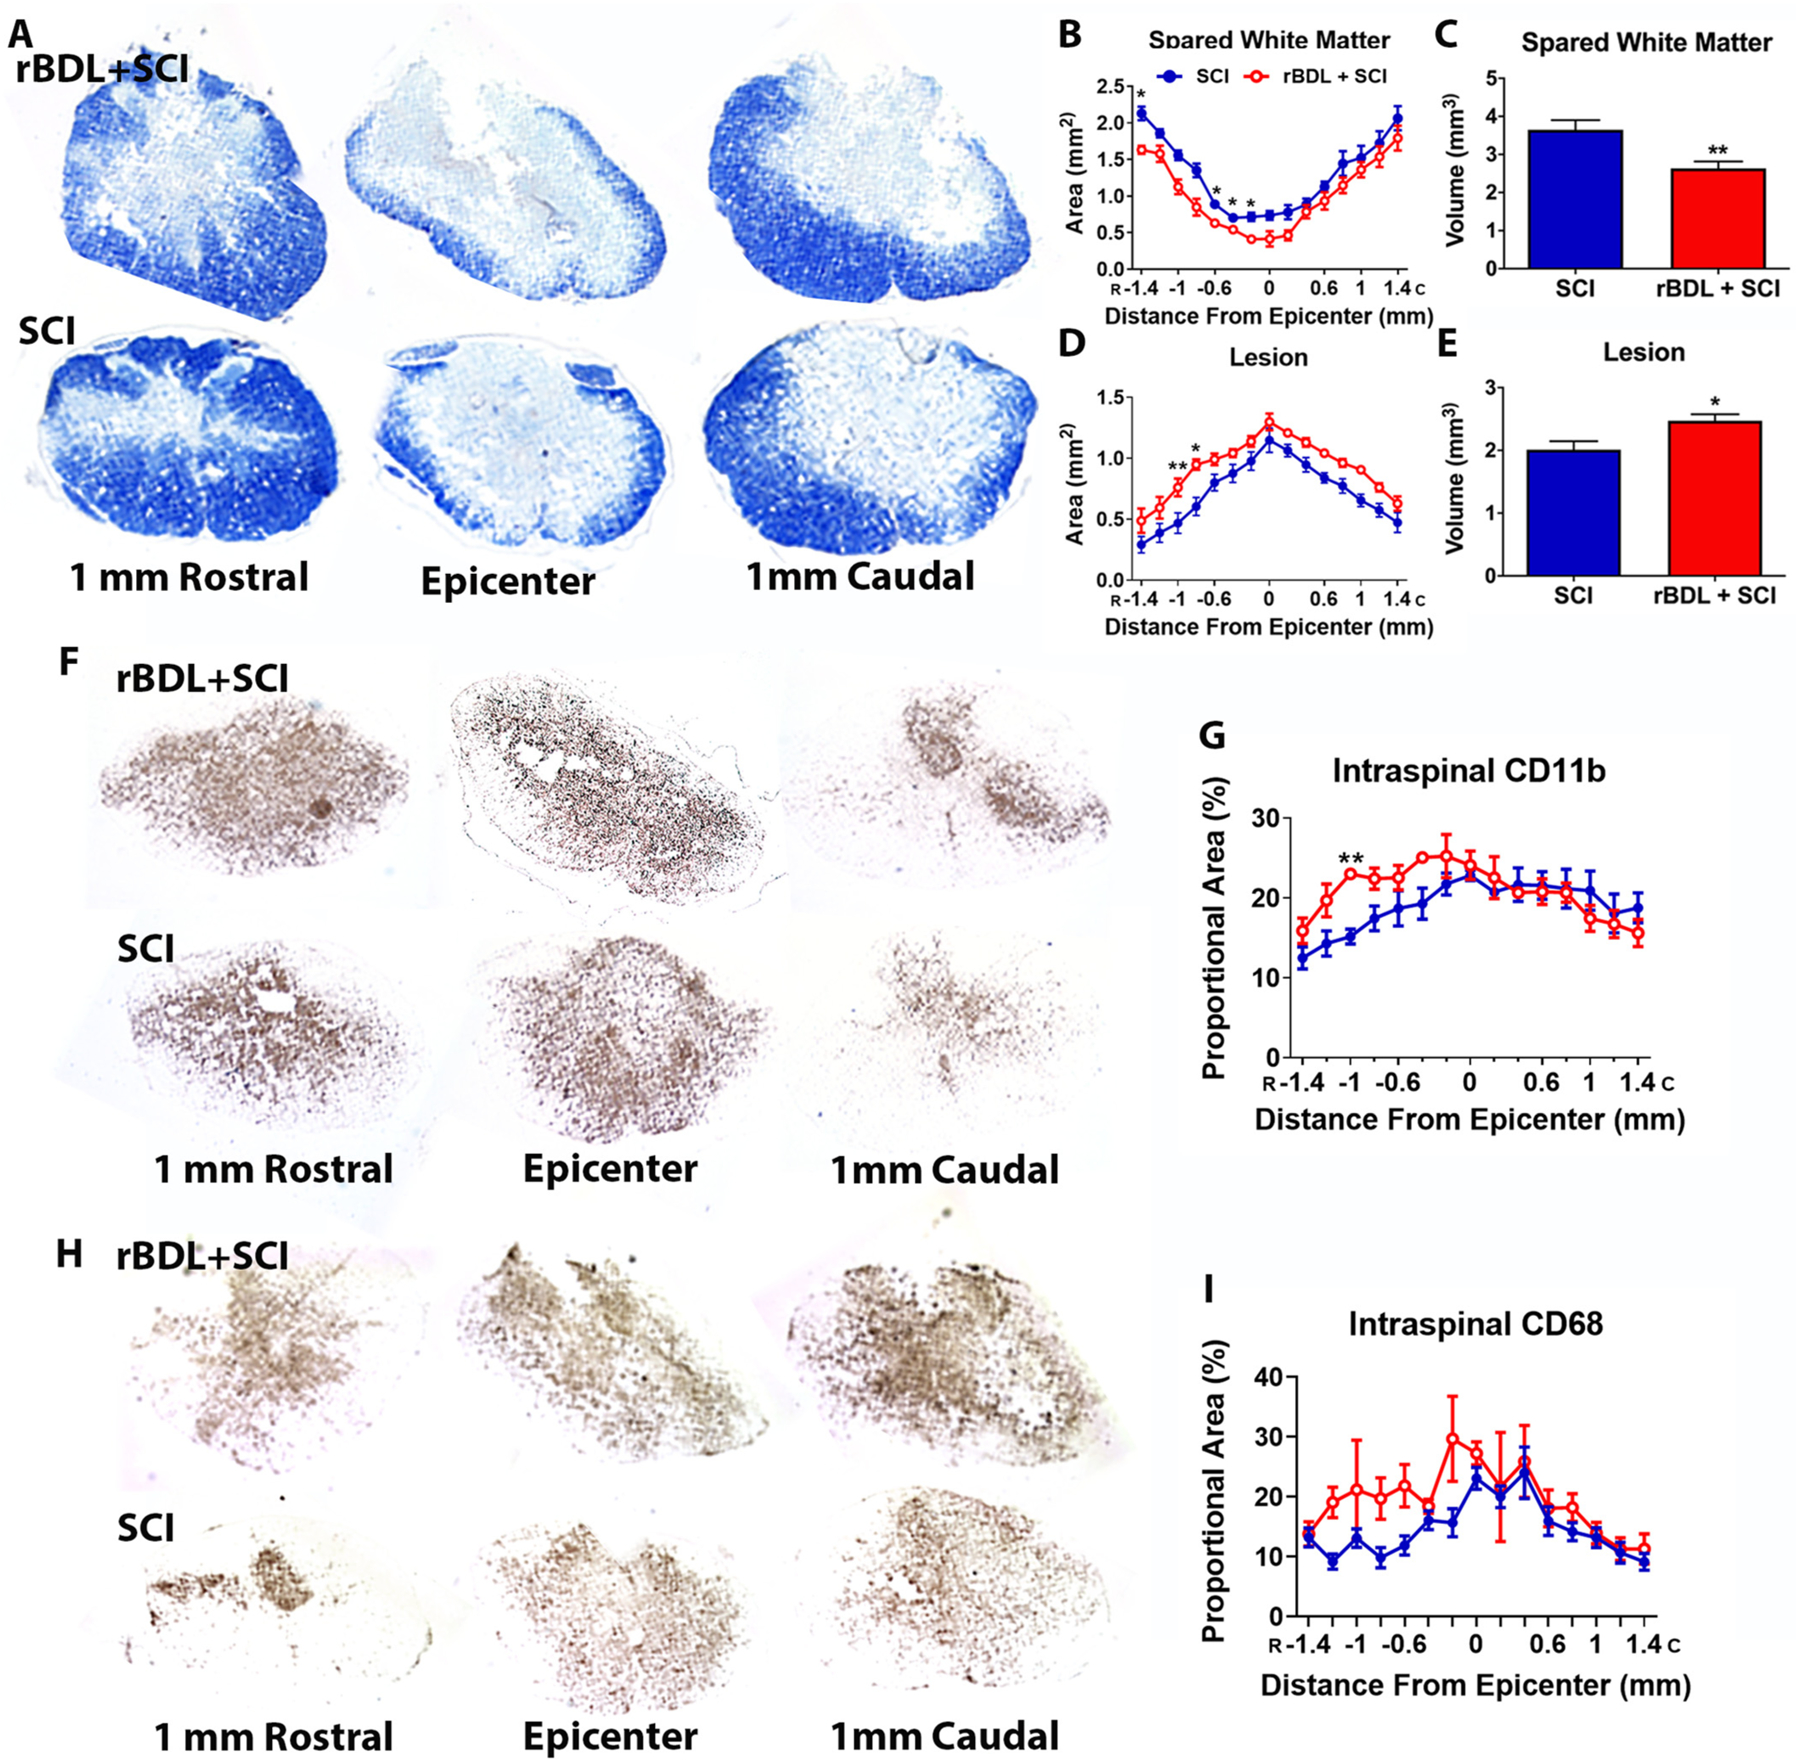
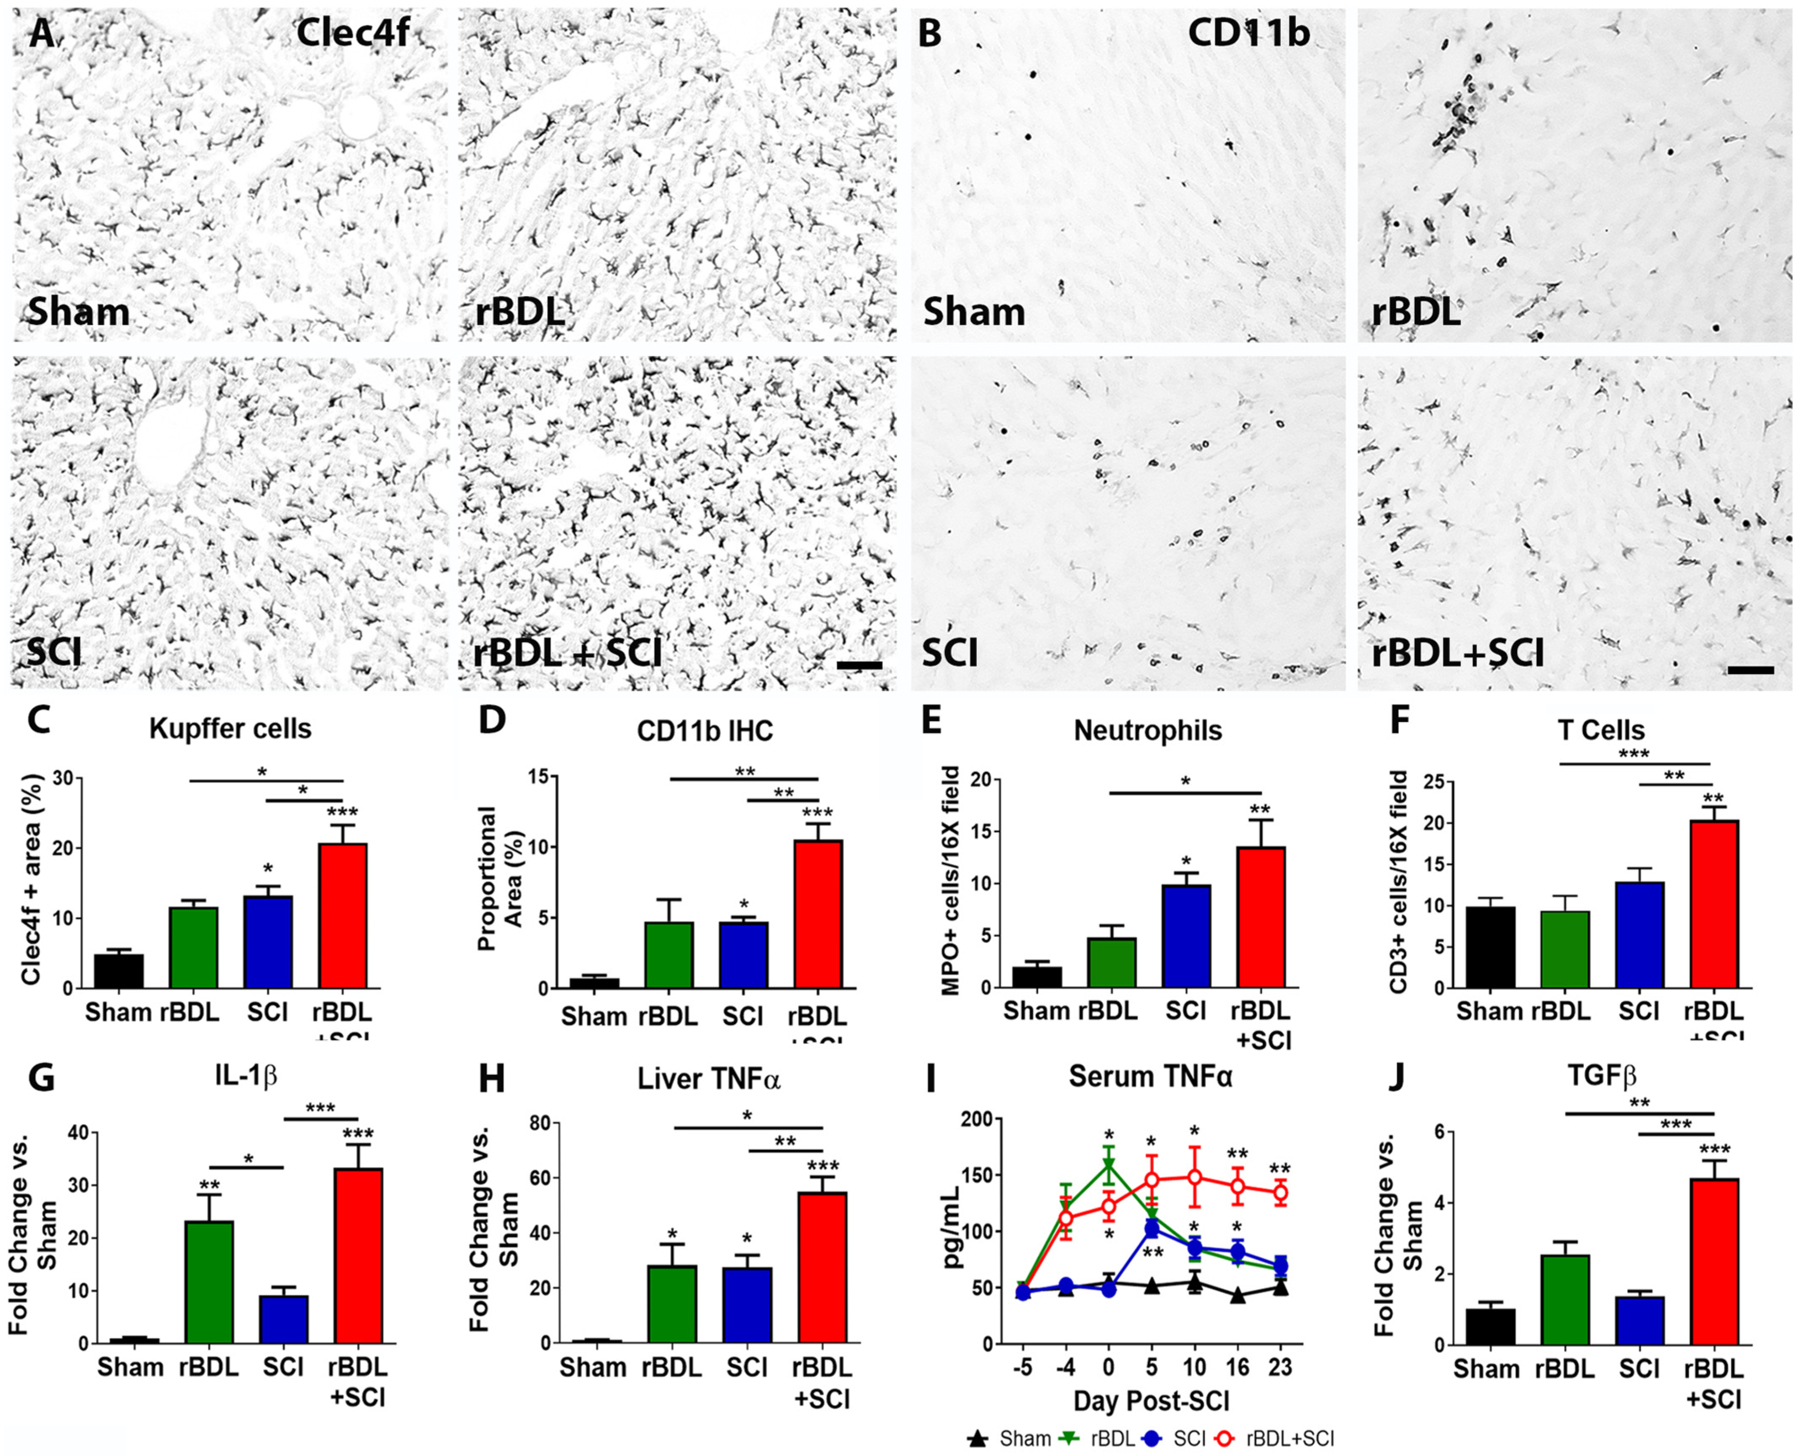
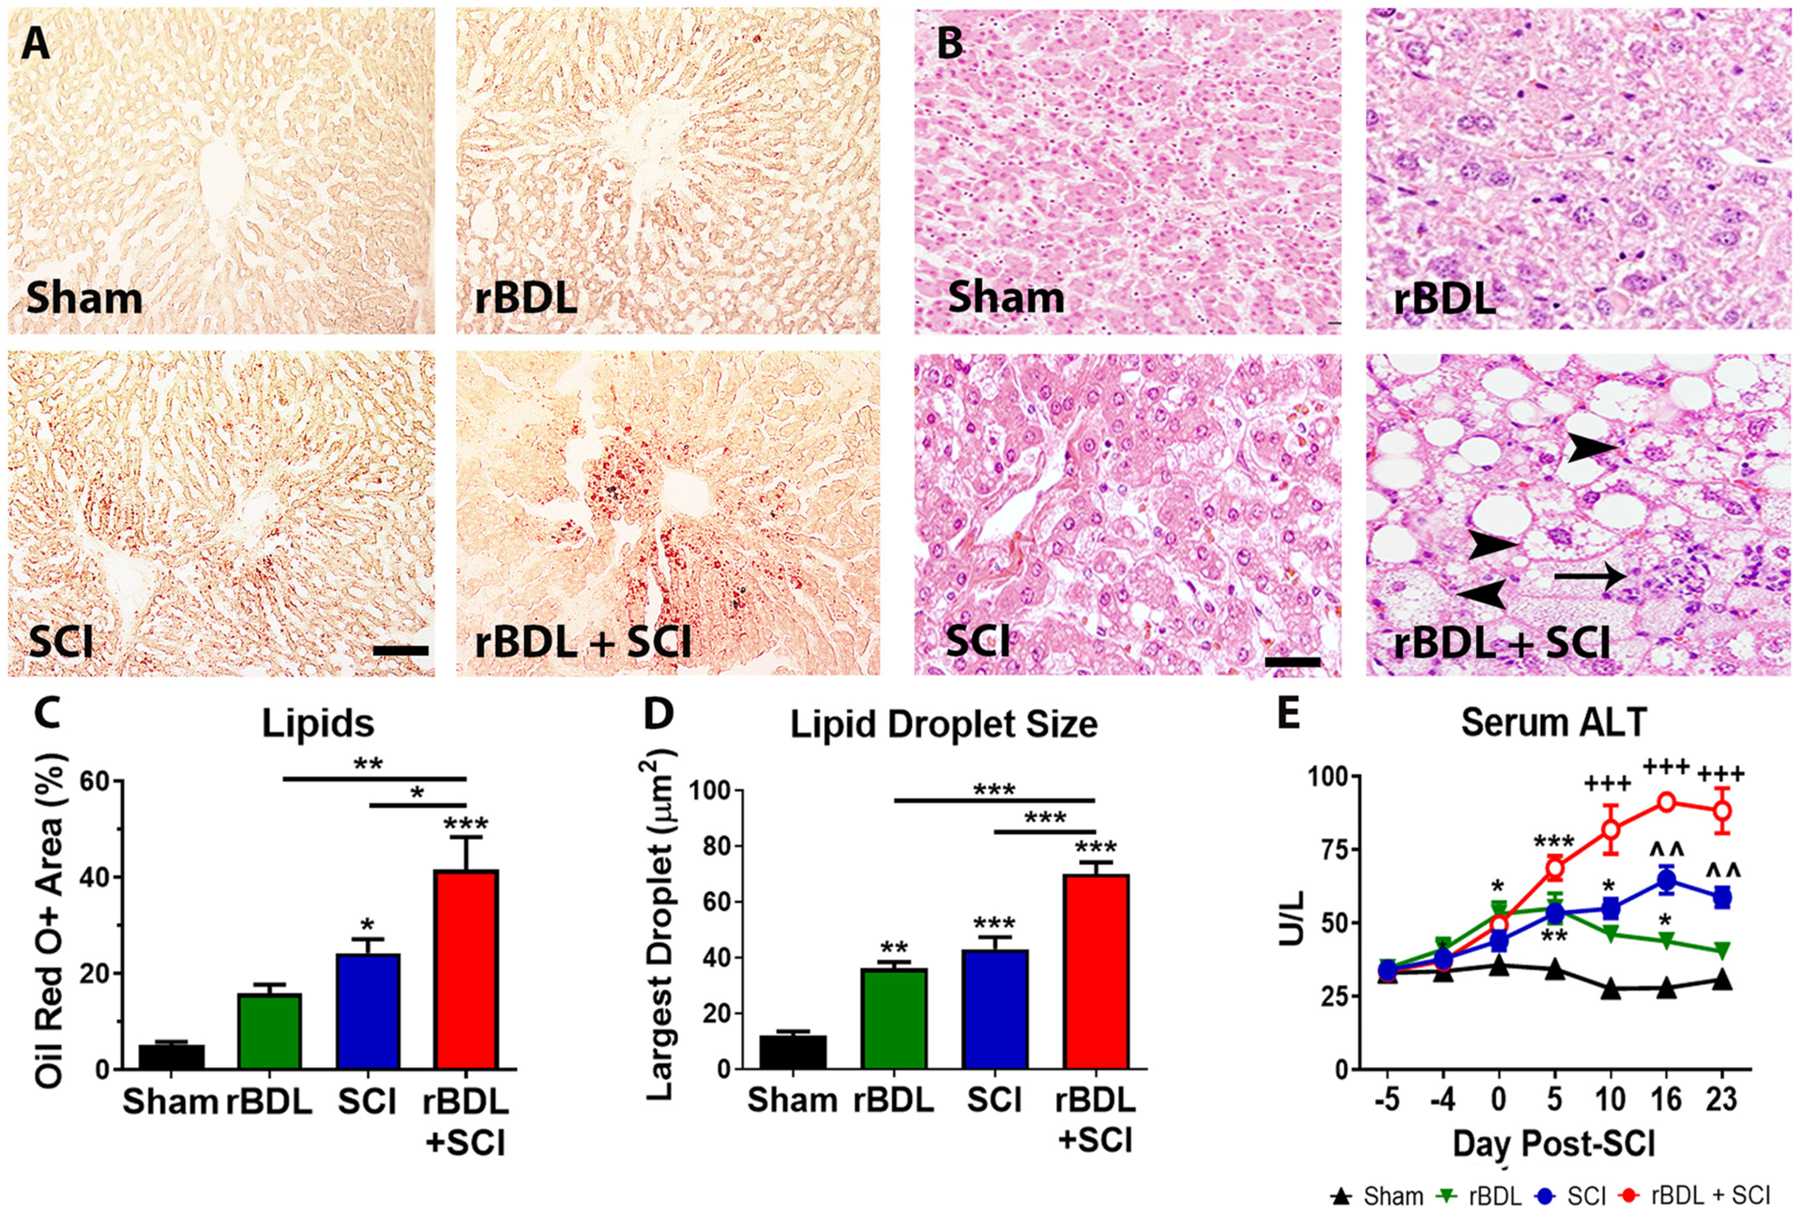
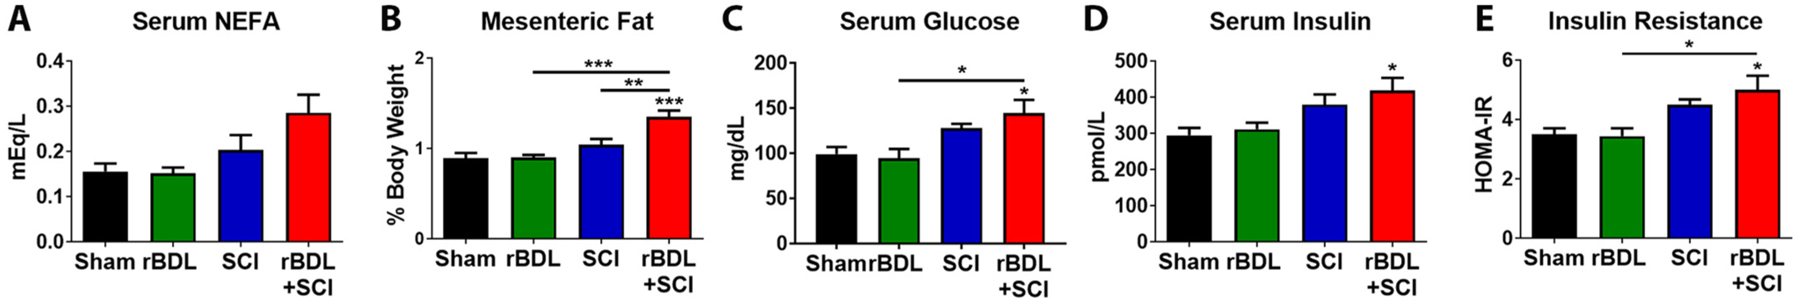
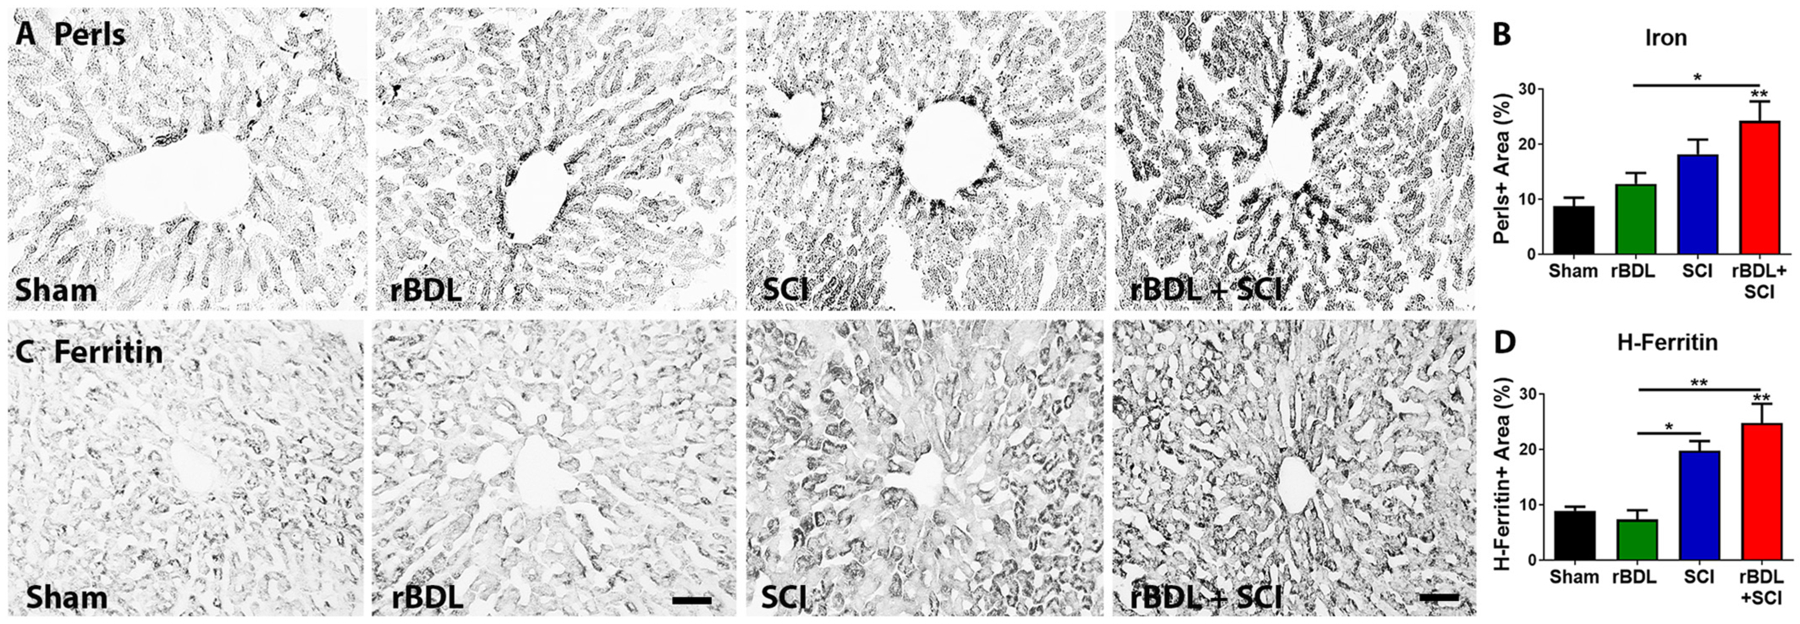
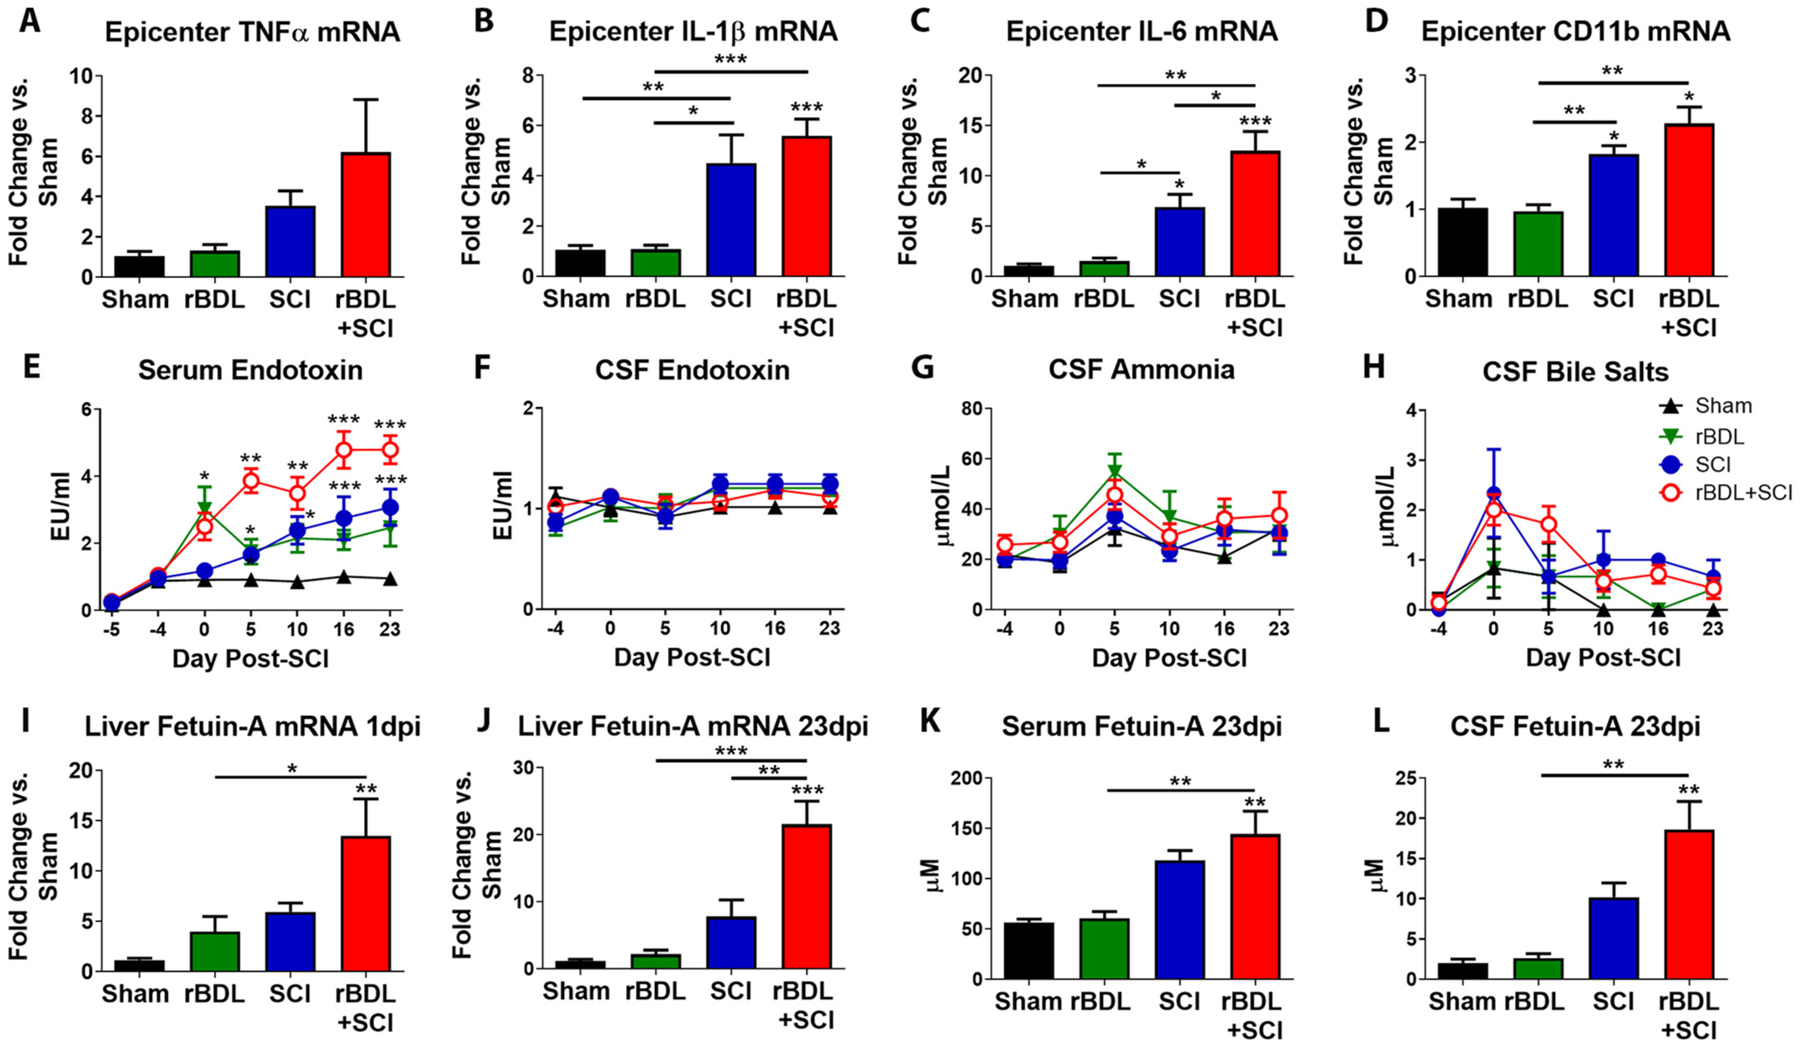
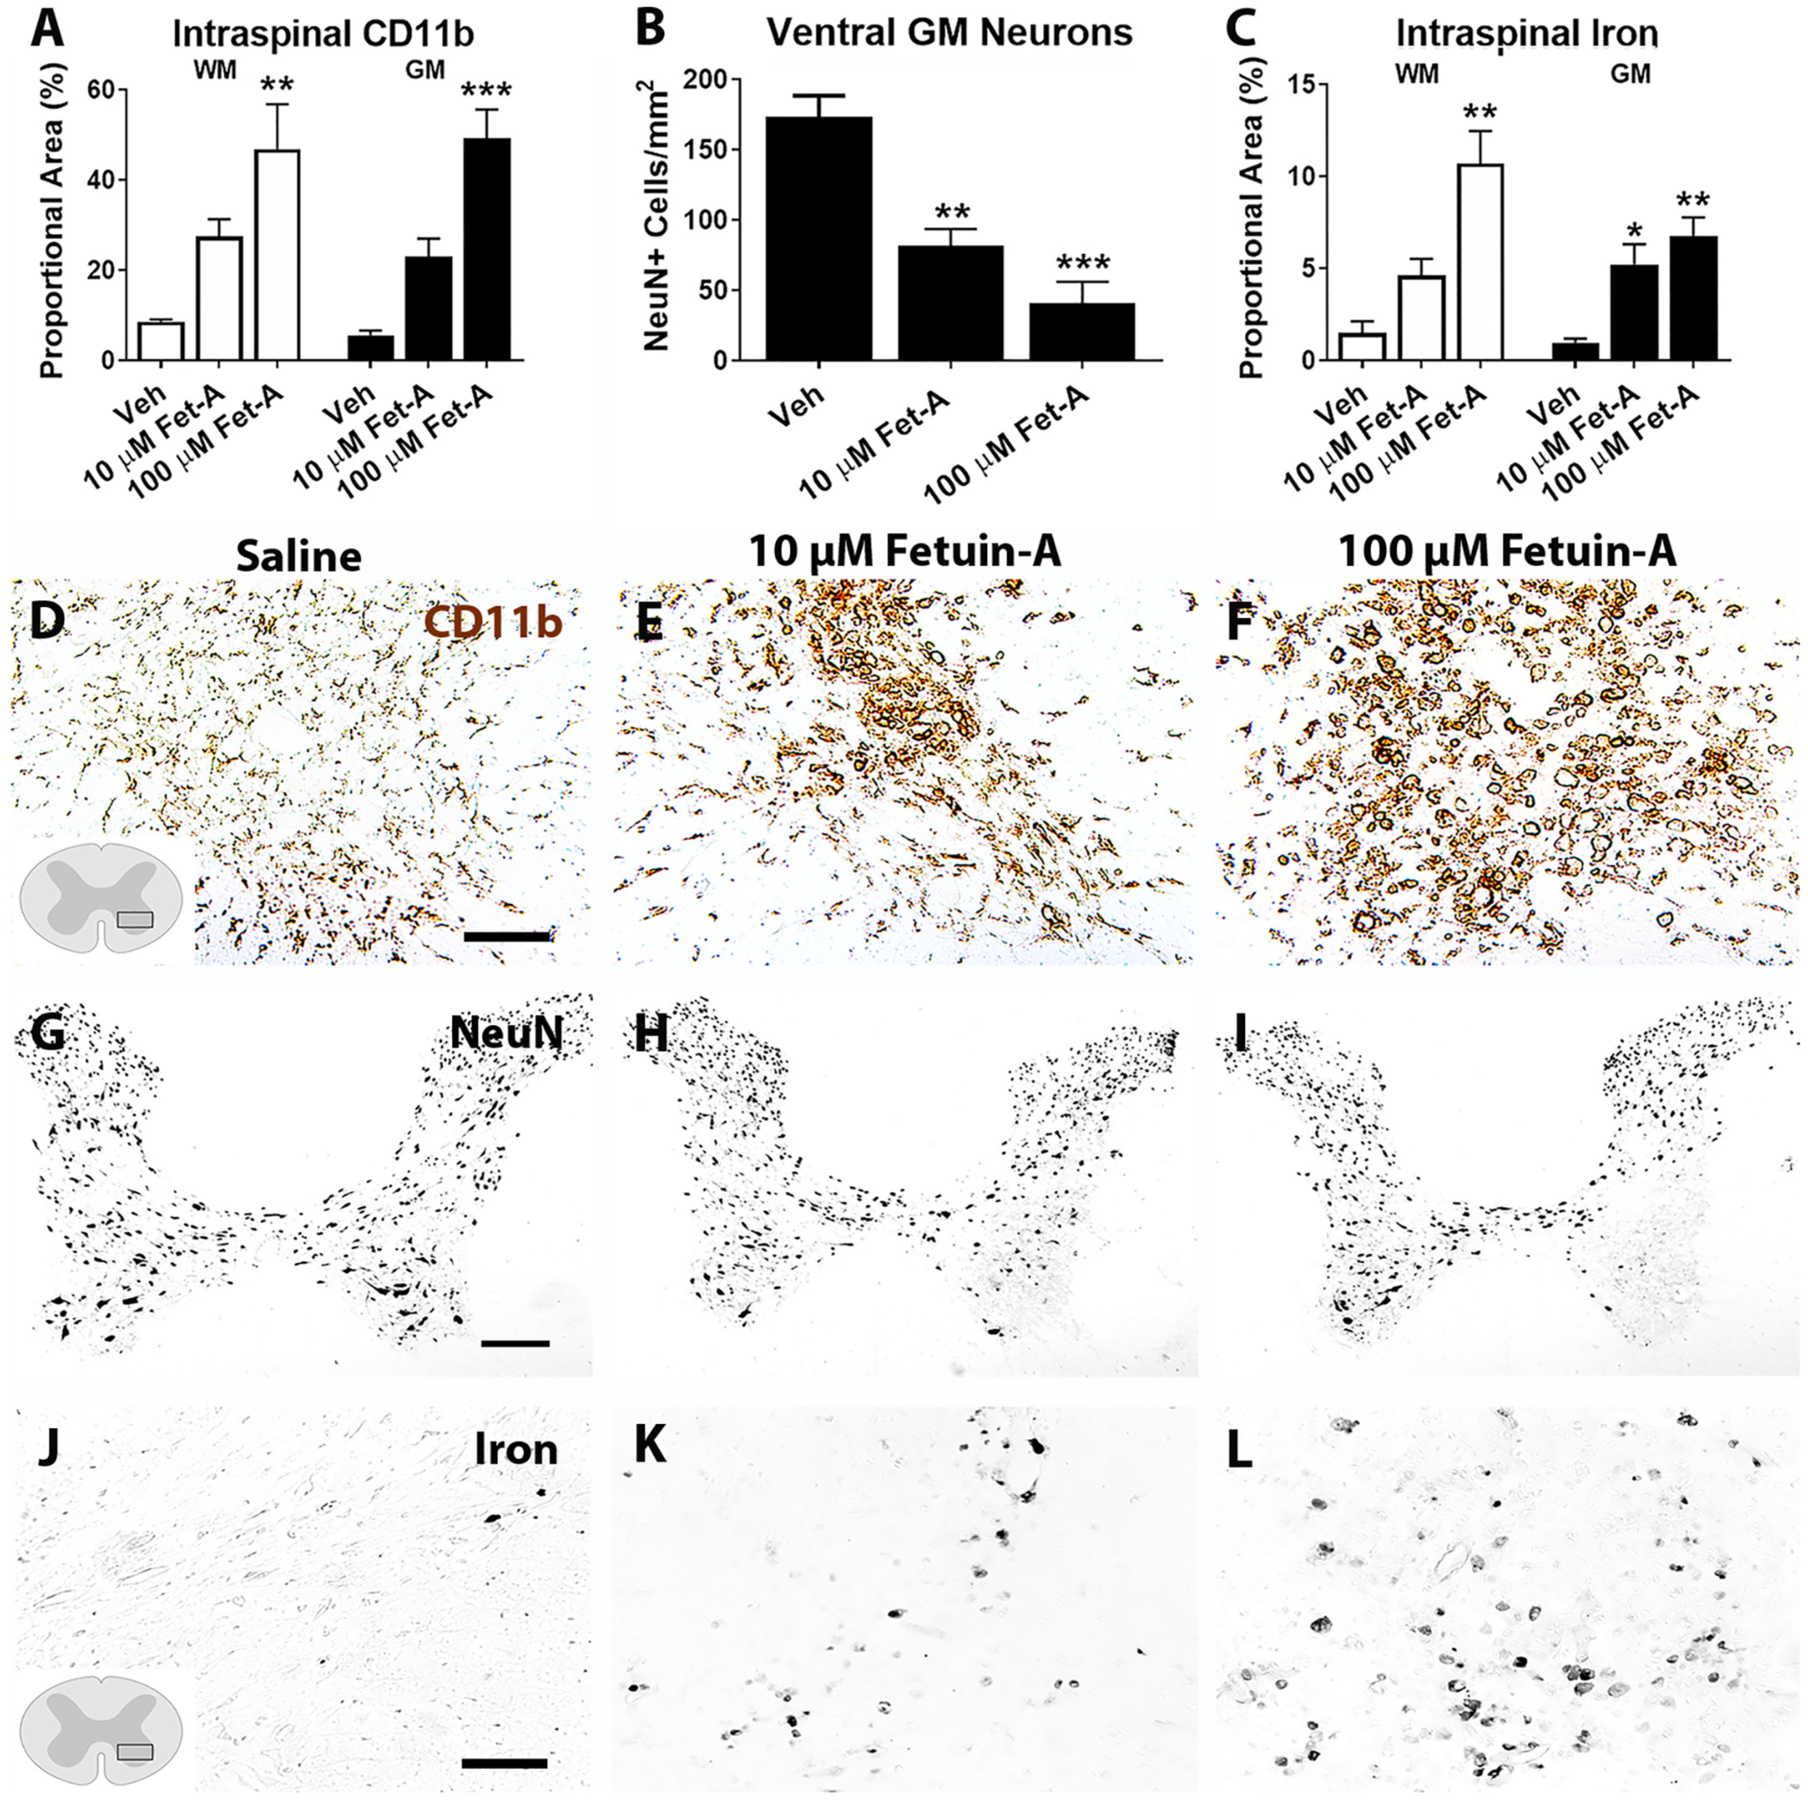
The current high obesity rates mean that neurological injuries are increasingly sustained on a background of systemic pathology, including liver inflammation, which likely has a negative impact on outcomes. Because obesity involves complex pathology, the effect of hepatic inflammation alone on neurological recovery is unknown. Thus, here we used a gain-of-function model to test if liver inflammation worsens outcome from spinal cord injury (SCI) in rats. Results show liver inflammation concomitant with SCI exacerbated intraspinal pathology and impaired locomotor recovery. Hepatic inflammation also potentiated SCI-induced non-alcoholic steatohepatitis (NASH), endotoxemia and insulin resistance. Circulating and cerebrospinal levels of the liver-derived protein Fetuin-A were higher in SCI rats with liver inflammation, and, when microinjected into intact spinal cords, Fetuin-A caused macrophage activation and neuron loss. Thus, liver inflammation functions as a disease modifying factor to impair recovery from SCI, and Fetuin-A is a potential neuropathological mediator. Since SCI alone induces acute liver inflammation, the liver may be a novel clinical target for improving recovery from SCI.

Keywords: ALT; Fatty liver disease; Hepatocyte ballooning; Iron; Kupffer cells; Metabolic syndrome; Obesity; TLR4; TNF; White matter sparing.


Conflict of interest statement

Authors disclosure statement

No competing interests exist.

Declaration of Competing Interest

Authors declare there are no competing interests.

Figures

Fig. 1.
Fig. 1.
Permanent bile duct ligation (BDL) experimental timeline.
Fig. 2.
Fig. 2.
SCI plus permanent bile duct ligation (BDL) causes liver fibrosis and brain gliosis. (A) Hepatic TNFα, IL-1β and CD11b were significantly elevated at 5d post-ligation compared to sham-operated controls. *p < .05 and ** p < .01 vs. Sham via ANOVA and Bonferroni post hoc test. n = 3/group. Circulating (B) bile salts and (C) ammonia were significantly elevated in rats that received BDL alone or BDL + SCI. **p < .01 and ***p < .001 vs. Sham and SCI via RM ANOVA and Bonferroni post hoc test. (D) Trichromestained livers from BDL + SCI rats showed extensive fibrosis and altered hepatocyte cytoarchitecture at 28d post-ligation and 23d post-SCI. (E) BDL + SCI liver mass was significantly increased vs. sham and SCI. *p < .05 via ANOVA and Bonferroni post hoc test. (F–I) BDL + SCI rat brains showed significant Iba1+ microglia activation and GFAP+ astrogliosis at 23d post-injury. *p < .05, **p < .01and ***p < .001 via ANOVA and Bonferroni post hoc test. Asterisks directly above bars represent significance vs. Sham. (C-J) Sham, BDL, BDL + SCI, n = 5; SCI, n = 8. Scale bars = 100 μm in D and 50 μm in F and H. Error bars represent ±SEM.
Fig. 3.
Fig. 3.
Reversible bile duct ligation (rBDL) experimental timeline.
Fig. 4.
Fig. 4.
SCI plus reversible bile duct ligation (rBDL) induces transient changes in circulating ammonia and bile salts, limited liver fibrosis and no signs of brain gliosis. (A) Hepatic TNFα, IL-1β and CD11b mRNA were significantly increased 5d after rBDL compared to sham-operated controls. *p < .05 and ** p < .01 vs. Sham via ANOVA and Bonferroni post hoc test. n = 3/group. (B,C) Circulating bile salts and ammonia increased one day after rBDL then returned to sham and SCI control levels 5–7d after BDL release. *p < .05, **p < .01 and ***p < .001 vs. Sham and SCI via RM ANOVA and Bonferroni post hoc test. (D) Trichrome-stained livers showed limited signs of fibrosis in rBDL+SCI rats at 28d post-ligation/23d post-SCI. (E) Liver mass was not different between groups (p = .3396, ANOVA). (F–I) No significant differences in Iba1+ microglia (p = .6729 ANOVA) or GFAP+ astrocytes (p = .4266 ANOVA) were observed between groups. (C-J) Sham, rBDL, n = 4; rBDL, rBDL+SCI, n = 7. Scale bars = 100 μm in D and 50 μm in F, H. Error bars represent ± SEM.
Fig. 5.
Fig. 5.
Post-injury hindlimb locomotor recovery is impaired if the liver is inflamed at the time of SCI (rBDL + SCI). (A) Hindlimb function was assessed using the BBB scale, which revealed rBDL+SCI rats had significantly worse locomotor function compared to SCI controls. (RM ANOVA treatment effect, p < .05; treatment × time interaction, p < .01; Bonferroni post hoc test.) (B) BBB subscores trended lower in rBDL+SCI rats. (RM ANOVA treatment × time interaction, p = .059) (C) rBDL+SCI rats had significantly fewer hindlimb plantar steps compared to SCI controls. (RM ANOVA treatment effect, p < .01; treatment × time interaction, p < .01; Bonferroni post hoc test). SCI and rBDL+SCI, n = 7. (D–F) An independent replication study again showed rBDL+SCI rats had lower BBB scores (RM ANOVA treatment effect, p < .01; treatment × time interaction, p < .0001; Bonferroni post hoc test), BBB subscores (RM ANOVA treatment effect, p < .01; treatment × time interaction, p < .0001; Bonferroni post hoc test), and frequency of plantar stepping (RM ANOVA treatment effect, p < .05; treatment × time interaction, p < .001; Bonferroni post hoc test). *p < .05, **p < .01, ***p < .001 vs SCI. SCI and rBDL+SCI, n = 6. Error bars represent ± SEM.
Fig. 6.
Fig. 6.
Hepatic inflammation at the time of SCI increased intraspinal pathology and microglial/ macrophage activation at 3 weeks post-injury. (A) Cross sections representing the mean spared white matter from control SCI and rBDL+SCI spinal cords at lesion epicenters and ± 1 mm. Myelin is labeled blue. (B) Stereological measurement of myelin area revealed rBDL+SCI sections had significantly reduced myelin overall as well as at several distances rostral (R) to the epicenter. (RM ANOVA treatment effect, p < .05; Bonferroni post hoc analysis) (C) The volume of white matter was significantly reduced in rBDL+SCI spinal cords (t-test, p < .01). (D) Stereological measurement of lesioned tissue shows a significant increase in rBDL+SCI cords (RM ANOVA treatment effect, p < .01; Bonferroni post hoc analysis). (E) The lesion volume was significantly increased in rBDL+SCI spinal cords (t-test, p < .05). (F) Cross sections representing mean CD11b + macrophages from control SCI and rBDL+SCI spinal cords at lesion epicenters and ± 1 mm. (G) Intraspinal CD11b was significantly increased rostral to the epicenter (RM ANOVA, interaction, p < .05; Bonferroni post hoc analysis). (H) Cross sections representing mean CD68+ macrophages from control SCI and rBDL+SCI spinal cords at lesion epicenters and ± 1 mm. (I) Intraspinal CD68 showed a significant treatment effect (RM ANOVA treatment effect, p < .05). SCI control, n = 6; rBDL+SCI, n = 7. Error bars represent mean ± SEM.
Fig. 7.
Fig. 7.
SCI with concomitant hepatic inflammation (rBDL + SCI) exacerbates post-injury liver inflammation, hepatic immune cell infiltration and circulating TNFα levels. (A,B) Representative images of Clec4F and CD11b immunolabeled livers at 23d post-SCI and rBDL release show exacerbated Kupffer cell activation and inflammatory infiltrates in rBDL+SCI livers. (C,D) Quantification of Clec4f+ and CD11b+ immunoreactive area expressed as % of total hepatocyte area showed significantly increased levels in the rBDL+SCI group compared to all other groups; both were also significantly higher in the SCI group vs. sham controls. (E) Liver MPO+ neutrophils were significantly elevated in SCI and rBDL+SCI livers vs. sham controls. rBDL+SCI did not change MPO+ neutrophil counts compared to SCI. (F) Liver CD3+ T cells were significantly increased in rBDL+SCI rat livers vs. all other groups. (G,H) Liver mRNA for IL-1β and TNFα were elevated when SCI was performed on a background of liver inflammation. (I) Circulating TNFα was persistently elevated in rBDL+SCI rats. (RM ANOVA treatment effect, p < .05; Bonferroni post hoc analysis). (J) Hepatic mRNA for TGFβ was elevated when SCI was performed on a background of liver inflammation. *p < .05, **p < .01 and ***p < .001 via one-way ANOVA and Bonferroni post hoc test in (C–H and J). Asterisks above bars represent significance vs. Sham. Sham and rBDL, n = 4; SCI and rBDL+SCI, n = 7. Scale bars = 100 μm. Error bars represent ±SEM.
Fig. 8.
Fig. 8.
SCI with concomitant liver inflammation increases post-injury hepatic steatosis and damage compared to SCI alone. (A,B) Representative images of Oil red O+ lipid and hematoxylin and eosin-stained livers at 23d after SCI and rBDL release. SCI alone increases lipid accumulation. This is exacerbated in the rBDL+SCI livers, which show extensive hepatocyte ballooning (arrowheads) and cellular infiltrates (arrow). (C) Lipid staining area expressed as % of total hepatocyte area showed significantly increased lipid accumulation in SCI and rBDL+SCI livers. rBDL+SCI values were also greater than rBDL or SCI alone. *p < .05, **p < .01 and ***p < .001 via one-way ANOVA and Bonferroni post hoc test. (D) Lipids quantified by droplet size revealed increases in rBDL and SCI livers, with the largest fat droplet sizes in rBDL+SCI livers. **p < .01 and ***p < .001 via one-way ANOVA and Bonferroni post hoc test in C and D. (E) Serum ALT levels transiently rose after rBDL and remained elevated in SCI and rBDL+SCI rats. rBDL+SCI doubled ALT compared to SCI alone. *p < .05, ** p < .01 and ***p < .001 vs. Sham, ^^ p < .01 vs rBDL and Sham and +++ p < .001 vs rBDL, SCI and Sham in (E) via RM ANOVA and Bonferroni post hoc test. Sham, rBDL n = 4; SCI, rBDL+SCI, n = 7. Scale bars = 100 μm in (A) and 50 μm in (B). Error bars represent ±SEM.
Fig. 9.
Fig. 9.
SCI on a background of liver inflammation (rBDL + SCI) increases circulating non-esterified fatty acids (NEFA) and white adipose tissue and disrupts circulating glucose and insulin homeostasis. (A) rBDL+SCI increased circulating NEFAs (p = .0457 ANOVA). (B) Mesenteric abdominal fat was significantly increased in rBDL+SCI rats compared to all other groups. (C-E) rBDL+SCI significantly increased serum glucose, insulin and HOMA-IR values at 23dpi. *p < .05, **p < .01 and ***p < .001 via one-way ANOVA and Bonferroni post hoc test. Asterisks directly above bars represent significance vs. Sham. Sham, rBDL, n = 4; SCI, rBDL+SCI, n = 7. Error bars represent +SEM.
Fig. 10.
Fig. 10.
SCI with concomitant liver inflammation increases post-injury hepatic iron accumulation. (A,B) Representative images and quantification of Perls+ staining area expressed as % of total hepatocyte area show elevated hepatic iron after rBDL+SCI compared to sham and rBDL alone. (C,D) Representative images and quantification of liver H-Ferritin show elevated liver H-ferritin in both rBDL+SCI and SCI groups compared to sham and rBDL controls. *p < .05 and **p < .01 via one-way ANOVA and Bonferroni post hoc test. Asterisks directly above bars represent significance vs. Sham. Sham, rBDL, n = 4; SCI, rBDL+SCI, n = 7. Scale bars = 100 μm. Error bars represent +SEM.
Fig. 11.
Fig. 11.
Liver inflammation at the time of SCI (rBDL + SCI) potentiates intraspinal IL-6, circulating endotoxins and Fetuin-A expression compared to SCI alone. (A-D) Intraspinal mRNA expression in the injury epicenter at 24 h post-injury of TNFα, IL-1β, IL-6 and CD11b were measured, revealing a significant increase in IL-1β, IL-6 and CD11b after SCI. rBDL+SCI potentiated IL-6 expression compared to SCI alone. (E) Serum endotoxin levels significantly increased in SCI and rBDL+SCI rats vs. sham and rBDL groups (RM ANOVA treatment effect, p < .05; *p < .05, **p < .01 and ***p < .001 via Bonferroni post hoc analysis). (F–H) Cerebrospinal fluid (CSF) endotoxin, ammonia and bile salts were unchanged in all groups. (I,J) Hepatic Fetuin-A mRNA significantly increased in rBDL+SCI rats vs. shams at 1 and 23 dpi. (K, L) Circulating and CSF Fetuin-A protein was elevated at 23dpi in rBDL+SCI rats compared to all other groups. *p < .05, **p < .01 and ***p < .001 via one-way ANOVA and Bonferroni post hoc test. Asterisks directly above bars represent significance vs. Sham. Sham, rBDL, n = 4; SCI, rBDL+SCI, n = 7. Error bars represent +SEM.
Fig. 12.
Fig. 12.
Intraspinal injection of Fetuin-A increases macrophage and microglia activation, kills neurons and increases local iron accumulation. Microinjection of recombinant Fetuin-A into the lateral white matter (WM) or ventral gray matter (GM) significantly increased CD11b+ macrophages/microglia (A,D-F), reduced NeuN+ neurons (B, G-I) and increased intraspinal iron (C,J-L). Representative images in D–F are from boxed region in diagram in D. Representative images in J-L are from boxed region in diagram in J. *p < .05, **p < .01 and ***p < .001 vs. vehicle by one-way ANOVA and Bonferroni post hoc test. WM injections, n = 3/group; GM injections, n = 5 per group. Data represent mean ± SEM. Scale bars in (F) = 50 μm, (I) = 100 μm and (L) = 50 μm.

Similar articles

Cited by

References

    1. Agosti P, Sabbà C, Mazzocca A, 2018. Emerging metabolic risk factors in hepatocellular carcinoma and their influence on the liver microenvironment. Biochim. Biophys. Acta 10.1016/j.bbadis.2017.11.026. - DOI - PubMed
    1. Almad A, McTigue DM, 2010. Chronic expression of PPAR-delta by oligodendrocyte lineage cells in the injured rat spinal cord. J. Comp. Neurol 518, 785–799. 10.1002/cne.22242. - DOI - PMC - PubMed
    1. Anderson ER, Shah YM, 2013. Iron homeostasis in the liver. Compr. Physiol 3, 315–330. 10.1002/cphy.c120016. - DOI - PMC - PubMed
    1. Antunes LC, Elkfury JL, Jornada MN, Foletto KC, Bertoluci MC, 2016. Validation of HOMA-IR in a model of insulin-resistance induced by a high-fat diet in Wistar rats. Arch. Endocrinol. Metab 60, 138–142. 10.1590/2359-3997000000169. - DOI - PubMed
    1. Ballestri S, Zona S, Targher G, Romagnoli D, Baldelli E, Nascimbeni F, Roverato A, Guaraldi G, Lonardo A, 2016. Nonalcoholic fatty liver disease is associated with an almost twofold increased risk of incident type 2 diabetes and metabolic syndrome. Evidence from a systematic review and meta-analysis. J. Gastroenterol. Hepatol 31, 936–944. 10.1111/jgh.13264. - DOI - PubMed

Publication types

Substances