. 2021 Jun 15:191:108589.
doi: 10.1016/j.neuropharm.2021.108589. Epub 2021 Apr 30.

Regulation of hippocamposeptal input within the medial septum/diagonal band of Broca

Affiliations

Regulation of hippocamposeptal input within the medial septum/diagonal band of Broca

Joanne C Damborsky et al. Neuropharmacology. .

Abstract

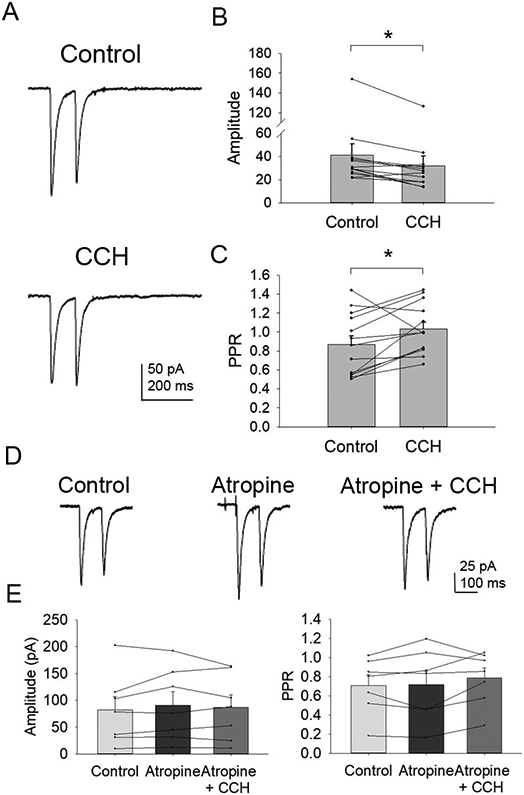
The medial septum/diagonal band of Broca (MS/DBB) receives direct GABAergic input from the hippocampus via hippocamposeptal (HS) projection neurons as part of a reciprocal loop that mediates cognition and is altered in Alzheimer's disease. Cholinergic and GABAergic interactions occur throughout the MS/DBB, but it is not known how HS GABA release is impacted by these circuits. Most HS neurons contain somatostatin (SST), so to evoke HS GABA release we expressed Cre-dependent mCherry/channelrhodopisin-2 (ChR2) in the hippocampi of SST-IRES-Cre mice and then used optogenetics to stimulate HS fibers while performing whole-cell patch clamp recordings from MS/DBB neurons in acute slices. We found that the acetylcholine receptor (AChR) agonist carbachol and the GABAB receptor (GABABR) agonist baclofen significantly decreased HS GABA release in the MS/DBB. Carbachol's effects were blocked by eliminating local GABAergic activity or inhibiting GABABRs, indicating that it was indirectly decreasing HS GABA release by increasing GABAergic tone. There was no effect of acute exposure to amyloid-β on HS GABA release. Repetitive stimulation of HS fibers increased spontaneous GABA release in the MS/DBB, revealing that HS projections can modulate local GABAergic tone. These results show that HS GABA release has far-reaching impacts on overall levels of inhibition in the MS/DBB and is under regulatory control by cholinergic and GABAergic activity. This bidirectional modulation of GABA release from local and HS projections in the MS/DBB will likely have profound impact not only on activity within the MS/DBB, but also on output to the hippocampus and hippocampal-dependent learning and memory.

Keywords: Acetylcholine; Basal forebrain; Cholinergic; GABA; Hippocamposeptal; Medial septum.


Conflict of interest statement

Declarations of interest: none

Figures

Figure 1:
Figure 1:
SST+ GABAergic neurons in the hippocampus form functional connections with MS/DBB neurons. (A) Fluorescent images showing the hippocampus of an SST-Cre mouse that was stereotaxically injected with a Cre-dependent AAV containing mCherry and ChR2. Coronal slices are shown along the rostral to caudal axis. Scale bars = 200 μm. (B) Fluorescent images showing the CA1, CA3 and DG regions of the dorsal hippocampus. DAPI labelling of neurons (white) show relation of mCherry expression relative to CA1 and CA3 pyramidal cell layers and DG granule cell layer. Scale bars = 50 μm. (C) Fluorescent images showing overlap of mCherry expression with SST immunostaining (green) in the CA1 s. oriens. Scale bar = 50 μm (D) Current-clamp recording from an mCherry-expressing neuron in the hippocampus showing action potential firing in response to blue light LED pulses. (E) Fluorescent images showing the presence of mCherry-expressing fibers in the MS/DBB of an SST-Cre mouse that received viral injections in the hippocampus. Scale bars = 100 μm for full image (left), 50 μm for magnified images (right) (F) A 10 ms blue LED pulse elicited IPSCs in the presence of AP5 (40 μM) and DNQX (10 μM) in MS/DBB neurons that had electrophysiology profiles characteristic of cholinergic (left) and GABAergic (right) neurons. (G) HS-mediated IPSCs are blocked by gabazine (10 μM).
Figure 2:
Figure 2:
Activation of mAChRs decreases HS GABA release. (A) Sample traces from an MS/DBB neuron showing HS-IPSCs elicited by two 10 ms LED pulses separated by 100 ms from the start of each pulse prior to and following bath application of 50 μM carbachol. (B) Mean and individual cell data showing that carbachol significantly decreases the amplitude of the first HS-IPSC, n=13. (C) Mean and individual cell data showing that carbachol significantly increases the paired-pulse ratio (PPR) of HS-IPSCs, n=13. (D) Sample traces showing HS-IPSCs prior to and following bath application of atropine (5 μM), and atropine + carbachol. (E) Mean and individual cell data showing that application of atropine prior to and during the application of carbachol blocks the effects of carbachol of HS-IPSC amplitude and PPR, n=7. Data presented ±S.E.M. * indicates p<0.05
Figure 3:
Figure 3:
Presynaptic GABABRs regulate HS GABA release. (A) Sample traces from an MS/DBB neuron showing HS-IPSCs prior to and following bath application of 200 nM baclofen. (B) Mean and individual cell data showing that 200 nM baclofen significantly decreases HS-IPSC amplitude and increases PPR, n=8. (C) Sample traces from an MS/DBB neuron showing HS-IPSCs prior to and following bath application of 20 μM baclofen. (D) Individual cell data showing HS-IPSC amplitude prior to and following bath application of 20 μM baclofen, n=7. Baclofen blocked HS-IPSCs entirely in 5 of 7 cells. (E) Mean and individual cell data showing that the GABABR antagonist CGP 55845 (2 μM) blocks the effects of 20 μM baclofen on HS-IPSC amplitude and PPR, n=5. (F) Sample traces showing HS-IPSCs recorded from an MS/DBB neuron prior to and following bath application of AP5 (40 μM), DNQX (10 μM), TTX (1 μM), and 4-AP (20 μM). (G) Sample recording from an MS/DBB neuron showing that in the presence of TTX and 4-AP there is no response to the second light pulse in a paired-pulse stimulation protocol. (H) Sample traces and mean data showing that in the presence of TTX and 4-AP, 20 μM baclofen significantly reduces HS-IPSC amplitude, n=6. Data presented ±S.E.M. * indicates p<0.05
Figure 4:
Figure 4:
Carbachol-induced decrease in HS GABA release is dependent on local GABA network activity. (A) Sample traces showing an HS-IPSC in the presence of TTX and 4-AP prior to and following bath application of carbachol (50 μM). (B) Mean and individual cell data showing that there is no effect of carbachol on the amplitude of HS-IPSCs recorded in the presence of TTX and 4-AP, n=8. (C) Sample traces recorded from an MS/DBB neurons showing HS-IPSCs in the presence of CGP 55845 (2 μM) and CGP 55845 + carbachol (50 μM). (D) Mean and individual cell data showing that in the presence of CGP55845, carbachol has no effect on HS-IPSC amplitude or PPR, n=9. Data presented ±S.E.M.
Figure 5:
Figure 5:
Train HS stimulation increases local spontaneous GABA release in the MS/DBB. (A) Sample traces from an MS/DBB neuron showing sIPSCs recorded prior to and following 2s, 10 Hz optogenetic stimulation of HS fibers in the MS/DBB. Histogram data from one cell showing the number of IPSCs recorded in 10s bins prior to and following train HS stimulation (arrow). (B) Mean and individual cell data, raw and normalized, showing the frequency and amplitude of sIPSCs prior to and following train HS stimulation, n=8. (C) Sample traces from a MS/DBB neurons showing HS-IPSCs prior to and following bath application of the GABABR PAM CGP 7930 (30 μM). (D) Mean and individual cell data showing the amplitude and PPR of HS-IPSCs prior to and following bath application of CGP 7930, n=10. (E) Sample traces from an MS/DBB neuron showing sIPSCs recorded prior to and following train HS stimulation in the presence of CGP 7930. (F) Mean and individual cell data showing the frequency and amplitude of sIPSCs prior to and following train HS stimulation in the presence of CGP 7930, n=8. Data presented ±S.E.M. * indicates p<0.05
Figure 6:
Figure 6:
Train HS stimulation does not have long-lasting effects on HS GABA release. (A) Sample trace showing two HS-IPSC separated by 2 s. (B) Mean and individual cell data showing that there is no difference in the amplitude of HS-IPSCs separated by 2s, n=11. (C) Sample trace showing HS-IPSCs recorded at the start of (pre), immediately following (post), and 5, 10, and 15 s after the conclusion of a 2s, 10 Hz optogenetic stimulation protocol. (D) Mean data showing that there is a significant decrease in HS-IPSC amplitude immediately following the 10HZ stimulation protocol (post), but no significant difference in HS-IPSC amplitudes 5, 10, or 15 s following the train stimulation as compared to control (pre-stimulus) amplitudes, n=11. (E) Normalized individual cell data showing the change in HS-amplitudes following 10 Hz optogenetic train stimulation, n=11. Data presented ±S.E.M. * indicates p<0.05
Figure 7:
Figure 7:
Amyloid-β (Aβ) does not affect HS GABA release. (A) Sample recordings from an MS/DBB neuron showing HS-IPSCs prior to and following 10 min bath application of Aβ (100 nM). (B) Mean and individual cell data showing HS-IPSC amplitude and PPR prior to and following bath application of Aβ, n=5. Data presented ±S.E.M.
Figure 8:
Figure 8:
Proposed model showing cholinergic and GABAergic regulation of HS input in the MS/DBB. (A) HS projections (red) synapse onto GABAerigc (blue) and cholinergic (green) neurons in the MS/DBB, which also form functional connections with each other (Toth et al., 1993; Henderson and Jones, 2005; Mattis et al., 2014; Yang et al., 2014; Leao et al., 2015; Damborsky et al., 2016) (B) Activation of mAChRs (green squares) significantly decreases HS GABA release. This effect of mAChR activation on HS GABA release is blocked by a GABABR antagonist and by blocking network activity with TTX. Thus, activation of mAChRs appears to be working indirectly to decrease HS GABA release by increasing GABAergic tone in the MS/DBB, resulting in activation of GABABRs (orange triangles). (C) Activation of GABABRs on HS presynaptic terminals decreases HS GABA release and prevents the HS-induced increase in spontaneous GABA release.

References

    1. Alonso A, Kohler C (1982) Evidence for separate projections of hippocampal pyramidal and non-pyramidal neurons to different parts of the septum in the rat brain. Neuroscience letters 31:209–214. - PubMed
    1. Alreja M, Wu M, Liu W, Atkins JB, Leranth C, Shanabrough M (2000) Muscarinic tone sustains impulse flow in the septohippocampal GABA but not cholinergic pathway: implications for learning and memory. The Journal of neuroscience : the official journal of the Society for Neuroscience 20:8103–8110. - PMC - PubMed
    1. Ballinger EC, Ananth M, Talmage DA, Role LW (2016) Basal Forebrain Cholinergic Circuits and Signaling in Cognition and Cognitive Decline. Neuron 91:1199–1218. - PMC - PubMed
    1. Bartus RT, Dean RL, Beer B, Lippa AS (1982) The Cholinergic Hypothesis of Geriatric Memory Dysfunction. Science 217:408–417. - PubMed
    1. Blasco-Ibanez JM, Freund TF (1995) Synaptic input of horizontal interneurons in stratum oriens of the hippocampal CA1 subfield: structural basis of feed-back activation. The European journal of neuroscience 7:2170–2180. - PubMed

Publication types