

Effects of accumulated environmental, social and host exposures on early childhood educational outcomes
- PMID: 33933487
- PMCID: PMC8176571
- DOI: 10.1016/j.envres.2021.111241
Effects of accumulated environmental, social and host exposures on early childhood educational outcomes
Abstract
Background: Persistent disparities in academic performance may result from a confluence of adverse exposures accruing disproportionately to specific subpopulations.
Objective: Our overarching objective was to investigate how multiple exposures experienced over time affect early childhood educational outcomes. We were specifically interested in whether there were: racial/ethnic disparities in prevalence of adverse exposures; racial/ethnic disparities in associations observed between adverse exposures and early childhood educational outcomes; and interactions between exposures, suggesting that one exposure augments susceptibility to adverse effects of another exposure.
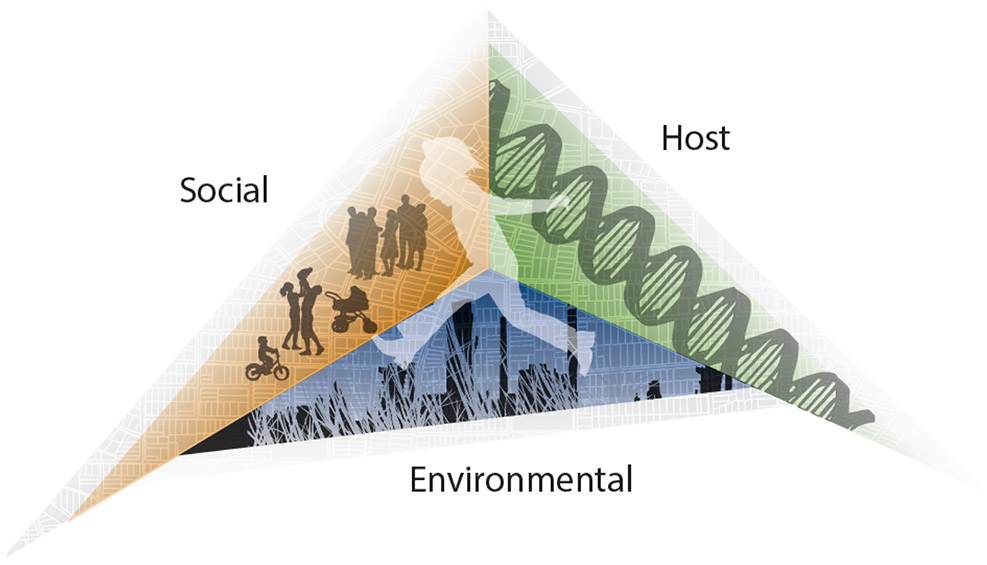
Methods: We link geocoded North Carolina birth data for non-Hispanic white (NHW) and non-Hispanic black (NHB) children to blood lead surveillance data and 4th grade end-of-grade (EOG) standardized test scores (n = 65,151). We construct a local, spatial index of racial isolation (RI) of NHB at the block group level. We fit race-stratified multi-level models of reading and mathematics EOG scores regressed on birthweight percentile for gestational age, blood lead level, maternal smoking, economic disadvantage, and RI, adjusting for maternal- and child-level covariates and median household income.
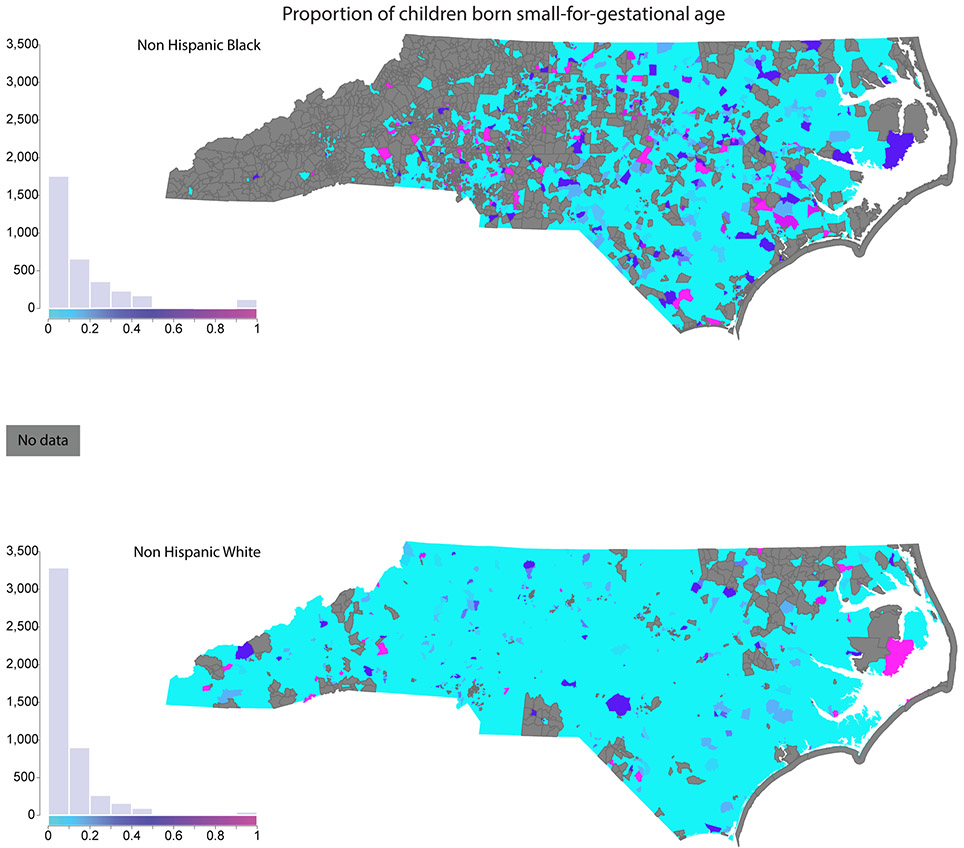
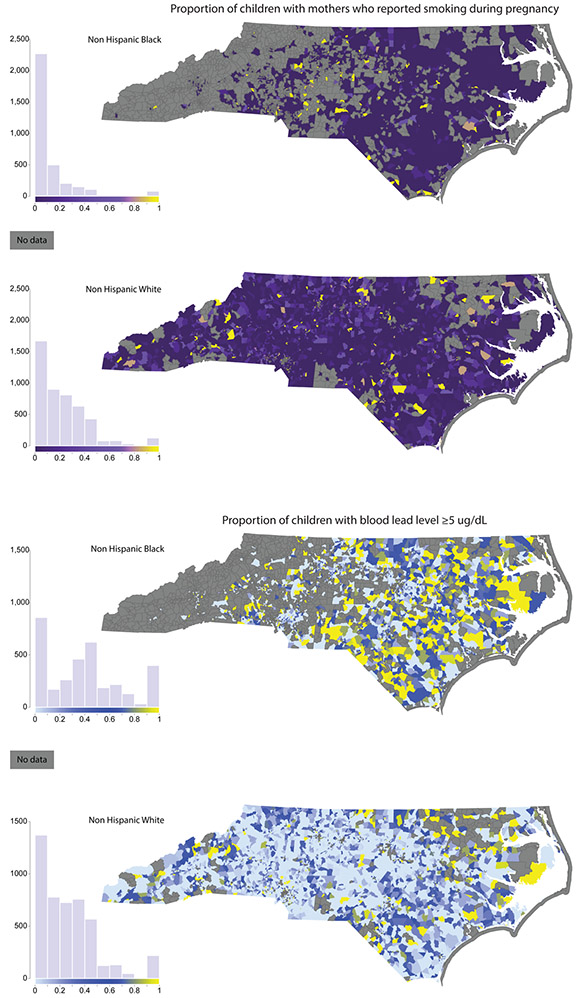
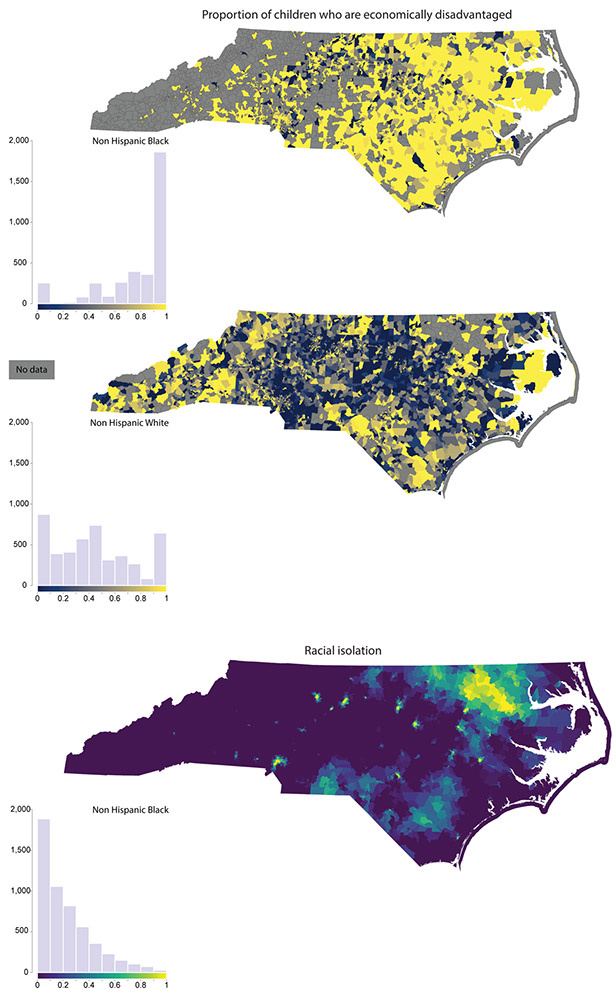
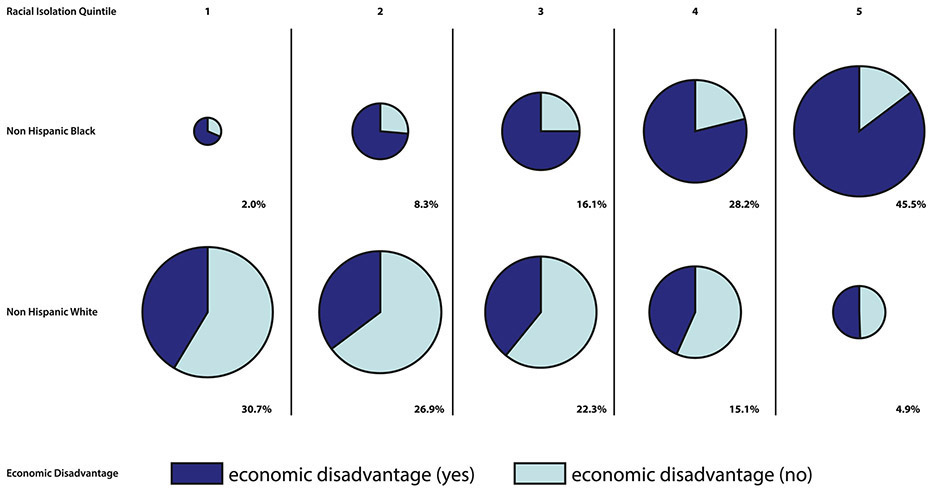
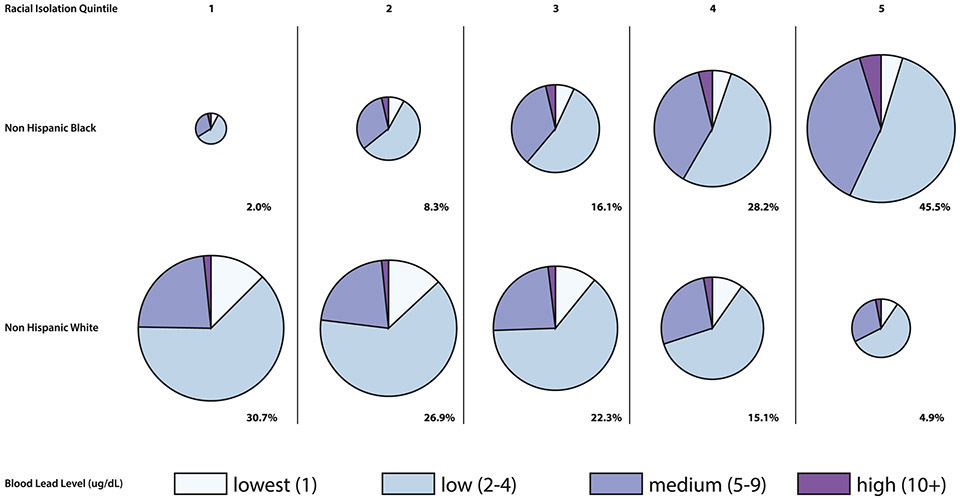
Results: There were marked racial/ethnic disparities in prevalence of adverse exposures. Specifically, NHB children were more likely than NHW children to be economically disadvantaged (80% vs. 40%), live in block groups with the highest quintile of RI (46% vs. 5%), have higher blood lead levels (4.6 vs. 3.7 μg/dL), and lower birthweight percentile for gestational age (mean: 39th percentile vs. 51st percentile). NHB children were less likely to have mothers who reported smoking during pregnancy (11% and 22%). We observed associations between key adverse exposures and reading and math EOG scores in 4th grade. Higher birthweight percentile for gestational age was associated with higher EOG scores, while economic disadvantage, maternal smoking, and elevated blood lead levels were associated with lower EOG scores. Associations observed for NHB and NHW children were generally not statistically different from one another, with the exception of neighborhood RI. NHB children residing in block groups in the highest RI quintile had reading and math scores 1.54 (0.74, 2.34) and 1.12 (0.38, 1.87) points lower, respectively, compared to those in the lowest RI quintile; statistically significant decrements in EOG scores associated with RI were not observed for NHW children. We did not find evidence of multiplicative interactions between exposures for NHB or NHW children.
Discussion: Key adverse host, environmental, and social exposures accrue disproportionately to NHB children. Decrements in test scores associated with key adverse exposures were often but not always larger for NHB children, but were not significantly different from those estimated for NHW children. While we did not observe interactive effects, NHB children on average experience more deleterious combined exposures, resulting in larger decrements to test scores compared to NHW children.
Keywords: Childhood lead exposure; Early childhood educational outcomes; Multiple exposures; Racial isolation; Standardized test scores.
Copyright © 2021 Elsevier Inc. All rights reserved.
Conflict of interest statement
Declaration of interests
The authors declare that they have no known competing financial interests or personal relationships that could have appeared to influence the work reported in this paper.
Figures
References
-
- Norman O, Ault CR Jr, Bentz B, Meskimen L. The black–white “achievement gap” as a perennial challenge of urban science education: A sociocultural and historical overview with implications for research and practice. The Journal of Research in Science and Teaching. 2001;38(10):1101–14.
-
- Finn JD, Gerber SB, Boyd-Zaharias J. Small Classes in the Early Grades, Academic Achievement, and Graduating From High School. Journal of Educational Pyschology. 2005;97(2):214–23.
-
- Centers for Disease Control and Prevention. Vital Statistics Data Available Online,. In: Prevention CfDCa, editor. Atlanta, GA: 2006.
Publication types
MeSH terms
Substances
Grants and funding
LinkOut - more resources
Full Text Sources
Other Literature Sources
