

A predictive model of clinical deterioration among hospitalized COVID-19 patients by harnessing hospital course trajectories
- PMID: 33933654
- PMCID: PMC8084618
- DOI: 10.1016/j.jbi.2021.103794
A predictive model of clinical deterioration among hospitalized COVID-19 patients by harnessing hospital course trajectories
Abstract
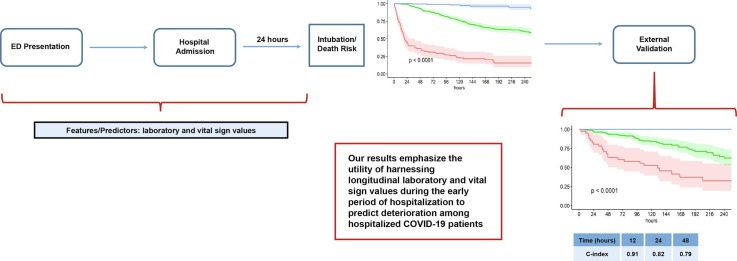
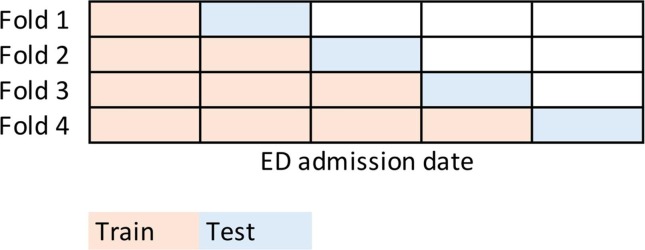
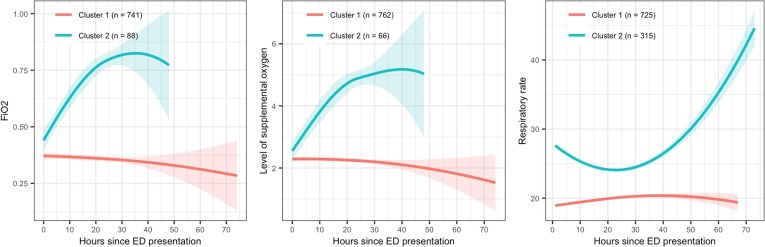
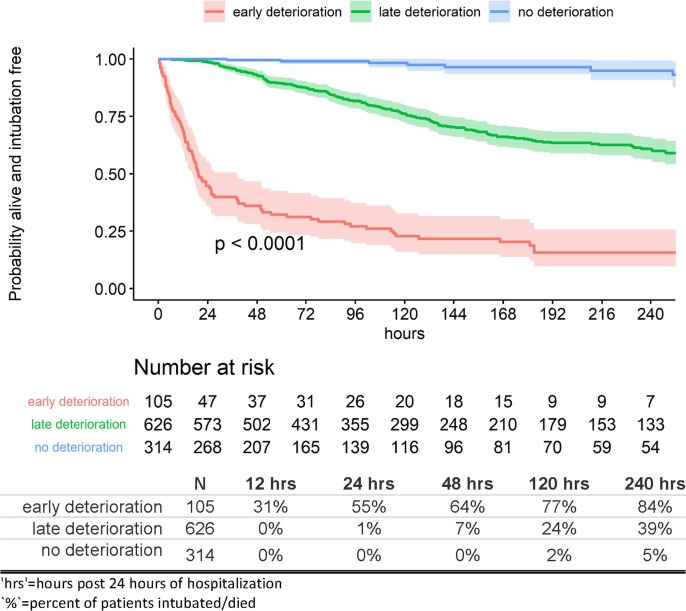
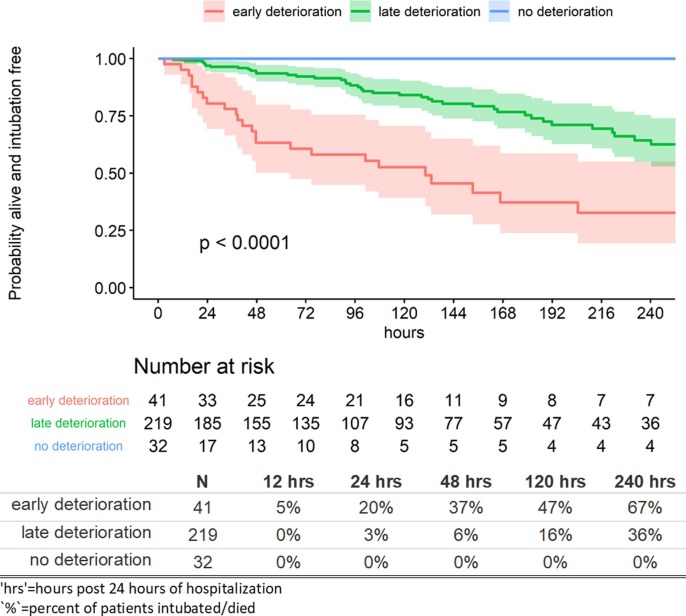
From early March through mid-May 2020, the COVID-19 pandemic overwhelmed hospitals in New York City. In anticipation of ventilator shortages and limited ICU bed capacity, hospital operations prioritized the development of prognostic tools to predict clinical deterioration. However, early experience from frontline physicians observed that some patients developed unanticipated deterioration after having relatively stable periods, attesting to the uncertainty of clinical trajectories among hospitalized patients with COVID-19. Prediction tools that incorporate clinical variables at one time-point, usually on hospital presentation, are suboptimal for patients with dynamic changes and evolving clinical trajectories. Therefore, our study team developed a machine-learning algorithm to predict clinical deterioration among hospitalized COVID-19 patients by extracting clinically meaningful features from complex longitudinal laboratory and vital sign values during the early period of hospitalization with an emphasis on informative missing-ness. To incorporate the evolution of the disease and clinical practice over the course of the pandemic, we utilized a time-dependent cross-validation strategy for model development. Finally, we validated our prediction model on an external validation cohort of COVID-19 patients served in a demographically distinct population from the training cohort. The main finding of our study is the identification of risk profiles of early, late and no clinical deterioration during the course of hospitalization. While risk prediction models that include simple predictors at ED presentation and clinical judgement are able to identify any deterioration vs. no deterioration, our methodology is able to isolate a particular risk group that remain stable initially but deteriorate at a later stage of the course of hospitalization. We demonstrate the superior predictive performance with the utilization of laboratory and vital sign data during the early period of hospitalization compared to the utilization of data at presentation alone. Our results will allow efficient hospital resource allocation and will motivate research in understanding the late deterioration risk group.
Keywords: COVID-19; Deterioration; EMR; Intubation; Machine learning; Prediction.
Copyright © 2021 Elsevier Inc. All rights reserved.
Conflict of interest statement
The authors declare the following financial interests/personal relationships which may be considered as potential competing interests: [Monika Safford received salary support for investigator-initiated research on CVD risk reduction strategies using large databases.].
Figures
Similar articles
-
Early identification of patients admitted to hospital for covid-19 at risk of clinical deterioration: model development and multisite external validation study.BMJ. 2022 Feb 17;376:e068576. doi: 10.1136/bmj-2021-068576. BMJ. 2022. PMID: 35177406 Free PMC article.
-
Machine Learning to Predict Mortality and Critical Events in a Cohort of Patients With COVID-19 in New York City: Model Development and Validation.J Med Internet Res. 2020 Nov 6;22(11):e24018. doi: 10.2196/24018. J Med Internet Res. 2020. PMID: 33027032 Free PMC article.
-
Early prediction of level-of-care requirements in patients with COVID-19.Elife. 2020 Oct 12;9:e60519. doi: 10.7554/eLife.60519. Elife. 2020. PMID: 33044170 Free PMC article.
-
External validation of six COVID-19 prognostic models for predicting mortality risk in older populations in a hospital, primary care, and nursing home setting.J Clin Epidemiol. 2024 Apr;168:111270. doi: 10.1016/j.jclinepi.2024.111270. Epub 2024 Feb 2. J Clin Epidemiol. 2024. PMID: 38311188
-
Technologies used by nursing to predict clinical deterioration in hospitalized adults: a scoping review.Rev Bras Enferm. 2022 Jul 29;75(5):e20210570. doi: 10.1590/0034-7167-2021-0570. eCollection 2022. Rev Bras Enferm. 2022. PMID: 35920514 English, Portuguese.
Cited by
-
Interpretable Machine Learning for Inpatient COVID-19 Mortality Risk Assessments: Diabetes Mellitus Exclusive Interplay.Sensors (Basel). 2022 Nov 12;22(22):8757. doi: 10.3390/s22228757. Sensors (Basel). 2022. PMID: 36433354 Free PMC article.
-
Artificial intelligence and discrete-event simulation for capacity management of intensive care units during the Covid-19 pandemic: A case study.J Bus Res. 2023 May;160:113806. doi: 10.1016/j.jbusres.2023.113806. Epub 2023 Mar 3. J Bus Res. 2023. PMID: 36895308 Free PMC article.
-
Incubation period, clinical and lung CT features for early prediction of COVID-19 deterioration: development and internal verification of a risk model.BMC Pulm Med. 2022 May 12;22(1):188. doi: 10.1186/s12890-022-01986-0. BMC Pulm Med. 2022. PMID: 35549897 Free PMC article.
-
Novel informatics approaches to COVID-19 Research: From methods to applications.J Biomed Inform. 2022 May;129:104028. doi: 10.1016/j.jbi.2022.104028. Epub 2022 Feb 16. J Biomed Inform. 2022. PMID: 35181495 Free PMC article. No abstract available.
-
Coronavirus Anatomy and Its Analytical Approaches for Targeting COVID-19.Adv Exp Med Biol. 2024;1457:33-44. doi: 10.1007/978-3-031-61939-7_2. Adv Exp Med Biol. 2024. PMID: 39283419 Review.
References
-
- D. Berndt, C. J., Using dynamic time warping to find patterns in time series, in: AAAIWS'94: Proceedings of the 3rd International Conference on Knowledge Discovery and Data Mining, 1994.
-
- Berndt D.J., Clifford J. Paper Presented at the KDD Workshop. 1994. Using dynamic time warping to find patterns in time series.
-
- Bounthavong M., Watanabe J.H., Sullivan K.M. Approach to addressing missing data for electronic medical records and pharmacy claims data research. Pharmacotherapy: J. Human Pharmacol. Drug Therapy. 2015;35(4):380–387. - PubMed
Publication types
MeSH terms
Grants and funding
LinkOut - more resources
Full Text Sources
Other Literature Sources
Medical
