The TBC1D31/praja2 complex controls primary ciliogenesis through PKA-directed OFD1 ubiquitylation
- PMID: 33934390
- PMCID: PMC8126939
- DOI: 10.15252/embj.2020106503
The TBC1D31/praja2 complex controls primary ciliogenesis through PKA-directed OFD1 ubiquitylation
Abstract
The primary cilium is a microtubule-based sensory organelle that dynamically links signalling pathways to cell differentiation, growth, and development. Genetic defects of primary cilia are responsible for genetic disorders known as ciliopathies. Orofacial digital type I syndrome (OFDI) is an X-linked congenital ciliopathy caused by mutations in the OFD1 gene and characterized by malformations of the face, oral cavity, digits and, in the majority of cases, polycystic kidney disease. OFD1 plays a key role in cilium biogenesis. However, the impact of signalling pathways and the role of the ubiquitin-proteasome system (UPS) in the control of OFD1 stability remain unknown. Here, we identify a novel complex assembled at centrosomes by TBC1D31, including the E3 ubiquitin ligase praja2, protein kinase A (PKA), and OFD1. We show that TBC1D31 is essential for ciliogenesis. Mechanistically, upon G-protein-coupled receptor (GPCR)-cAMP stimulation, PKA phosphorylates OFD1 at ser735, thus promoting OFD1 proteolysis through the praja2-UPS circuitry. This pathway is essential for ciliogenesis. In addition, a non-phosphorylatable OFD1 mutant dramatically affects cilium morphology and dynamics. Consistent with a role of the TBC1D31/praja2/OFD1 axis in ciliogenesis, alteration of this molecular network impairs ciliogenesis in vivo in Medaka fish, resulting in developmental defects. Our findings reveal a multifunctional transduction unit at the centrosome that links GPCR signalling to ubiquitylation and proteolysis of the ciliopathy protein OFD1, with important implications on cilium biology and development. Derangement of this control mechanism may underpin human genetic disorders.
Keywords: OFD1; PKA; praja2; primary cilium; ubiquitin.
© 2021 The Authors. Published under the terms of the CC BY 4.0 license.
Conflict of interest statement
The authors declare that they have no conflict of interest.
Figures
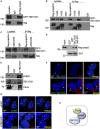
- A
Co‐immunoprecipitation of flag‐praja2 and GFP‐TBC1D31 from lysates of HEK293 cells. The immunoprecipitation (Ip) was performed using an anti‐flag antibody or control IgG.
- B, C
Same as in (A), with the exception that cells expressing flag‐praja2rm or praja2 deletion mutants (praja21–530, praja21–630 and praja2Δ530–630) were included in the analysis.
- D
Lysates expressing flag‐praja2 were subjected to pull down assay with GST and GST‐TBC1D31940–970 polypeptides.
- E
Co‐immunoprecipitation of endogenous TBC1D31/praja2/PKAc complex from cell lysates.
- F
Staining of HEK293 cells with anti‐TBC1D31, anti‐γ‐tubulin and anti‐praja2 antibodies. Nuclei were stained with DRAQ5 (blue). Where indicated, cells were transfected with GFP‐TBC1D31. Arrows indicate the pool of praja2 colocalizing with TBC1D31 staining at the centrosome.
- G
Cells transfected with control siRNA (siCNT) or siRNA targeting TBC1D31 (siTBC1D31) were stained for praja2, anti‐γ‐tubulin and DRAQ5.
- H
Schematic picture of TBC1D31/praja2/PKA complex.
- A
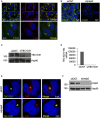
HEK293 cells were fixed and stained with anti‐praja2 and anti‐γ‐tubulin antibodies. Nuclei were stained with DRAQ5.
- B
HEK293 cells transiently transfected with control siRNA or siRNA targeting endogenous praja2 were stained with anti‐praja2 antibody and DRAQ5.
- C
Immunoblot analysis of TBC1D31 and Hsp90 in siRNA‐silenced cells.
- D
Cells were transiently transfected with control siRNA or siRNA targeting endogenous TBC1D31. Total RNA was extracted and analysed by quantitative RT–PCR.
- E
Cells transiently transfected with control siRNA or siRNA targeting endogenous praja2 were stained for TBC1D31, γ‐tubulin and DRAQ5.
- F
Immunoblot analysis of praja2 and Hsp90 in siRNA‐silenced cells.

- A
HEK293 cells transfected with GFP‐TBC1D31 were fixed and immunostained with anti‐OFD1 and anti‐γ‐tubulin antibodies.
- B
HEK293 cells transfected with GFP‐TBC1D31 were fixed and immunostained with anti‐praja2 and anti‐γ‐tubulin antibodies.
- C
HEK293 cells transfected with GFP‐TBC1D31 were fixed and immunostained with anti‐OFD1 and anti‐PKAc antibodies.

- A
HEK293 cells were starved for 24 h and then treated with FSK (40 μM) for 1 h. Lysates were immunoprecipitated with anti‐OFD1 antibody or with control IgG. Lysates and precipitates were immunoblotted with anti‐phospho‐(K/R)(K/R)X(S*/T*) and anti‐OFD1 antibodies.
- B
Western blot analysis of affinity‐isolated endogenous OFD1. Hela cells transiently expressing PKAc‐YFP were serum‐deprived for 48 h and lysed. Total lysates were immunoprecipitated with anti‐HA (control IP) or with anti‐OFD1 antibody. An aliquot of whole cell lysate (WCL) and the precipitates were immunoblotted for OFD1. Gel‐isolated OFD1‐containing fragments were subjected to mass spectrometric analysis.
- C
Fragment spectrum of m/z 426.5708 [M + 3H]3+ with the identified y‐ and b‐fragment ions of the phosphorylated OFD1 peptide LpSSTPLPKAKR. b2*: b2‐fragment ion containing dehydrolalanine, which represents the formerly phosphorylated serine residue. Dehydroalanine is formed from phosphoserine during collision‐induced dissociation in HCD (Higher‐energy Collisional Dissociation) due to the neutral loss of H3PO4. The phosphorylated peptide was identified by a Sequest data base search using Percolator with a q‐value of 7e‐4.
- D
Extracted ion chromatograms (EICs) of the b‐ and y‐fragment ions showing that all fragment ions co‐elute.
- A
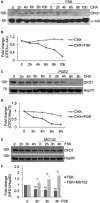
HEK293 cells were serum‐deprived for 24 h, treated with cycloheximide (100 μM) with or without FSK (40 μM) and harvested at the indicated time points. Lysates were immunoblotted with anti‐OFD1 and anti‐α‐tubulin antibodies.
- B
Quantitative analysis of the experiments shown in (A). A mean value of two independent experiments that gave similar results is shown.
- C
Same as in (A), with the exception that PGE2 (1 μM) was used instead of FSK. Lysates were immunoblotted with anti‐OFD1 and anti‐Hsp70 antibodies.
- D
Quantitative analysis of the experiments shown in (C). A mean value of two independent experiments that gave similar results is shown.
- E
HEK293 cells were serum‐deprived for 24 h, treated with cycloheximide (100 μM) and treated with FSK (40 μM) for the indicated times. Where indicated, MG132 (20 μM) was added to the medium. Lysates were immunoblotted with anti‐OFD1 and anti‐Hsp90 antibodies.
- F
Quantitative analysis of the experiments shown in (E). A mean value ± SD of three independent experiments is shown. Student’s t test *P < 0.05, **P < 0.01.
- A
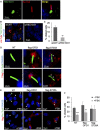
Immunostaining analysis of serum‐deprived HEK293 cells for TBC1D31, acetylated α‐tubulin and DRAQ5.
- B
Human U‐87MG glioblastoma cells transfected with control siRNA (siCNT) or siRNA targeting TBC1D31 (siTBC1D31) were serum‐deprived for 36 h, fixed and stained for acetylated‐tubulin, TBC1D31 and DRAQ5.
- C
Quantitative analysis of the experiments shown in (B). A mean value ± SD of three independent experiments is shown. Student’s t test **P < 0.01.
- D
HEK293 cells were transiently transfected with flag‐OFD1 or flag‐S735A, serum‐deprived for 36 h, fixed and immunostained for flag, acetylated‐tubulin and DRAQ5.
- E
NIH3T3 cells transiently expressing flag‐OFD1 or flag‐S735A were serum‐deprived for 36 h, treated with FSK (6 h), fixed and immunostained for flag, acetylated‐tubulin and DRAQ5.
- F
Statistical analysis of the experiments shown in (E). A mean value ± SD of three independent experiments is shown. Student’s t test, ***P < 0.001, **P < 0.01.
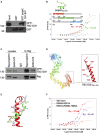
- A
Lysates from HEK293 cells expressing GFP‐TBC1D31 were subjected to pull down assay with GST and GST‐praja2531–631 polypeptides.
- B
MST signal (normalized fluorescence) of P1 (red curve), P2 (green curve) and P3 (cyan curve) plotted against TBC1D31, at increasing concentrations of peptides. The threading modelled structure of the overlapping binding segment of praja2 (praja2550–570) is shown.
- C
Co‐immunoprecipitation of GFP‐TBC1D31 and flag‐praja2 ring mutant (flag‐praja2rm) or praja2Δ550–570.
- D
Threading modelled structure of TBC1D31, with a zoom of its C‐terminus. Mutated residues are highlighted in stick coloured by atom type.
- E
MD derived binding mode of praja2530–570 (green cartoon) to the C‐terminal region of TBC1D31 (red cartoon).
- F
MST signal of P1 plotted against increasing concentrations of TBC1D31 peptides: wild‐type (red curve), R948A‐R951A (violet curve) and R957‐R959D‐H960A (orange curve).
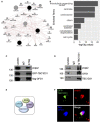
- A
Protein–protein interaction network of physical interactors of OFD1, praja2 and TBC1D31. Node size represents the degree of association of the proteins (grey nodes) associated with the input proteins set (black nodes). Edge size is representative of the strength of the mapped interaction between the two connecting nodes.
- B
The bar plot reports the statistical significance of selected sets of Gene Ontology functional annotations enriched by the nodes in the network. Statistical significance is reported as ‐log10[P‐value] on the X axis, enriched functional annotations are reported on the Y axis.
- C
Lysates from HEK293 cells expressing GFP‐TBC1D31 and flag‐OFD1 were immunoprecipitated with anti‐flag or control IgG. Endogenous praja2 and the overexpressed transgenes were revealed by immunoblot analysis.
- D
Total lysates from mouse brain were immunoprecipitated with anti‐TBC1D31 antibodies or with control IgG. The precipitates and an aliquot of lysates were immunoblotted with the indicated antibodies.
- E
Schematic picture of the assembled TBC1D31/OFD1/praja2/PKA complex.
- F
HEK293 cells were transiently co‐transfected with GFP‐TBC1D31 and flag‐OFD1. Cells were fixed and stained for flag and praja2.

- A
Schematic representation of OFD1 domain organization, with the predicted PKA phosphorylation sites and the position of S735 and S899 in the human variant.
- B
GST‐fused, recombinant OFD1 polypeptides were used as substrates for in vitro phosphorylation assays using purified PKAc. GST‐immobilized fusions were immunoblotted with an anti‐phospho‐(K/R)(K/R)X(S*/T*) antibody. A representative set of three independent experiments is shown. A Ponceau S staining of recombinant GST‐OFD1 polypeptides is shown on the right panel. *Degradation products.
- C
HEK293 cells transiently expressing flag‐OFD1 or flag‐S735A mutant were starved for 24 h and then treated with forskolin (FSK, 40 μM/1 h). Where indicated, cells were pre‐treated with H89 (10 μM). Lysates were subjected to flag immunoprecipitation and immunoblot analysis with anti‐phospho‐PKA substrates and anti‐flag antibodies. Anti‐GFP IgG were used as control.
- D
Quantitative analysis of the experiments shown in (C). A mean value ± SD of three independent experiments is shown. Student’s t test, *P < 0.05, **P < 0.01.
- E
Same as in (C), with the exception that cells were co‐transfected with flag‐OFD1 vector and with control siRNA (siCNT) or siRNA targeting praja2.
- F
Quantitative analysis of the experiments shown in (E). A mean value ± SD of three independent experiments is shown. Student’s t test, *P < 0.05.
- G
Schematic picture of the assembled TBC1D31 complex showing that following cAMP stimulation PKA phosphorylates the co‐assembled OFD1.
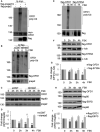
- A
Immunoprecipitation of OFD1 from HEK293 cell lysates expressing myc‐OFD1, ubiquitin‐HA and flag‐praja2 (or flag‐praja2rm). The precipitates were immunoblotted with anti‐HA (ubiquitinated OFD1) and anti‐myc antibodies. Flag‐praja2 expression was evaluated in total lysates.
- B
Flag‐OFD1 and ubiquitin‐HA vectors were co‐transfected with control siRNA or siRNA targeting praja2 (sipraja2). Serum‐deprived cells were left untreated or stimulated with FSK for 1 h. Ubiquitinated OFD1 and the levels of endogenous praja2 were detected as in (A).
- C
HEK293 cells transfected with siRNAs were serum‐deprived, pre‐treated with cycloheximide and stimulated with FSK at different time points. Lysates were immunoblotted for endogenous praja2 and OFD1. Hsp90 was used as loading control.
- D
Quantitative analysis of the experiments shown in (C). A mean value ± SD of three independent experiments is shown. Student’s t test * P < 0.05; ** < 0.01 versus sipraja2 (+FSK) and basal values (0).
- E
Ubiquitination of flag‐OFD1 or flag‐S735A in HEK293 cells treated with FSK for 1 h.
- F
Immunoblot analysis of flag‐OFD1 or flag‐S735A in HEK293 cells stimulated with FSK as in (C). The levels of α‐tubulin were used as loading control.
- G
Quantitative analysis of the experiments shown in (F). A mean value ± SD of three independent experiments is shown. Student’s t test *P < 0.05 versus S735A mutant (3 h and 4 h, +FSK) and basal values (0).
- H
Immunoblot analysis of flag‐OFD1 or flag‐E97G mutant in HEK293 cells stimulated with FSK as in (C).
- I
Quantitative analysis of the experiments shown in (H). A mean value ± SD of three independent experiments is shown. Student’s t test, *P < 0.05 versus E97G mutant (+FSK) and basal values (0).
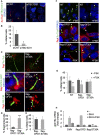
- A
siRNA transfected HEK293 cells were serum‐deprived and stained for acetylated‐tubulin, TBC1D31 and DRAQ5.
- B
Quantitative analysis of the experiments shown in (A). A mean value ± SD of four independent experiments is shown. Student’s t test *P < 0.05.
- C
HEK293 cells expressing flag‐OFD1 or flag‐S735A were serum‐deprived and subjected to staining analysis for acetylated α‐tubulin, flag and DRAQ5. Images were collected by super‐resolution microscopy (upper panels). Where indicated, flag‐OFD1 or flag‐S735A was co‐transfected with cilia‐APEX‐GFP vector (middle panels). NIH3T3 expressing flag‐OFD1 or flag‐S735A were stained with anti‐ARL13B and anti‐flag antibodies.
- D, E
Statistical analysis of the experiments shown in (C). A mean value ± SD of three independent experiments is shown. For each experimental group, a minimum of 40 cilia were analysed. Student’s t test ***P < 0.001.
- F
HEK293 cells transiently transfected with flag‐OFD1 or flag‐S735A were serum‐deprived, treated with FSK (6 h) and stained for flag, acetylated‐tubulin and DRAQ5.
- G
Statistical analysis of the experiments shown in (F). A mean value ± SD of three independent experiments is shown. Cells analysed for each experiment: 300 for NT, 80 for flag‐OFD1 and 80 for flag‐S735A. Student’s t test, *P < 0.05, **P < 0.01.
- H
Quantitative RT–PCR analysis showing levels of Gli2 mRNA in NIH3T3 fibroblasts transfected with vectors for flag‐OFD1 and flag‐S735A. An empty vector (CMV) was used as control. Serum‐deprived cells were stimulated with the SHH ligand purmorphamine (1 μM) for 24 h. Where indicated, cells were treated with FSK for 6 h before harvesting. The data represent a mean value ± SD of three independent experiments. Student’s t test, P** < 0.01.
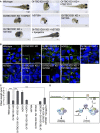
- A
Stereo‐microscopic images of wild‐type, Ol‐TBC1D31 KD, Ol‐TBC1D31 KD + hTBC1D31, Ol‐TBC1D31 KD + wild‐type hOFD1, hOFD1S735A, Ol‐TBC1D31 KD + hOFD1S735A, Ol‐TBC1D31 KD + hOFD1S735D and Ol‐TBC1D31 KD + hOFD1S735D + hpraja2rm injected Medaka larvae, at stage 40.
- B
Confocal images of cilia of the neural tube cells in the wild‐type, Ol‐TBC1D31 KD, Ol‐TBC1D31 KD + hTBC1D31, wild‐type hOFD1, Ol‐TBC1D31 KD + wild‐type hOFD1, hOFD1S735A, Ol‐TBC1D31 KD + hOFD1S735A, Ol‐TBC1D31 KD + hOFD1S735D and Ol‐TBC1D31 KD + hOFD1S735D + hpraja2rm stained with anti‐acetylated α‐tubulin antibody (green) and DAPI (blue).
- C
In the graph is reported the cilia length in wild‐type, Ol‐TBC1D31 KD, Ol‐TBC1D31 KD + hTBC1D31, wild‐type hOFD1, Ol‐TBC1D31 KD + wild‐type hOFD1, hOFD1S735A, Ol‐TBC1D31 KD + hOFD1S735A, Ol‐TBC1D31 KD + hOFD1S735D and Ol‐TBC1D31 KD + hOFD1S735D + hpraja2rm. The data are expressed as mean value ± SE of twelve independent experiments. Student’s t test, ***P ≤ 0.001.
- D
TBC1D31 assembled complex at centrosome positively regulates ciliogenesis and signalling. Ligand (L)‐induced stimulation of G‐protein coupled receptors (GPCRs) activates the adenylate cyclase (AC) and elevates cAMP levels, which in turn activates PKA. PKA phosphorylates OFD1 at S735, priming the ciliopathy protein to praja2‐dependent ubiquitylation and proteasomal degradation. Decreasing the levels of OFD1 negatively impacts on cilium biogenesis and downstream signalling.
References
-
- Abramowicz I, Carpenter G, Alfieri M, Colnaghi R, Outwin E, Parent P, Thauvin‐Robinet C, Iaconis D, Franco B, O'Driscoll M (2017) Oral‐facial‐digital syndrome type I cells exhibit impaired DNA repair; unanticipated consequences of defective OFD1 outside of the cilia network. Hum Mol Genet 26: 19–32 - PubMed
-
- Alfieri M, Iaconis D, Tammaro R, Perone L, Cali G, Nitsch L, Dougherty GW, Ragnini‐Wilson A, Franco B (2020) The centrosomal/basal body protein OFD1 is required for microtubule organization and cell cycle progression. Tissue Cell 64: 101369 - PubMed
Publication types
MeSH terms
Substances
Grants and funding
LinkOut - more resources
Full Text Sources
Other Literature Sources
Molecular Biology Databases

